

A comparison of the Indian diet with the EAT-Lancet reference diet
- PMID: 32471408
- PMCID: PMC7260780
- DOI: 10.1186/s12889-020-08951-8
A comparison of the Indian diet with the EAT-Lancet reference diet
Abstract
Background: The 2019 EAT-Lancet Commission report recommends healthy diets that can feed 10 billion people by 2050 from environmentally sustainable food systems. This study compares food consumption patterns in India, from different income groups, regions and sectors (rural/urban), with the EAT-Lancet reference diet and highlights the deviations.
Methods: The analysis was done using data from the Consumption Expenditure Survey (CES) of a nationally representative sample of 0.102 million households from 7469 villages and 5268 urban blocks of India conducted by the National Sample Survey Organization (NSSO) in 2011-12. This is the most recent nationally representative data on household consumption in India. Calorie consumption (kcal/capita/day) of each food group was calculated using the quantity of consumption from the data and nutritional values of food items provided by NSSO. Diets for rural and urban, poor and rich households across different regions were compared with EAT-Lancet reference diet.
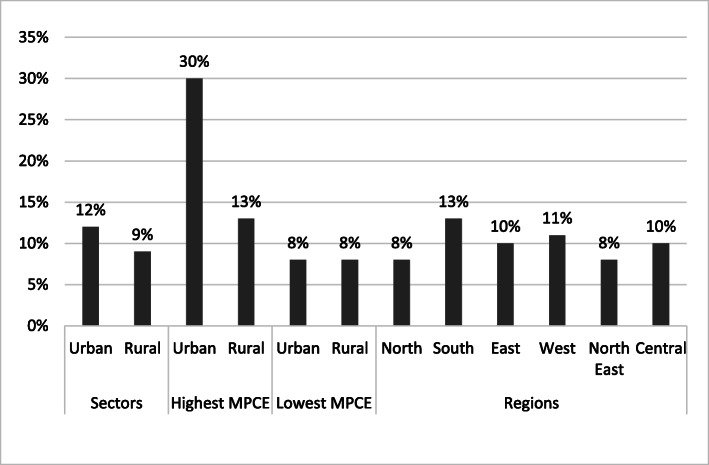
Results: The average daily calorie consumption in India is below the recommended 2503 kcal/capita/day across all groups compared, except for the richest 5% of the population. Calorie share of whole grains is significantly higher than the EAT-Lancet recommendations while those of fruits, vegetables, legumes, meat, fish and eggs are significantly lower. The share of calories from protein sources is only 6-8% in India compared to 29% in the reference diet. The imbalance is highest for the households in the lowest decile of consumption expenditure, but even the richest households in India do not consume adequate amounts of fruits, vegetables and non-cereal proteins in their diets. An average Indian household consumes more calories from processed foods than fruits.
Conclusions: Indian diets, across states and income groups, are unhealthy. Indians also consume excess amounts of cereals and not enough proteins, fruits, and vegetables. Importantly, unlike many countries, excess consumption of animal protein is not a problem in India. Indian policymakers need to accelerate food-system-wide efforts to make healthier and sustainable diets more affordable, accessible and acceptable.
Keywords: Calories; Consumption; Diet; EAT-Lancet; Food system; India; NSS; Processed food; Protein; Reference diet.
Conflict of interest statement
The authors declare that they have no competing interests.
Figures


References
-
- Development Initiatives. Global Nutrition Report: Shining a light to spur action on nutrition 2018. Bristol, UK; 2018. Available from: https://www.who.int/nutrition/globalnutritionreport/2018_Global_Nutritio.... [cited 2019 Apr 15].
-
- WHO . A Comprehensive Global Monitoring Framework, including indicators, and a set of voluntary global targets for the prevention and control of noncommunicable diseases. 2012.
-
- Doak CM, Adair LS, Bentley M, Monteiro C, Popkin BM. The dual burden household and the nutrition transition paradox. Int J Obes. 2005;29:129–136. - PubMed
Publication types
MeSH terms
LinkOut - more resources
Full Text Sources
Medical
