

Escherichia coli metabolism under short-term repetitive substrate dynamics: adaptation and trade-offs
- PMID: 32471427
- PMCID: PMC7260802
- DOI: 10.1186/s12934-020-01379-0
Escherichia coli metabolism under short-term repetitive substrate dynamics: adaptation and trade-offs
Abstract
Background: Microbial metabolism is highly dependent on the environmental conditions. Especially, the substrate concentration, as well as oxygen availability, determine the metabolic rates. In large-scale bioreactors, microorganisms encounter dynamic conditions in substrate and oxygen availability (mixing limitations), which influence their metabolism and subsequently their physiology. Earlier, single substrate pulse experiments were not able to explain the observed physiological changes generated under large-scale industrial fermentation conditions.
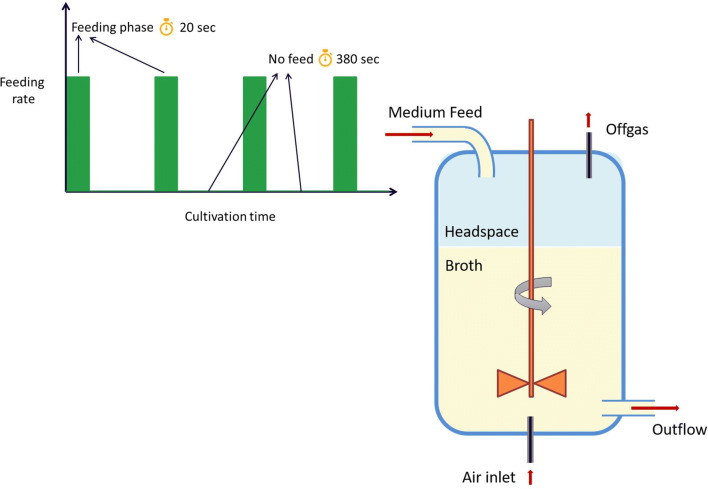
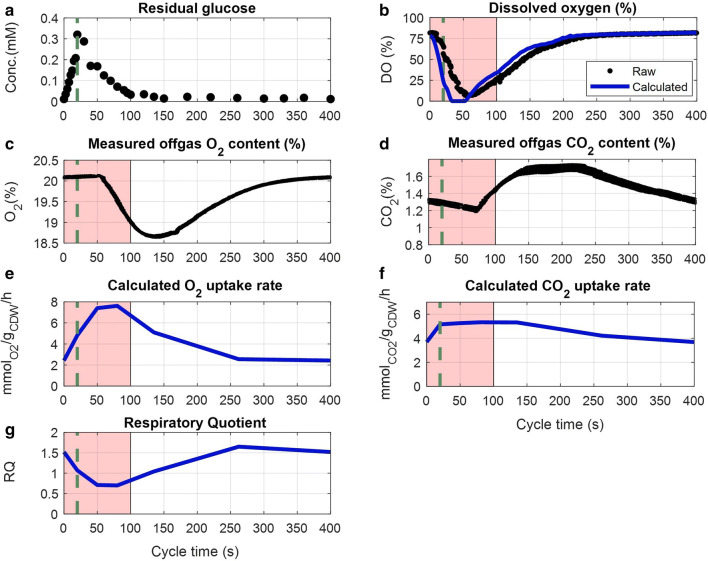
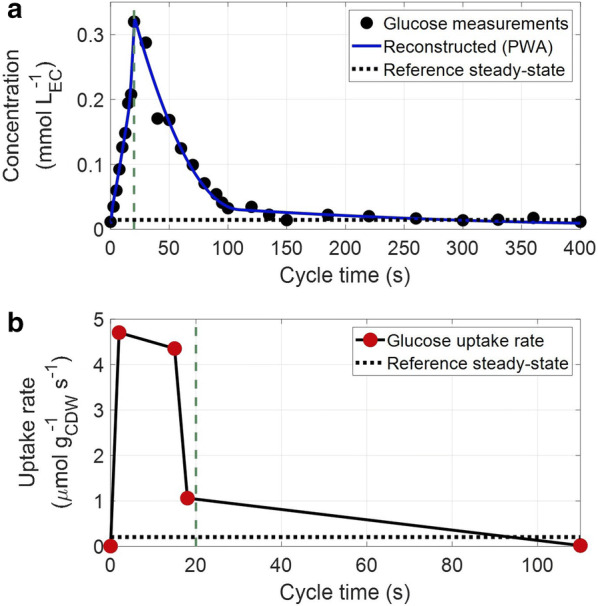
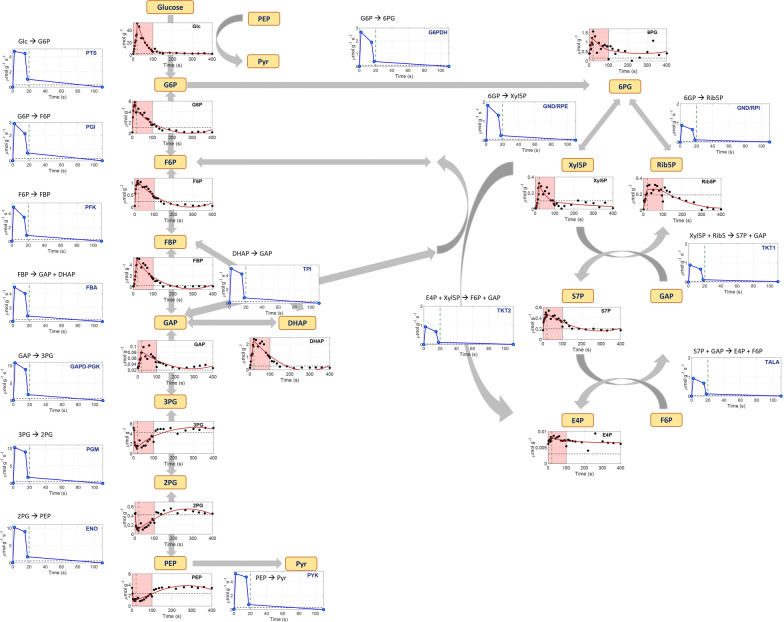
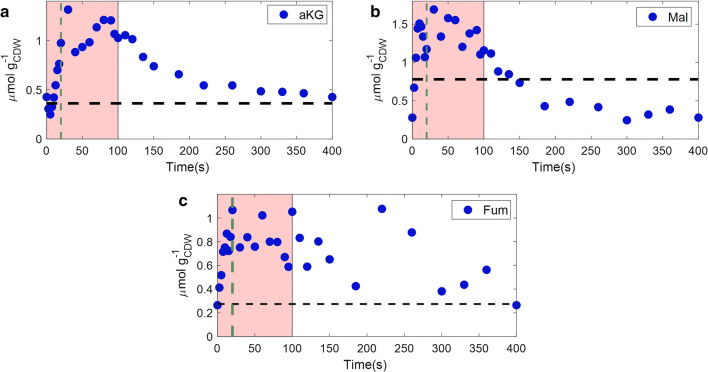
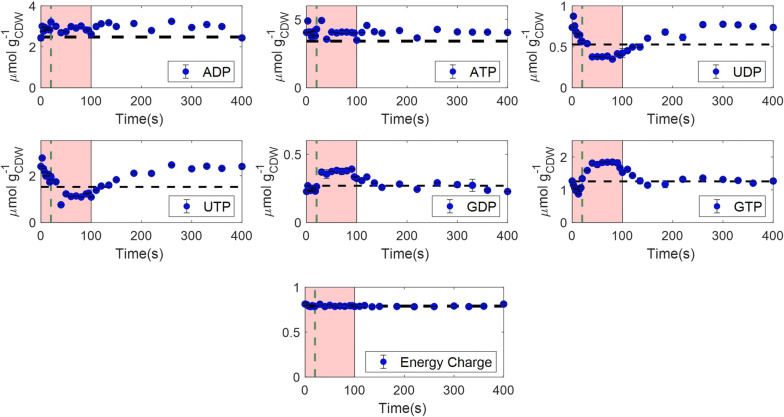
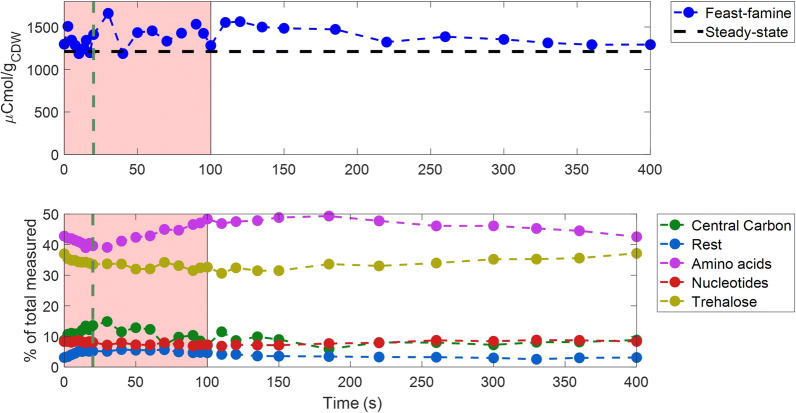
Results: In this study we applied a repetitive feast-famine regime in an aerobic Escherichia coli culture in a time-scale of seconds. The regime was applied for several generations, allowing cells to adapt to the (repetitive) dynamic environment. The observed response was highly reproducible over the cycles, indicating that cells were indeed fully adapted to the regime. We observed an increase of the specific substrate and oxygen consumption (average) rates during the feast-famine regime, compared to a steady-state (chemostat) reference environment. The increased rates at same (average) growth rate led to a reduced biomass yield (30% lower). Interestingly, this drop was not followed by increased by-product formation, pointing to the existence of energy-spilling reactions. During the feast-famine cycle, the cells rapidly increased their uptake rate. Within 10 s after the beginning of the feeding, the substrate uptake rate was higher (4.68 μmol/gCDW/s) than reported during batch growth (3.3 μmol/gCDW/s). The high uptake led to an accumulation of several intracellular metabolites, during the feast phase, accounting for up to 34% of the carbon supplied. Although the metabolite concentrations changed rapidly, the cellular energy charge remained unaffected, suggesting well-controlled balance between ATP producing and ATP consuming reactions.
Conclusions: The adaptation of the physiology and metabolism of E. coli under substrate dynamics, representative for large-scale fermenters, revealed the existence of several cellular mechanisms coping with stress. Changes in the substrate uptake system, storage potential and energy-spilling processes resulted to be of great importance. These metabolic strategies consist a meaningful step to further tackle reduced microbial performance, observed under large-scale cultivations.
Keywords: Dynamic metabolic responses; Energy homeostasis; Escherichia coli; Feast–famine; Substrate dynamics.
Conflict of interest statement
The authors declare that they have no competing interests.
Figures
Similar articles
-
Fast "Feast/Famine" Cycles for Studying Microbial Physiology Under Dynamic Conditions: A Case Study with Saccharomyces cerevisiae.Metabolites. 2014 May 15;4(2):347-72. doi: 10.3390/metabo4020347. Metabolites. 2014. PMID: 24957030 Free PMC article.
-
Exploring small-scale chemostats to scale up microbial processes: 3-hydroxypropionic acid production in S. cerevisiae.Microb Cell Fact. 2019 Mar 11;18(1):50. doi: 10.1186/s12934-019-1101-5. Microb Cell Fact. 2019. PMID: 30857529 Free PMC article.
-
An industrial perspective on metabolic responses of Penicillium chrysogenum to periodic dissolved oxygen feast-famine cycles in a scale-down system.Biotechnol Bioeng. 2024 Oct;121(10):3076-3098. doi: 10.1002/bit.28782. Epub 2024 Jun 22. Biotechnol Bioeng. 2024. PMID: 39382054
-
Upflow anaerobic sludge blanket reactor--a review.Indian J Environ Health. 2001 Apr;43(2):1-82. Indian J Environ Health. 2001. PMID: 12397675 Review.
-
Flux analysis and control of the central metabolic pathways in Escherichia coli.FEMS Microbiol Rev. 1996 Dec;19(2):85-116. doi: 10.1111/j.1574-6976.1996.tb00255.x. FEMS Microbiol Rev. 1996. PMID: 8988566 Review.
Cited by
-
Metabolic Dynamics in Short- and Long-Term Microgravity in Human Primary Macrophages.Int J Mol Sci. 2021 Jun 23;22(13):6752. doi: 10.3390/ijms22136752. Int J Mol Sci. 2021. PMID: 34201720 Free PMC article.
-
Optimized Fast Filtration-Based Sampling and Extraction Enables Precise and Absolute Quantification of the Escherichia coli Central Carbon Metabolome.Metabolites. 2023 Jan 18;13(2):150. doi: 10.3390/metabo13020150. Metabolites. 2023. PMID: 36837769 Free PMC article.
-
Scale-down bioreactors-comparative analysis of configurations.Bioprocess Biosyst Eng. 2025 Jun 5. doi: 10.1007/s00449-025-03182-w. Online ahead of print. Bioprocess Biosyst Eng. 2025. PMID: 40471288 Review.
-
Comparative study of virulence potential, phylogenetic origin, CRISPR-Cas regions and drug resistance of Escherichia coli isolates from urine and other clinical materials.Front Microbiol. 2023 Nov 29;14:1289683. doi: 10.3389/fmicb.2023.1289683. eCollection 2023. Front Microbiol. 2023. PMID: 38094634 Free PMC article.
-
Strategic targeting of AckA in Mycobacterium tuberculosis using peptide inhibitors.Arch Microbiol. 2025 Aug 22;207(10):235. doi: 10.1007/s00203-025-04439-4. Arch Microbiol. 2025. PMID: 40844623
References
-
- Choi S, Song CW, Shin JH, Lee SY. Biorefineries for the production of top building block chemicals and their derivatives. Metab Eng. 2015;28:223–239. - PubMed
-
- Gavrilescu M, Chisti Y. Biotechnology—a sustainable alternative for chemical industry. Biotechnol Adv. 2005;23:471–499. - PubMed
-
- Lee JW, Kim HU, Choi S, Yi J, Lee SY. Microbial production of building block chemicals and polymers. Curr Opin Biotechnol. 2011;22:758–767. - PubMed
-
- Straathof AJJ, Wahl SA, Benjamin KR, Takors R, Wierckx N, Noorman HJ. Grand research challenges for sustainable industrial biotechnology. Trends Biotechnol. 2019;37:1042–1050. - PubMed
-
- Humphrey A. Shake flask to fermentor: what have we learned? Biotechnol Prog. 1998;14:3–7.
MeSH terms
Substances
Grants and funding
LinkOut - more resources
Full Text Sources
