

Metabolic syndrome and myocardium steatosis in subclinical type 2 diabetes mellitus: a 1H-magnetic resonance spectroscopy study
- PMID: 32471503
- PMCID: PMC7260782
- DOI: 10.1186/s12933-020-01044-1
Metabolic syndrome and myocardium steatosis in subclinical type 2 diabetes mellitus: a 1H-magnetic resonance spectroscopy study
Abstract
Background: Metabolic syndrome (MetS) is a cluster of metabolic abnormalities that collectively cause an increased risk of type 2 diabetes mellitus (T2DM) and nonatherosclerotic cardiovascular disease. This study aimed to evaluate the role of myocardial steatosis in T2DM patients with or without MetS, as well as the relationship between subclinical left ventricular (LV) myocardial dysfunction and myocardial steatosis.
Methods and materials: We recruited 53 T2DM patients and 20 healthy controls underwent cardiac magnetic resonance examination. All T2DM patients were subdivide into two group: MetS group and non-MetS. LV deformation, perfusion parameters and myocardial triglyceride (TG) content were measured and compared among these three groups. Pearson's and Spearman analysis were performed to investigate the correlation between LV cardiac parameters and myocardial steatosis. The receiver operating characteristic curve (ROC) was performed to illustrate the relationship between myocardial steatosis and LV subclinical myocardial dysfunction.
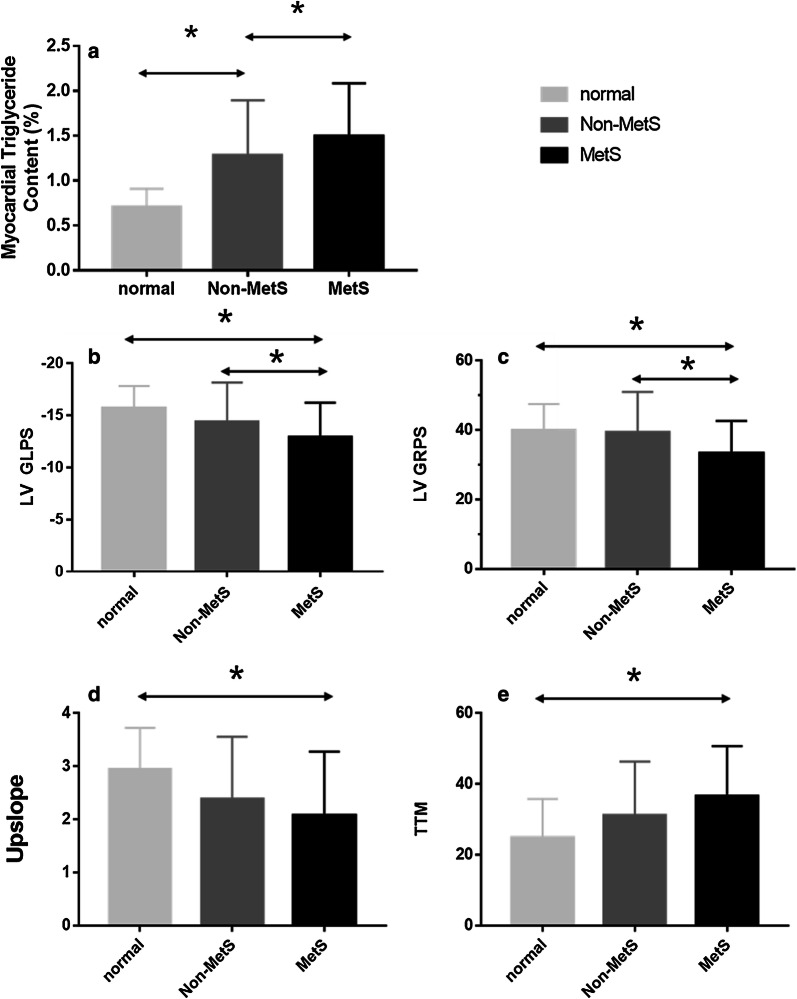
Results: An increase in myocardial TG content was found in the MetS group compared with that in the other groups (MetS vs. non-MetS: 1.54 ± 0.63% vs. 1.16 ± 0.45%; MetS vs. normal: 1.54 ± 0.63% vs. 0.61 ± 0.22%; all p < 0.001). Furthermore, reduced LV deformation [reduced longitudinal and radial peak strain (PS); all p < 0.017] and microvascular dysfunction [increased time to maximum signal intensity (TTM) and reduced Upslope; all p < 0.017)] was found in the MetS group. Myocardial TG content was positively associated with MetS (r = 0.314, p < 0.001), and it was independently associated with TTM (β = 0.441, p < 0.001) and LV longitudinal PS (β = 0.323, p = 0.021). ROC analysis exhibited that myocardial TG content might predict the risk of decreased LV longitudinal myocardial deformation (AUC = 0.74) and perfusion function (AUC = 0.71).
Conclusion: Myocardial TG content increased in T2DM patients with concurrent MetS. Myocardial steatosis was positively associated with decreased myocardial deformation and perfusion dysfunction, which may be an indicator for predicting diabetic cardiomyopathy.
Keywords: 1H-magnetic resonance spectroscopy; Metabolic syndrome; Myocardial steatosis; Subclinical myocardial dysfunction.
Conflict of interest statement
The authors declare that there are no conflicts of interest.
Figures


Similar articles
-
Myocardial steatosis across the spectrum of human health and disease.Exp Physiol. 2024 Feb;109(2):202-213. doi: 10.1113/EP091566. Epub 2023 Dec 8. Exp Physiol. 2024. PMID: 38063136 Free PMC article. Review.
-
Left ventricular subclinical myocardial dysfunction in uncomplicated type 2 diabetes mellitus is associated with impaired myocardial perfusion: a contrast-enhanced cardiovascular magnetic resonance study.Cardiovasc Diabetol. 2018 Oct 30;17(1):139. doi: 10.1186/s12933-018-0782-0. Cardiovasc Diabetol. 2018. PMID: 30373588 Free PMC article.
-
Cardiac steatosis and left ventricular function in men with metabolic syndrome.J Cardiovasc Magn Reson. 2013 Nov 14;15(1):103. doi: 10.1186/1532-429X-15-103. J Cardiovasc Magn Reson. 2013. PMID: 24228979 Free PMC article.
-
The additive effects of type 2 diabetes mellitus on left ventricular deformation and myocardial perfusion in essential hypertension: a 3.0 T cardiac magnetic resonance study.Cardiovasc Diabetol. 2020 Sep 30;19(1):161. doi: 10.1186/s12933-020-01138-w. Cardiovasc Diabetol. 2020. PMID: 32998742 Free PMC article.
-
Atherogenic Index of Plasma in Metabolic Syndrome-A Systematic Review and Meta-Analysis.Medicina (Kaunas). 2025 Mar 27;61(4):611. doi: 10.3390/medicina61040611. Medicina (Kaunas). 2025. PMID: 40282902 Free PMC article.
Cited by
-
Myocardial steatosis across the spectrum of human health and disease.Exp Physiol. 2024 Feb;109(2):202-213. doi: 10.1113/EP091566. Epub 2023 Dec 8. Exp Physiol. 2024. PMID: 38063136 Free PMC article. Review.
-
Characterizing diabetic cardiomyopathy: baseline results from the ARISE-HF trial.Cardiovasc Diabetol. 2024 Feb 1;23(1):49. doi: 10.1186/s12933-024-02135-z. Cardiovasc Diabetol. 2024. PMID: 38302936 Free PMC article.
-
Pooled prevalence and associated factors of ECG abnormality among type 2 diabetic patients in the last ten years: Systematic review and meta-analysis.PLoS One. 2025 Mar 13;20(3):e0319173. doi: 10.1371/journal.pone.0319173. eCollection 2025. PLoS One. 2025. PMID: 40080468 Free PMC article.
-
S-Propargyl-Cysteine Attenuates Diabetic Cardiomyopathy in db/db Mice Through Activation of Cardiac Insulin Receptor Signaling.Front Cardiovasc Med. 2021 Sep 17;8:737191. doi: 10.3389/fcvm.2021.737191. eCollection 2021. Front Cardiovasc Med. 2021. PMID: 34604360 Free PMC article.
-
Phenotyping heart failure by cardiac magnetic resonance imaging of cardiac macro- and microscopic structure: state of the art review.Eur Heart J Cardiovasc Imaging. 2023 Sep 26;24(10):1302-1317. doi: 10.1093/ehjci/jead124. Eur Heart J Cardiovasc Imaging. 2023. PMID: 37267310 Free PMC article. Review.
References
-
- Yoneyama K, Venkatesh BA, Wu CO, Mewton N, Gjesdal O, Kishi S, McClelland RL, Bluemke DA, Lima JA. Diabetes mellitus and insulin resistance associate with left ventricular shape and torsion by cardiovascular magnetic resonance imaging in asymptomatic individuals from the multi-ethnic study of atherosclerosis. J Cardiovasc Magn Reson. 2018;187(4177):652–653. - PMC - PubMed
-
- Korosoglou G, Humpert PM, Ahrens J, et al. Left ventricular diastolic function in type 2 diabetes mellitus is associated with myocardial triglyceride content but not with impaired myocardial perfusion reserve. J Magn Reson Imaging. 2012;35(4):804–811. - PubMed
-
- Grundy SM, Cleeman JI, Daniels SR, et al. Diagnosis and Management of the Metabolic Syndrome An American Heart Association/National Heart, Lung, and Blood Institute Scientific Statement. Circulation. 2006;112:2735–2752. - PubMed
-
- O’Neill S, O’Driscoll L. Metabolic syndrome: a closer look at the growing epidemic and its associated pathologies. Obes Rev. 2015;16(1):1–12. - PubMed
Publication types
MeSH terms
Substances
LinkOut - more resources
Full Text Sources
Medical
Miscellaneous
