

HTLV-1 induces T cell malignancy and inflammation by viral antisense factor-mediated modulation of the cytokine signaling
- PMID: 32471947
- PMCID: PMC7306771
- DOI: 10.1073/pnas.1922884117
HTLV-1 induces T cell malignancy and inflammation by viral antisense factor-mediated modulation of the cytokine signaling
Abstract
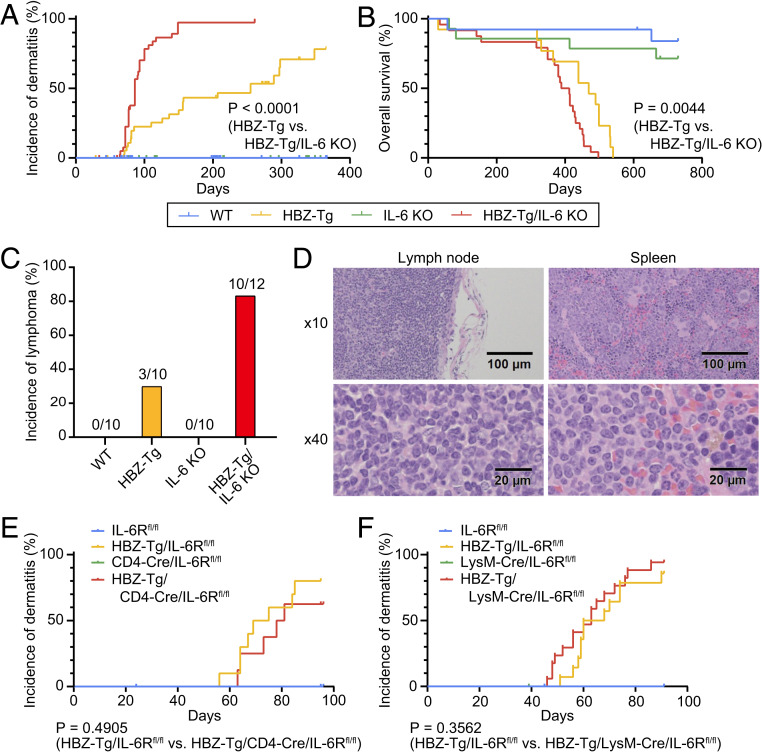
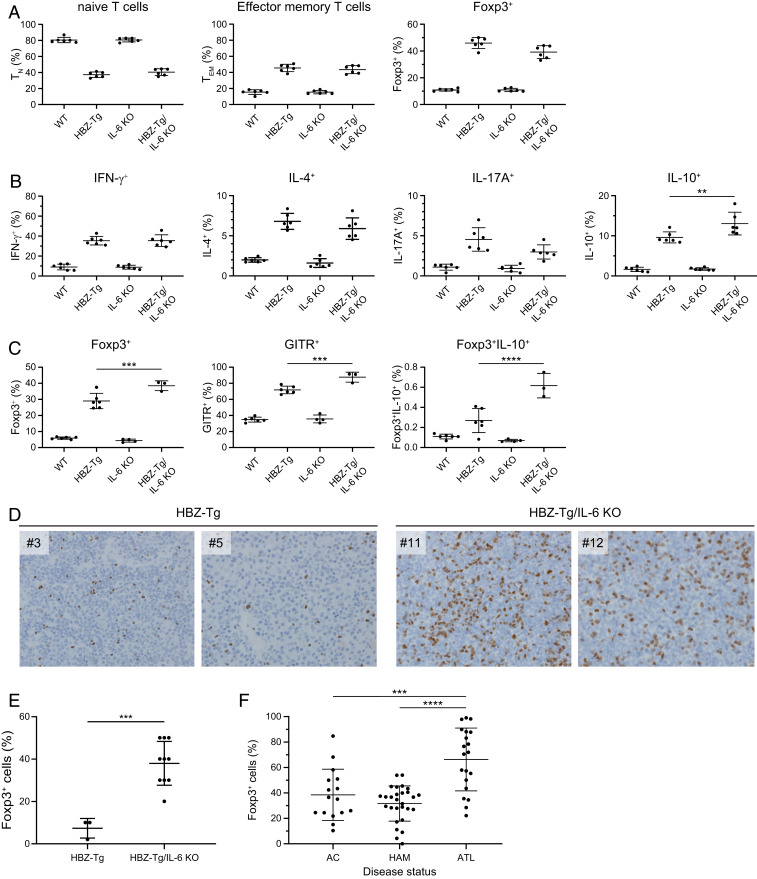
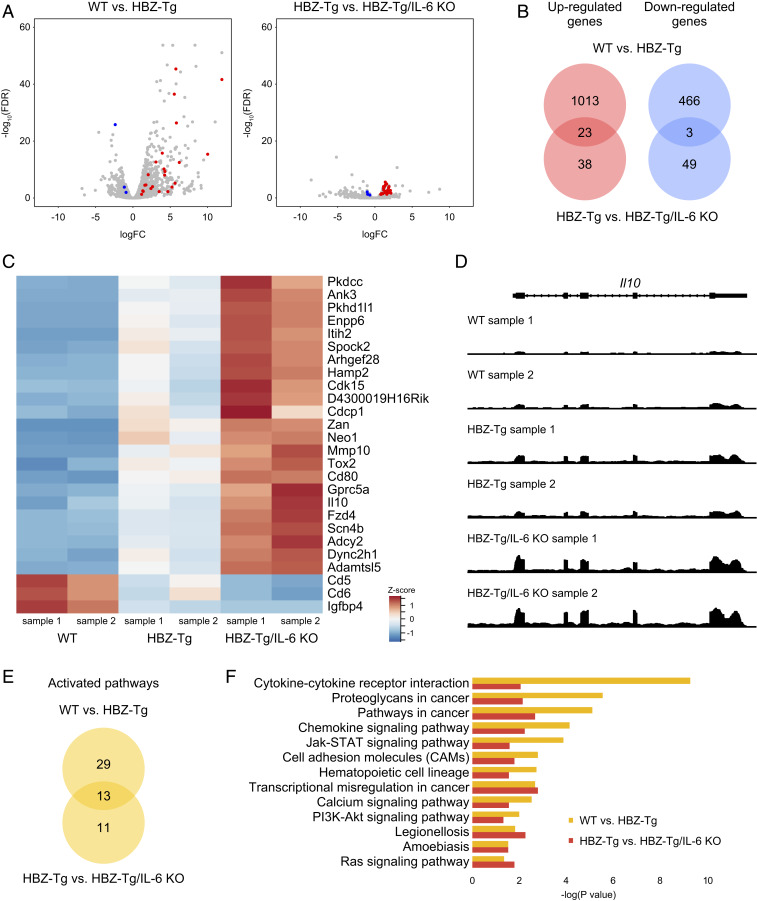
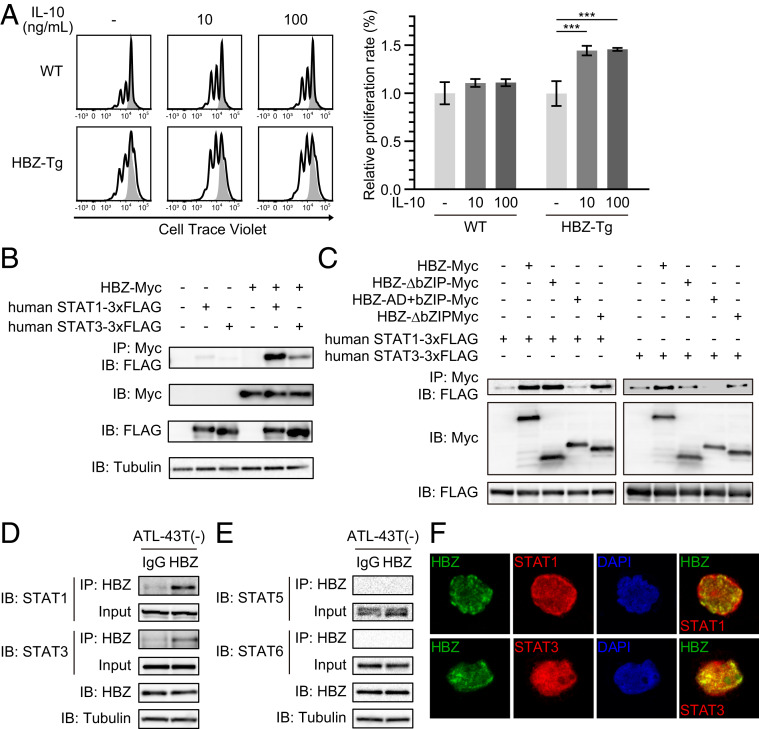
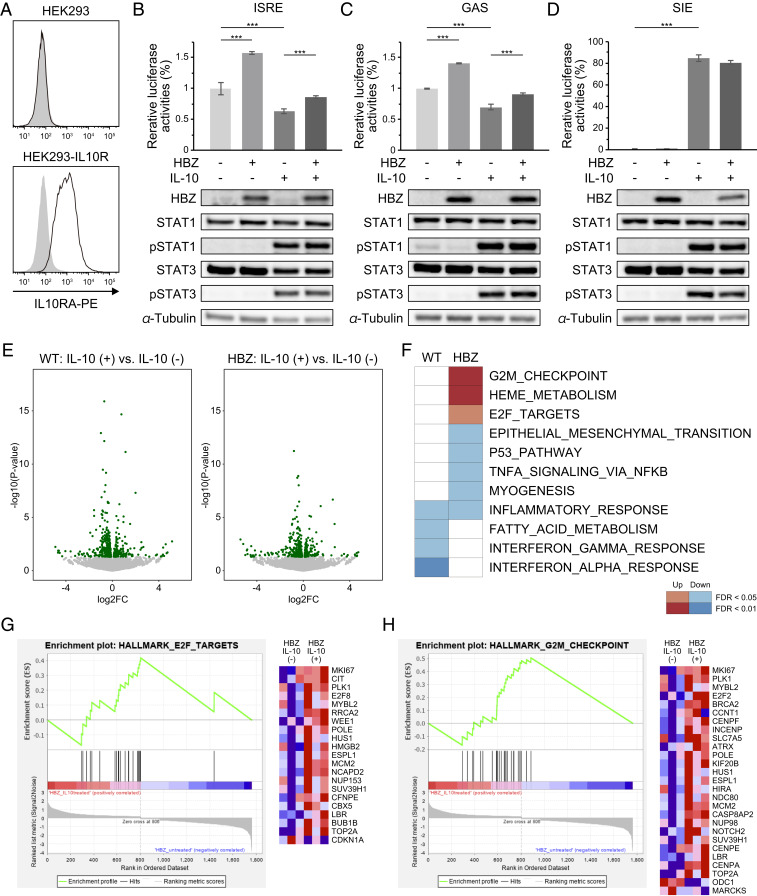
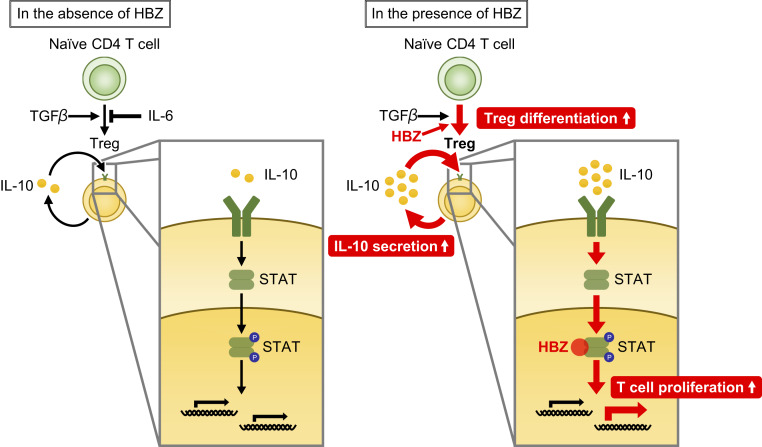
Human T cell leukemia virus type 1 (HTLV-1) is the etiologic agent of a T cell neoplasm and several inflammatory diseases. A viral gene, HTLV-1 bZIP factor (HBZ), induces pathogenic Foxp3-expressing T cells and triggers systemic inflammation and T cell lymphoma in transgenic mice, indicating its significance in HTLV-1-associated diseases. Here we show that, unexpectedly, a proinflammatory cytokine, IL-6, counteracts HBZ-mediated pathogenesis. Loss of IL-6 accelerates inflammation and lymphomagenesis in HBZ transgenic mice. IL-6 innately inhibits regulatory T cell differentiation, suggesting that IL-6 functions as a suppressor against HBZ-associated complications. HBZ up-regulates expression of the immunosuppressive cytokine IL-10. IL-10 promotes T cell proliferation only in the presence of HBZ. As a mechanism of growth promotion by IL-10, HBZ interacts with STAT1 and STAT3 and modulates the IL-10/JAK/STAT signaling pathway. These findings suggest that HTLV-1 promotes the proliferation of infected T cells by hijacking the machinery of regulatory T cell differentiation. IL-10 induced by HBZ likely suppresses the host immune response and concurrently promotes the proliferation of HTLV-1 infected T cells.
Keywords: HBZ; HTLV-1; IL-10; IL-6; JAK/STAT signaling pathway.
Copyright © 2020 the Author(s). Published by PNAS.
Conflict of interest statement
The authors declare no competing interest.
Figures
Similar articles
-
HTLV-1 bZIP factor induces inflammation through labile Foxp3 expression.PLoS Pathog. 2013 Sep;9(9):e1003630. doi: 10.1371/journal.ppat.1003630. Epub 2013 Sep 19. PLoS Pathog. 2013. PMID: 24068936 Free PMC article.
-
Interferon-γ Promotes Inflammation and Development of T-Cell Lymphoma in HTLV-1 bZIP Factor Transgenic Mice.PLoS Pathog. 2015 Aug 21;11(8):e1005120. doi: 10.1371/journal.ppat.1005120. eCollection 2015 Aug. PLoS Pathog. 2015. PMID: 26296091 Free PMC article.
-
HTLV-1 bZIP Factor Enhances T-Cell Proliferation by Impeding the Suppressive Signaling of Co-inhibitory Receptors.PLoS Pathog. 2017 Jan 3;13(1):e1006120. doi: 10.1371/journal.ppat.1006120. eCollection 2017 Jan. PLoS Pathog. 2017. PMID: 28046066 Free PMC article.
-
HTLV-1 bZIP factor: the key viral gene for pathogenesis.Retrovirology. 2020 Jan 8;17(1):2. doi: 10.1186/s12977-020-0511-0. Retrovirology. 2020. PMID: 31915026 Free PMC article. Review.
-
[HTLV-1 bZIP Factor (HBZ): Roles in HTLV-1 Oncogenesis].Bing Du Xue Bao. 2016 Mar;32(2):235-42. Bing Du Xue Bao. 2016. PMID: 27396170 Review. Chinese.
Cited by
-
Mechanisms of Innate Immune Sensing of HTLV-1 and Viral Immune Evasion.Pathogens. 2023 May 19;12(5):735. doi: 10.3390/pathogens12050735. Pathogens. 2023. PMID: 37242405 Free PMC article. Review.
-
Viral oncogenesis in cancer: from mechanisms to therapeutics.Signal Transduct Target Ther. 2025 May 12;10(1):151. doi: 10.1038/s41392-025-02197-9. Signal Transduct Target Ther. 2025. PMID: 40350456 Free PMC article. Review.
-
CARD11 mutation and HBZ expression induce lymphoproliferative disease and adult T-cell leukemia/lymphoma.Commun Biol. 2022 Nov 29;5(1):1309. doi: 10.1038/s42003-022-04284-x. Commun Biol. 2022. PMID: 36446869 Free PMC article.
-
Loss of interleukin-10 activates innate immunity to eradicate adult T-cell leukemia-initiating cells.Haematologica. 2021 May 1;106(5):1443-1456. doi: 10.3324/haematol.2020.264523. Haematologica. 2021. PMID: 33567810 Free PMC article.
-
HTLV-1 persistence and leukemogenesis: A game of hide-and-seek with the host immune system.Front Immunol. 2022 Oct 10;13:991928. doi: 10.3389/fimmu.2022.991928. eCollection 2022. Front Immunol. 2022. PMID: 36300109 Free PMC article. Review.
References
-
- Hanahan D., Weinberg R. A., Hallmarks of cancer: The next generation. Cell 144, 646–674 (2011). - PubMed
-
- Colotta F., Allavena P., Sica A., Garlanda C., Mantovani A., Cancer-related inflammation, the seventh hallmark of cancer: Links to genetic instability. Carcinogenesis 30, 1073–1081 (2009). - PubMed
Publication types
MeSH terms
Substances
LinkOut - more resources
Full Text Sources
Medical
Molecular Biology Databases
Research Materials
Miscellaneous
