Clinical Trial
. 2020 May 29;11(1):2673.
doi: 10.1038/s41467-020-16470-8.

The neuropeptide substance P regulates aldosterone secretion in human adrenals

Affiliations
Clinical Trial

The neuropeptide substance P regulates aldosterone secretion in human adrenals

Julien Wils et al. Nat Commun. .

Abstract

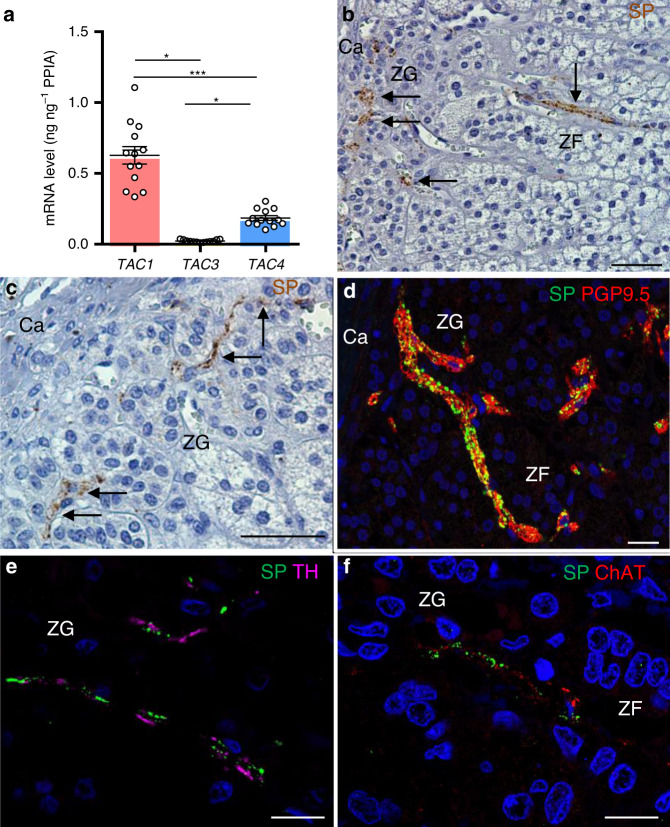
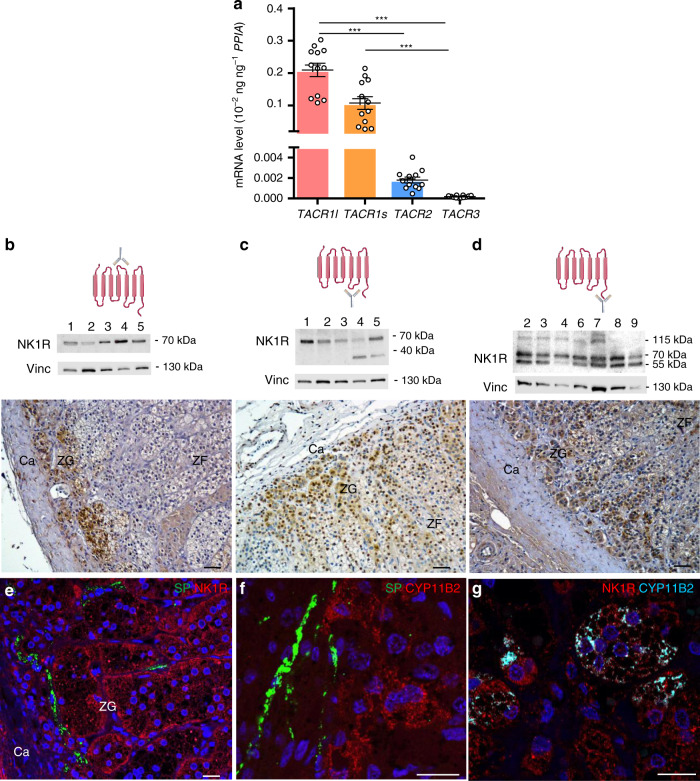
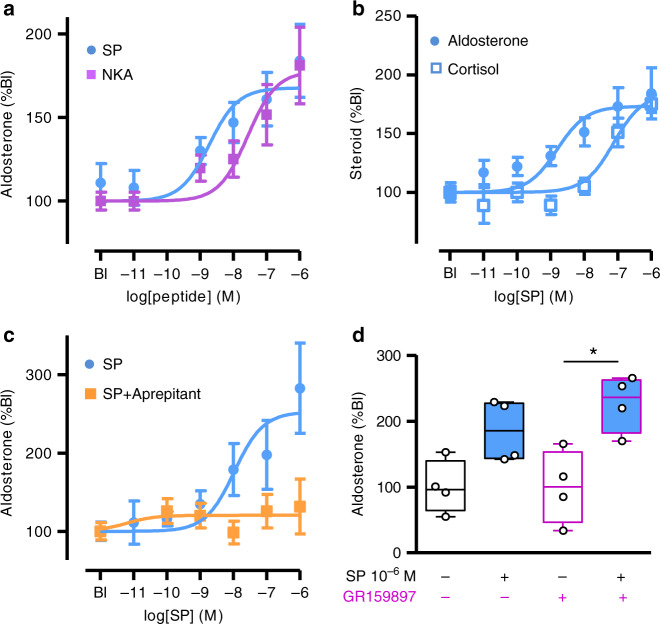
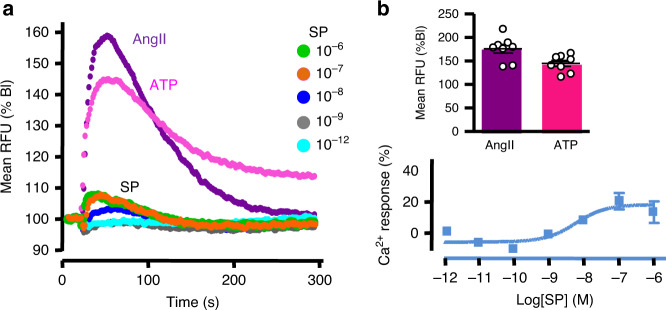
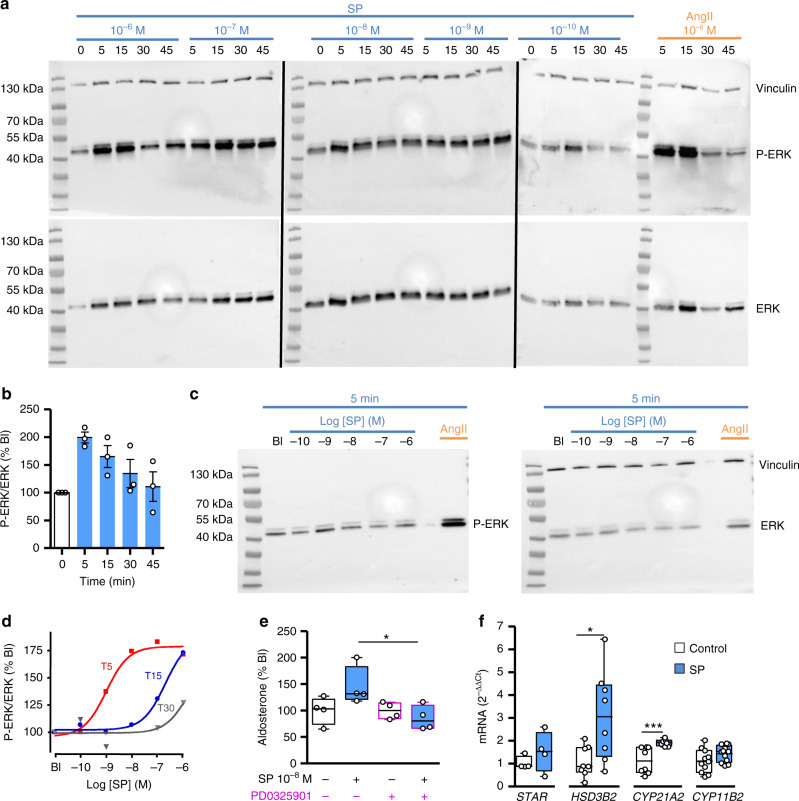
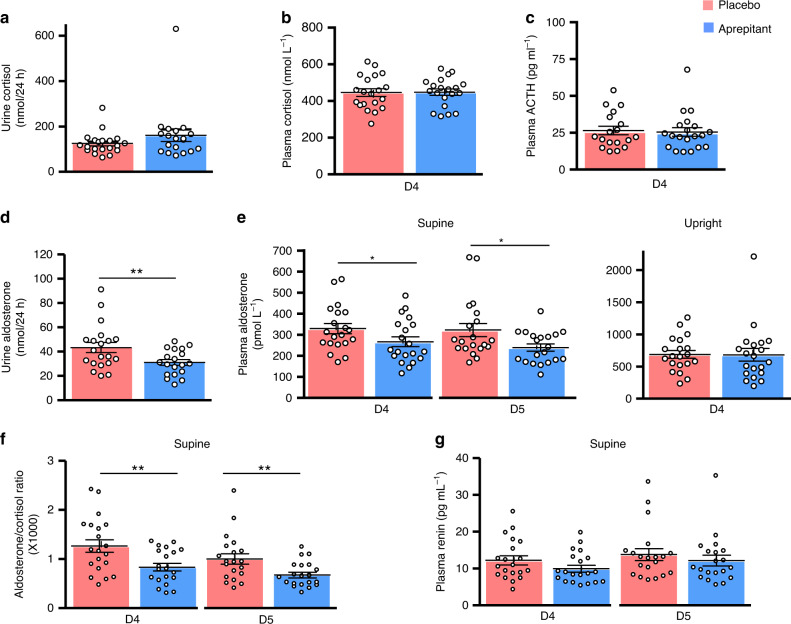
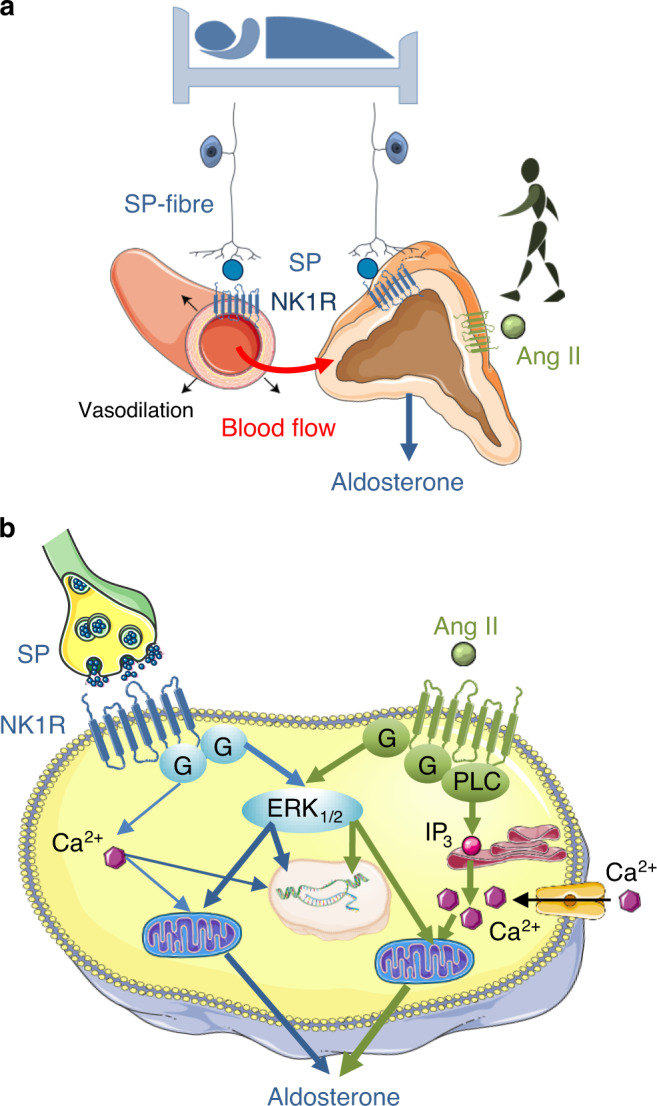
Aldosterone, produced by the adrenals and under the control of plasma angiotensin and potassium levels, regulates hydromineral homeostasis and blood pressure. Here we report that the neuropeptide substance P (SP) released by intraadrenal nerve fibres, stimulates aldosterone secretion via binding to neurokinin type 1 receptors (NK1R) expressed by aldosterone-producing adrenocortical cells. The action of SP is mediated by the extracellular signal-regulated kinase pathway and involves upregulation of steroidogenic enzymes. We also conducted a prospective proof-of-concept, double blind, placebo-controlled clinical trial aimed to investigate the impact of the NK1R antagonist aprepitant on aldosterone secretion in healthy male volunteers (EudraCT: 2008-003367-40, ClinicalTrial.gov: NCT00977223). Participants received during two 7-day treatment periods aprepitant (125 mg on the 1st day and 80 mg during the following days) or placebo in a random order at a 2-week interval. The primary endpoint was plasma aldosterone levels during posture test. Secondary endpoints included basal aldosterone alterations, plasma aldosterone variation during metoclopramide and hypoglycaemia tests, and basal and stimulated alterations of renin, cortisol and ACTH during the three different stimulatory tests. The safety of the treatment was assessed on the basis of serum transaminase measurements on days 4 and 7. All pre-specified endpoints were achieved. Aprepitant decreases aldosterone production by around 30% but does not influence the aldosterone response to upright posture. These results indicate that the autonomic nervous system exerts a direct stimulatory tone on mineralocorticoid synthesis through SP, and thus plays a role in the maintenance of hydromineral homeostasis. This regulatory mechanism may be involved in aldosterone excess syndromes.


Conflict of interest statement

H.L. received payment from MSD Laboratories for lecture unrelated to this study. J.W., C.D., A.-G.L., I.B., H.-G.B., C.D., S.C., F.G. and E.L declare no competing interests.

Figures

Fig. 1
Fig. 1. Expression of substance P (SP) in the human adrenal gland.
a Quantitative RT-QPCR analysis of TAC1, TAC3 and TAC4 mRNAs (n = 13 independent adrenals). Each dot indicates one adrenal. Data are presented as mean ± SEM. CI 95%: 0.49–0.76, 0.017–0.028, 0.15–0.22 for TAC1, TAC3 and TAC4, respectively. Statistical analysis was performed by Kruskal–Wallis test and Dunn’s post-test after one-way ANOVA. Significance denoted by *** p < 0.001, *p < 0.05. b, c Distribution of SP immunoreactivity in the adrenal cortex. Arrows designate nerve fibres. (Ca capsule, ZG zona glomerulosa, ZF zona fasciculata; scale bars= 50 µm; microphotographs representative of n = 18 independent adrenals). df Double immunofluorescence detection of SP and the nerve fibre marker PGP9.5 (d), tyrosine hydroxylase (TH; e), a marker of adrenergic nerve fibres, or choline acetyltransferase (ChAT; f), a marker of cholinergic nerve fibres. (scale bars = 20 µm; microphotographs representative of n = 4, 14 and 4 independent adrenals in df, respectively).
Fig. 2
Fig. 2. Expression of tachykinin receptors in the human adrenal gland.
a Quantitative RT-PCR analysis of TACR1l, TACR1s, TACR2 and TACR3 mRNAs (n = 12 independent adrenals). Each dot indicates one adrenal. Data are presented as mean ± SEM. CI 95%: 0.16–0.25, 0.06–0.15, 0.001–0.002 and 0.0001–0.0002 for TACR1l, TACR1s, TACR2 and TACR3, respectively. Statistical analysis was determined by Kruskal–Wallis test and Dunn’s post-test after one-way ANOVA. Significance denoted by ***p < 0.001. bd Presence of neurokinin type 1 receptor (NK1R) visualised by western blot and immunohistochemistry by using three antibodies recognising different epitopes (diagrams on the higher panels). Representative western blots showing bands of different molecular weights detected in adrenal extracts (middle panels; n = 5 adrenals in b and c; n = 7 adrenals in d). Vinculin (Vinc) was used as a loading control. Distribution of NK1R immunostaining in the cortex (lower panels; scale bars = 50 µm; Ca capsule, ZG zona glomerulosa, ZF zona fasciculata, microphotographs representative of n = 10, 7 and 10 adrenals in bd, respectively). Schemas created using medical diagrams available from https://smart.servier.com under a CC BY 3.0 licence (https://creativecommons.org/licenses/by/3.0/). eg Immunofluorescence detection of SP (e, f) and NK1R (e, g) or CYP11B2 (aldosterone synthase; f, g) in the ZG (scale bars = 20 µm; microphotographs representative of n = 4 adrenals).
Fig. 3
Fig. 3. Effect of tachykinins on steroidogenesis in cultured adrenocortical cells.
a Effects of SP (n = 23 independent cultures performed in quadruplicate) and neurokinin A (NKA; n = 5 independent cultures performed in quadruplicate) on aldosterone production. b Effect of SP on aldosterone and cortisol secretion (n = 5 independent cultures performed in quadruplicate). c Effect of SP on aldosterone secretion in the absence or presence of the NK1R antagonist aprepitant (10−9 M; n = 7 independent cultures performed in quadruplicate). Dose-response curves were analysed by two-way ANOVA. Aprepitant inhibited the aldosterone response (F = 10.14; DFn=1; DFd=72; p = 0.002). F distribution, DFn degrees of freedom for groups, DFd degrees of freedom for samples. Data are presented as mean ± SEM in panels ac. d Effect of the NK2R antagonist GR159897 (10−9 M) on the aldosterone response to SP (10−6 M). Data are presented as median ± interquartile range (IQR), minima and maxima (n = 4 cultures). They were analysed by two-tailed Mann–Whitney test. *p = 0.028. In all culture experiments, steroid secretion was normalised to basal level (Bl).
Fig. 4
Fig. 4. Effect of substance P on the calcium signalling pathway in cultured adrenocortical cells.
a Effect of SP (from 10−12 to 10−6 M), angiotensin II (Ang II; 10−6 M) and ATP (10−5 M) on cytosolic calcium concentrations in cell pools (RFU relative fluorescence unit). Data are normalised to basal level (Bl) and expressed as mean of three culture dishes (triplicate). Recordings are representative of n = 3 independent cultures. b Maximum amplitude of Ang II- and ATP-triggered calcium responses (upper panel). Data are presented as mean ± SEM of eight cultures dished examined over three independent experiments. CI 95% were 154–197 and 129–160 for Ang II and ATP, respectively. Lower panel: dose-response curve of SP-induced maximum calcium responses normalised to those of Ang II illustrated in panel a.
Fig. 5
Fig. 5. Coupling of tachykinin receptors to ERK signalling pathway in cultured adrenocortical cells.
a Representative western blots showing the kinetics of the phospho-ERK (upper panels) and ERK (lower panel) levels in response to SP (from 10−6 to 10−10 M) and Ang II (10−6 M) after incubation of cultured cells for 5, 15, 30 and 45 min (three blots processed in parallel showing samples derived from the same culture experiment). Immunolabellings for phospho-ERK and ERK were successively performed on the same membranes. Ang II and vinculin were used as positive and loading controls, respectively. b Time course of ERK phosphorylation normalised to ERK in response to SP (10−7 M). Data are normalised to basal level (0 min) of each repetitive experiment. Data are presented as mean ± SEM of three independent cultures. c Representative western blots showing the effect of increasing doses of SP administrated for 5 min on phospho-ERK (left panel) and ERK (right panel). d Dose-response curves of SP-induced ERK phosphorylation normalised to ERK for 5, 15 and 30 min of incubation (T5, T15 and T30), illustrated in c and Supplementary Fig. 4. Data are expressed as percentage basal level (Bl). e Effect of the ERK pathway inhibitor PD0325901 (10–8 M) on SP-induced aldosterone secretion. Data are expressed as median ± IQR, minima and maxima (n = 4 cultures). They were analysed by two-tailed Mann–Whitney test (p = 0.028 for SP versus SP + PD0325901). f Effect of SP (10−6M, 24 h) on the expression levels of genes encoding cholesterol transporter and steroidogenic enzymes. mRNA expression levels were normalised to PPIA. Data are expressed as median ± IQR, minima and maxima (n = 4, 8, 8 and 11 independent cultures for STAR, HSD3B2, CYP21A2 and CYP11B2, respectively). They were analysed by two-tailed Mann–Whitney test (p = 0.48 for STAR, p = 0.02 for HSD3B2, p = 0.0002 for CYP21A2 and p = 0.14 for CYP11B2. *p < 0.05; ***p < 0.001.
Fig. 6
Fig. 6. Effect of oral administration of the NK1R antagonist aprepitant versus placebo on corticosteroid concentrations in healthy volunteers.
ac Effect of placebo or aprepitant on 24-h urinary cortisol excretion (CI 95%: 102–147 versus 103–219; p = 0.18), basal (8:00 a.m.) plasma cortisol (CI 95%: 403–489 versus 411–485; p = 0.89) and ACTH levels (CI 95%: 20–32 versus 19–31; p = 0.43) at day 4 (D4; 4th day of treatment). d, e Effect of placebo or aprepitant on 24-h urine aldosterone (CI 95%: 34–52 versus 26–36; p = 0.0009), supine plasma aldosterone levels at day 4 (CI 95%: 278–380 versus 218–315; p = 0.04) and day 5 (D5; CI 95%: 256–388 versus 203–274: p = 0.02), and plasma aldosterone concentration in upright position at D4 (CI 95%: 562–814 versus 475–888; p = 0.48). f, g Effect of placebo or aprepitant on supine plasma aldosterone to cortisol ratio (CI 95%: 0.99–1.53 versus 0.67–0.99; p = 0.004 at D4 and CI 95%: 077–1.22 versus 0.55–0.79; p = 0.002 at D5) and plasma renin levels (CI 95%: 9.6–14.8 versus 8.0–11.9 at D4; p = 0.12 and CI 95%: 10.4–17.2 versus 9.1–15.2; p = 0.28 at D5). Each dot indicates one healthy volunteer (n = 20 healthy volunteers). Data are presented as mean ± SEM. Data were analysed by non-parametric Wilcoxon/mid rank matched pairs test. *P < 0.05, **P < 0.01.
Fig. 7
Fig. 7. Schematic representation of the putative action of substance P (SP) on aldosterone production by the human adrenal gland.
a SP may stimulate aldosterone secretion through both an indirect vascular effect leading to an increase in adrenal blood flow and a direct action on adrenocortical cells, the two mechanisms being mediated by the NK1 receptor (NK1R). The action of SP seems to be complementary to that of Ang II which is involved in the aldosterone response to upright posture while SP may mainly control basal aldosterone production. b At the cellular level, binding of SP to the NK1R expressed by zona glomerulosa cells induces an activation of the ERK pathway but has a minor effect on the calcium signalling pathway in contrast to angiotensin II (Ang II) which strongly activates the two transduction mechanisms. Schemas created using medical diagrams available from https://smart.servier.com under a CC BY 3.0 licence (https://creativecommons.org/licenses/by/3.0/).

References

    1. Hattangady NG, Olala LO, Bollag WB, Rainey WE. Acute and chronic regulation of aldosterone production. Mol. Cell. Endocrinol. 2012;350:151–162. - PMC - PubMed
    1. Staessen J, Lijnen P, Fagard R, Verschueren LJ, Amery A. Rise of plasma aldosterone during long-term captopril treatment. N. Engl. J. Med. 1981;304:1110. - PubMed
    1. Bomback AS, et al. Aldosterone breakthrough during aliskiren, valsartan, and combination (aliskiren + valsartan) therapy. J. Am. Soc. Hypertens. 2012;6:338–345. - PubMed
    1. Schjoedt KJ, Andersen S, Rossing P, Tarnow L, Parving H-H. Aldosterone escape during blockade of the renin-angiotensin-aldosterone system in diabetic nephropathy is associated with enhanced decline in glomerular filtration rate. Diabetologia. 2004;47:1936–1939. - PubMed
    1. Sato A, Saruta T. Aldosterone escape during angiotensin-converting enzyme inhibitor therapy in essential hypertensive patients with left ventricular hypertrophy. J. Int. Med. Res. 2001;29:13–21. - PubMed

Publication types

MeSH terms

Associated data