. 2020 May 29;10(1):8779.
doi: 10.1038/s41598-020-65636-3.

Signal profiling of the β1AR reveals coupling to novel signalling pathways and distinct phenotypic responses mediated by β1AR and β2AR

Affiliations

Signal profiling of the β1AR reveals coupling to novel signalling pathways and distinct phenotypic responses mediated by β1AR and β2AR

Viktoriya Lukasheva et al. Sci Rep. .

Abstract

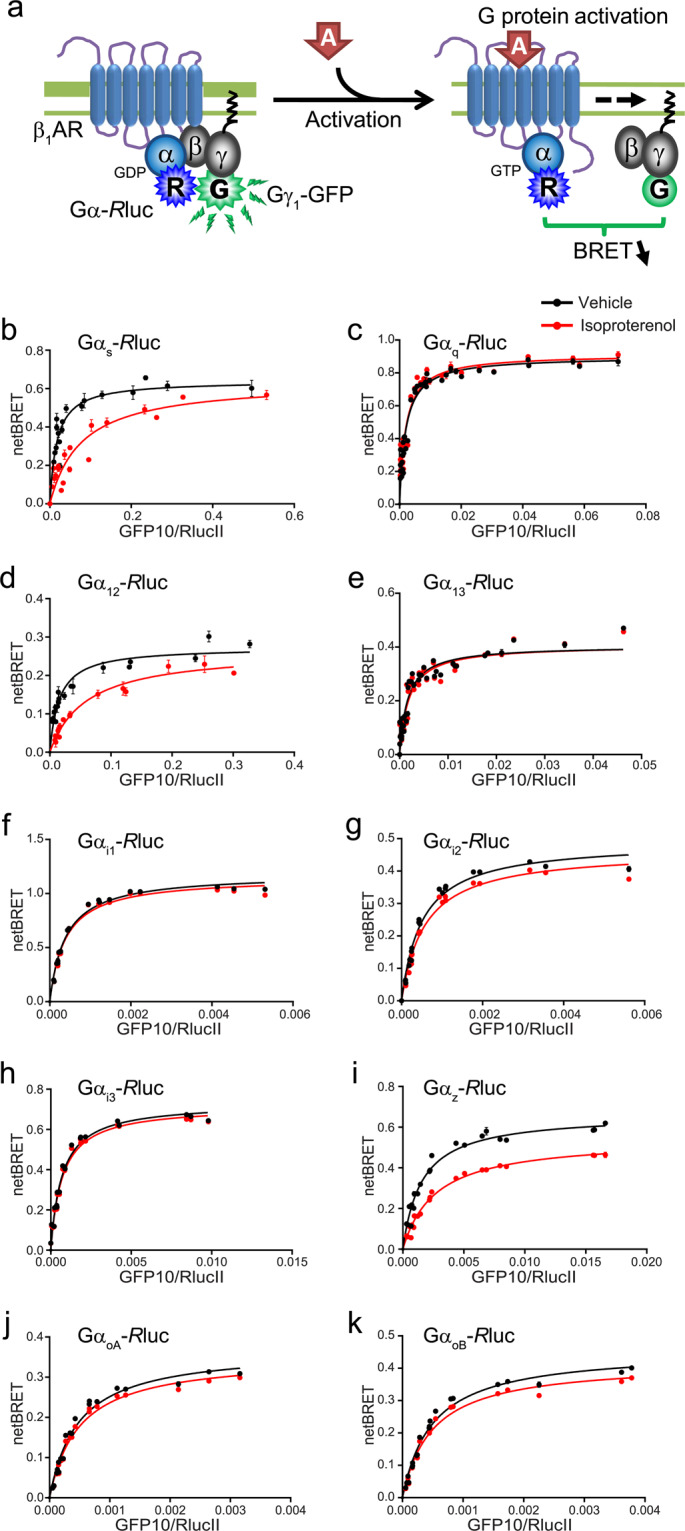
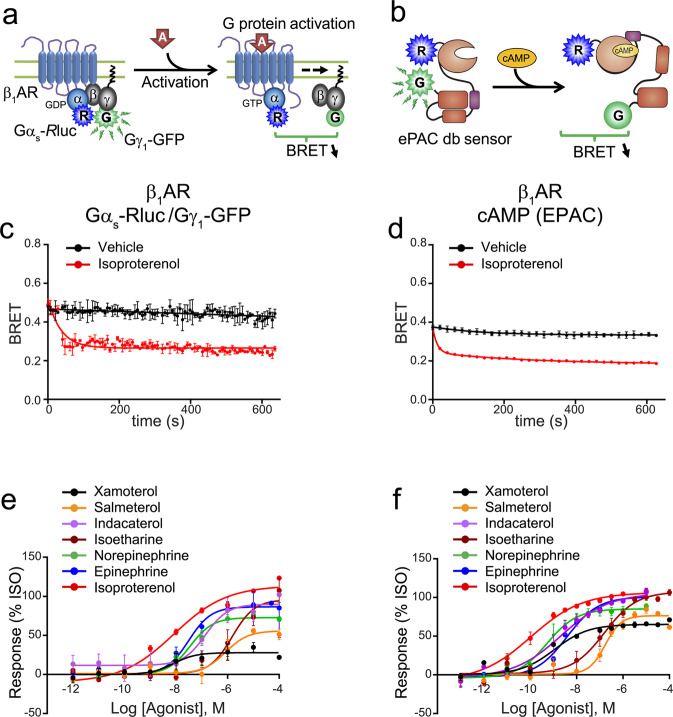
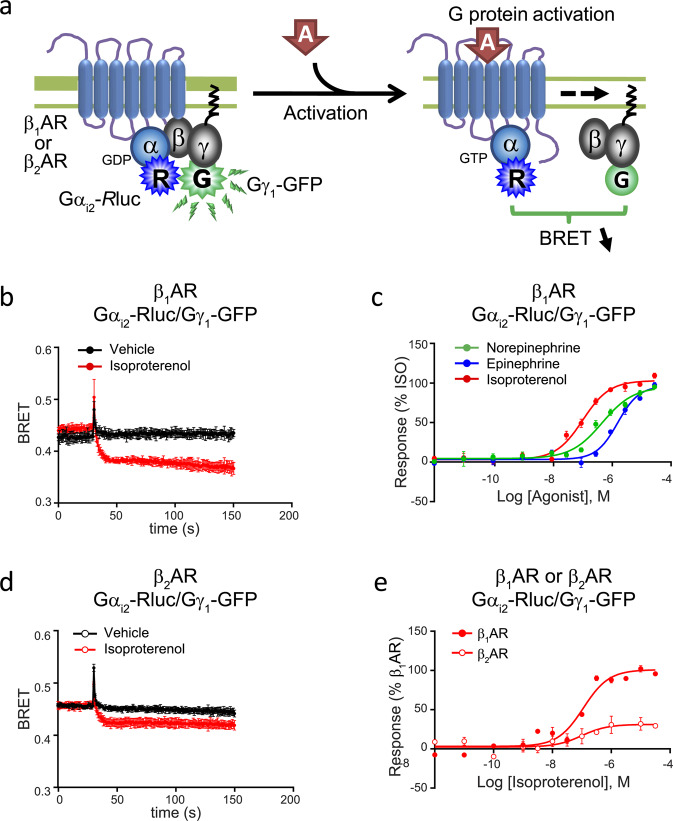
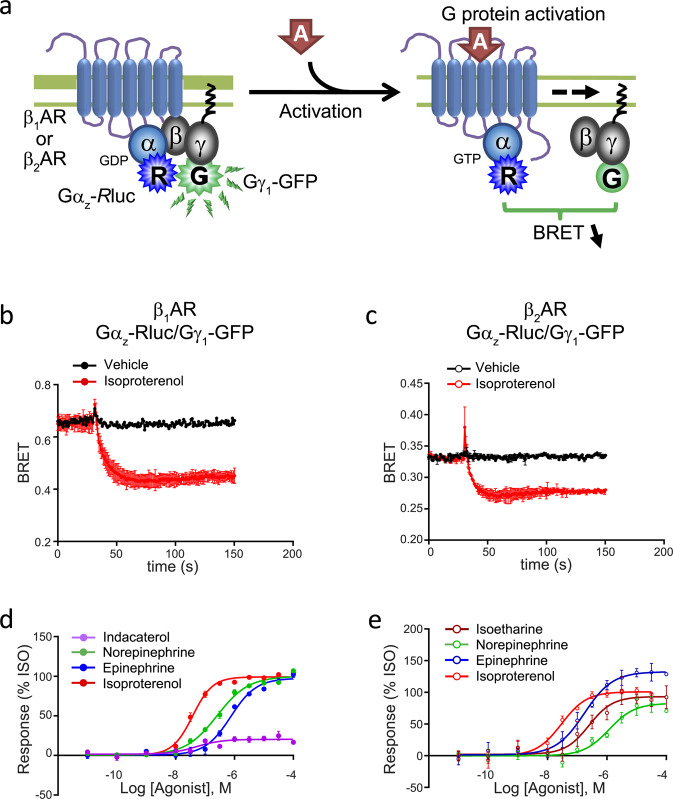
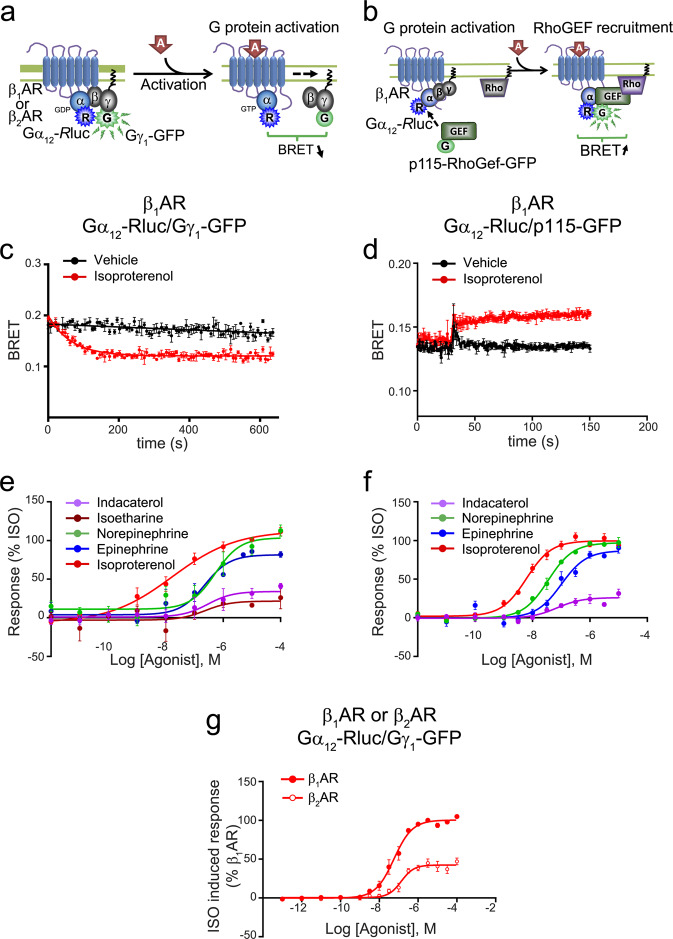
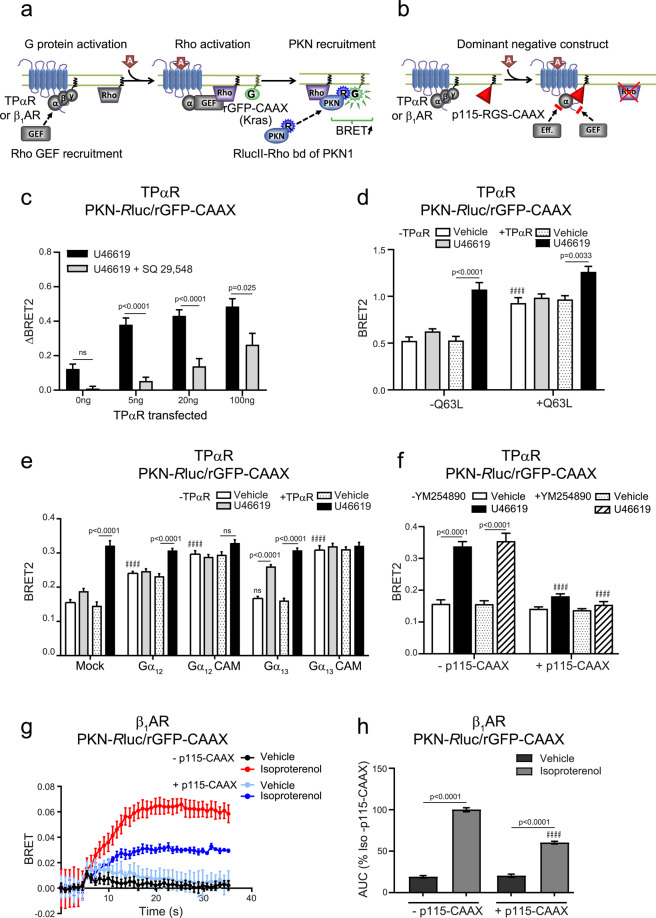
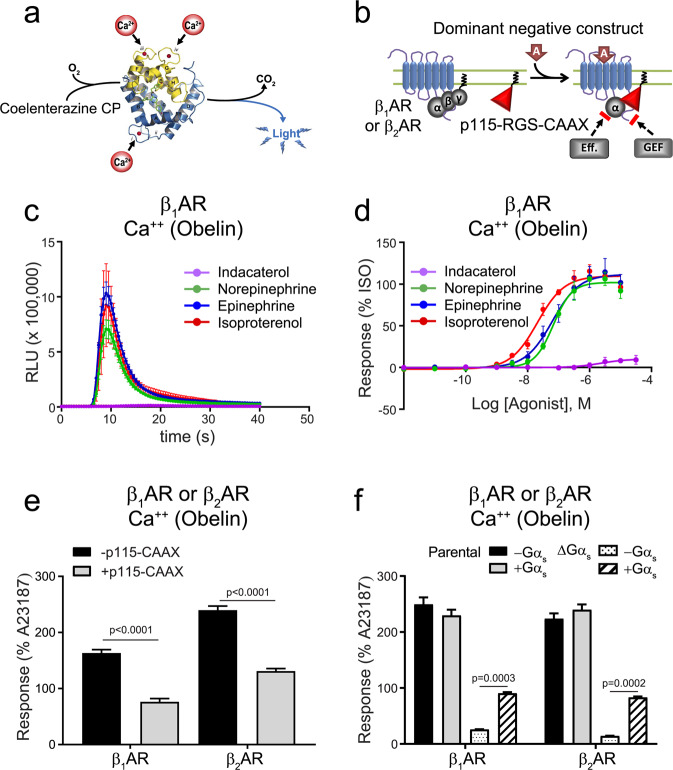
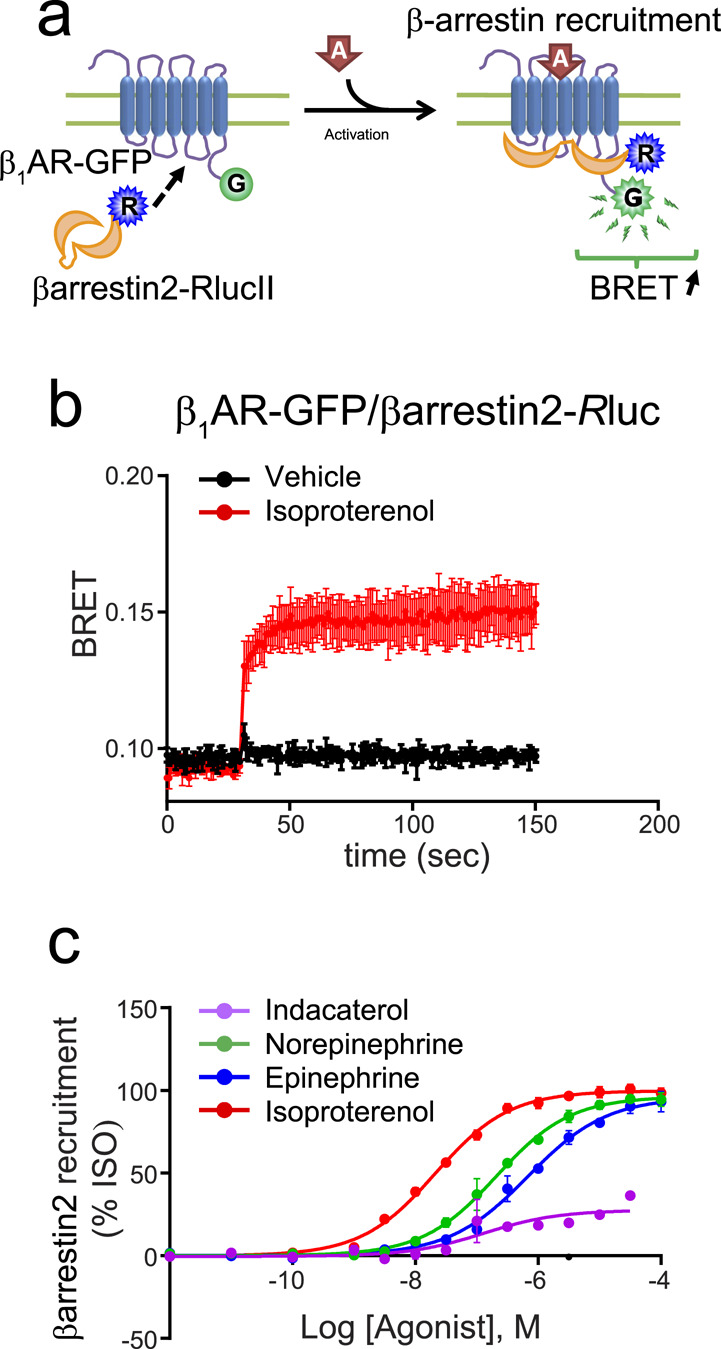
A comprehensive understanding of signalling downstream of GPCRs requires a broad approach to capture novel signalling modalities in addition to established pathways. Here, using an array of sixteen validated BRET-based biosensors, we analyzed the ability of seven different β-adrenergic ligands to engage five distinct signalling pathways downstream of the β1-adrenergic receptor (β1AR). In addition to generating signalling signatures and capturing functional selectivity for the different ligands toward these pathways, we also revealed coupling to signalling pathways that have not previously been ascribed to the βAR. These include coupling to Gz and G12 pathways. The signalling cascade linking the β1AR to calcium mobilization was also characterized using a combination of BRET-based biosensors and CRISPR-engineered HEK 293 cells lacking the Gαs subunit or with pharmacological or genetically engineered pathway inhibitors. We show that both Gs and G12 are required for the full calcium response. Our work highlights the power of combining signal profiling with genome editing approaches to capture the full complement of GPCR signalling activities in a given cell type and to probe their underlying mechanisms.


Conflict of interest statement

The authors declare no competing interests.

Figures

Figure 1
Figure 1
Identification of the Gα protein involved in β1AR signalling. (a) Schematic representation of the Gα-Rluc/Gγ-GFP biosensor used to identify the Gα proteins involved in β1AR signalling. (b–k) HA-β1AR HEK 293 stable cell lines were transfected with a constant amount of Gα-Rluc (BRET donor) and untagged Gβ1, along with increasing amounts of Gγ1-GFP construct (BRET acceptor). Cells were stimulated (red curves) or not (black curves) with 1 μM isoproterenol and BRET values collected. NetBRET values were calculated by subtracting the background BRET signal detected in cells expressing the Rluc-fused constructs alone (donor-Rluc) from the BRET values obtained in cells expressing the energy donor and acceptor (donor-Rluc and acceptor-GFP). BRET titration curves were generated for 10 different Gα subunits: Gαs (b), Gαq (c), Gα12 (d), Gα13 (e), Gαi1 (f), Gαi2 (g), Gαi3 (h), Gαz (i), GαoA (j) and GαoB (k). Values represent mean ± SEM of 3 independent experiments performed in triplicate. Responses for Gαs, Gαi2, Gαz and Gα12 were further analyzed in subsequent sections.
Figure 2
Figure 2
s activation and cAMP production induced by the β1AR. (a) Schematic representation of the Gαs-Rluc/Gγ1-GFP biosensor used to study the Gαs induced β1AR signalling. (b) Schematic representation of the cAMP biosensor used to study the cAMP increase induced by the β1AR Gαs activation. HEK 293 cells were transfected with (c,e) Gαs-Rluc, Gγ1-GFP and untagged Gβ1 or with the (d,f) EPAC biosensor, along with the β1AR. Kinetic curves represent time course of (c) Gαs activation (vehicle and isoproterenol, n=3) or (d) cAMP accumulation (vehicle and isoproterenol, n=3) expressed as absolute BRET ratio. Concentration-responses curves were generated for (e) Gαs activation and (f) cAMP accumulation following β1AR activation by the indicated ligands. Data were normalized to maximal isoproterenol response, which was taken as 100%, and are expressed as mean ± SEM values. Detail of the number of experiments, maximal responses, pEC50 values and statistical comparisons of curve parameters for different ligands are provided in Supplementary Tables S1 and S2.
Figure 3
Figure 3
i2-induced activation by the β1AR and β2AR. (a) Schematic representation of the Gαi2-Rluc/Gγ1-GFP biosensor used to study the Gαi induced β1AR and β2AR signalling. HEK 293 cells were transfected with (b-e) Gαi2-Rluc, Gγ1-GFP and untagged Gβ1, along with (b-c,e) β1AR or (d-e) β2AR. (b,d) Kinetics curves represent time course of Gαi2 activation by (b) β1AR (vehicle and isoproterenol, n=3) or (d) β2AR (vehicle and isoproterenol, n=3) expressed as absolute BRET ratios. (c) Concentration-responses curves for Gαi2 activation following β1AR activation by indicated ligands. (e) Concentration-responses curves for Gαi2 activation following isoproterenol-induced activation of β1AR or β2AR (n=2). Data were normalized to maximal isoproterenol response, which was take as 100%, and are expressed as mean ± SEM values. Detail (c) of the number of experiments, maximal responses, pEC50 values and statistical comparisons of curve parameters for different ligands are provided in Supplementary Tables S1 and S2.
Figure 4
Figure 4
z-induced activation by the β1AR and β2AR. (a) Schematic representation of the Gαz-Rluc/Gγ1-GFP biosensor used to study the Gαz induced βAR signalling. HEK 293 cells were transfected with Gαz-Rluc, Gγ1-GFP and untagged Gβ1, along with (b,d) β1AR or (c,e) β2AR. Kinetic curves represent time course of Gαz activation by (b) β1AR (vehicle n = 1; isoproterenol n = 2) or (c) β2AR (vehicle and isoproterenol, n = 2) expressed as absolute BRET ratios. Concentration-responses curves for Gαz activation following (d) β1AR or (e) β2AR activation by indicated ligands. Data were normalized to maximal isoproterenol response, which was take as 100%, and are expressed as mean ± SEM values. Details of the number of experiments, maximal responses, pEC50 values and statistical comparisons of curve parameters for (d) β1AR activation by different ligands are provided in Supplementary Tables S1 and S2. For (e) β2AR activation, n = 3 for all ligands.
Figure 5
Figure 5
12-induced activation by the β1AR. (a) Schematic representation of the Gα12-Rluc/Gγ1-GFP biosensor used to study the Gα12 induced βAR signalling. (b) Schematic representation of the Gα12-Rluc/p115-RhoGef-GFP (p115-GFP) biosensor used to study the Gα12 induced βAR signalling. HEK 293 cells were transfected with (c,e,g) Gα12-Rluc, Gγ1-GFP and untagged Gβ1 or with (d,f) Gα12-Rluc, p115-GFP and untagged Gγ1 and Gβ1, along with β1AR or (g) β2AR. Kinetic curves represent time course of (c) Gα12 activation (vehicle and isoproterenol n = 3) or (d) Gα12-p115 biosensor activation (vehicle n = 2, isoproterenol n = 3), expressed as absolute BRET ratio. Concentration-responses curves for (e) Gα12 activation or (f) Gα12-p115 biosensor activation following β1AR activation by indicated ligands. (g) Concentration-responses curves for Gα12 activation following isoproterenol-induced β1AR or β2AR stimulation (n = 6). Data were normalized to maximal isoproterenol response (100%), and are expressed as mean ± SEM values. Detail (e,f) of the number of experiments, maximal responses, pEC50 values and statistical comparisons of curve parameters for (e,f) β1AR activation by different ligands are provided in Supplementary Tables S1 and S2.
Figure 6
Figure 6
PKN-recruitment based biosensor to monitor receptor-induced activation of Rho signalling for TPαR and β1AR. (a) Schematic representation of the PKN-recruitment based biosensor. (b) Schematic representation of the mode of action of p115-RGS-CAAX construct (P115-CAAX) as a dominant negative construct for G protein signalling. HEK 293 cells were transfected with PKN-RlucII and rGFP-CAAX along with either (c–f) HA-TPαR or (g,h) β1AR, in the presence or absence of (d) constitutively active RhoA mutant (Q63L), (e) Gα12, Gα13 or their constitutively active (CAM) versions (Gα12CA Q231L and Gα13CA Q226L) or (f-h) p115-CAAX. (c) Treatment with the TP antagonist SQ 29,548 inhibits PKN recruitment following TPαR activation by U46619. 0 ng represents the activity of endogenously expressed receptor. Data are expressed as ΔBRET signal and are the mean ± SEM (n = 3). Statistical comparisons for antagonistic effect were done using two-way ANOVA followed by post-hoc comparison with Sidak’s test. (d,e) PKN recruitment to the plasma membrane upon U46619-induced TPαR activation in the presence or absence of (d) constitutively active RhoA mutant (Q63L) or (e) Gα12, Gα13 or their CAM versions. Data are expressed as BRET signal and are mean ± SEM ((d) n = 6, (e) n = 3). Statistical comparisons were done using two-way ANOVA followed by post-hoc comparison with Tukey’s test. #### p < 0.0001 compared to (d) Q63L or (e) TPαR Vehicle Mock. (f) Inhibition of PKN recruitment upon U46619-induced TPαR activation in the presence of the dominant negative p115-CAAX construct or the Gq inhibitor YM-254890. Data expression and statistical comparisons were done as in (d,e). n = 4, #### p < 0.0001 compared to -p115-CAAX. (g) Kinetics of PKN recruitment upon isoproterenol-induced β1AR activation in the presence of the dominant negative p115-CAAX (representative of n = 3). (h) β1AR-mediated PKN recruitment in the presence of p115-CAAX. Data are expressed as the area under the curve (AUC), calculated from 30 sec kinetics of 1 µM isoproterenol stimulation, and are the mean ± SEM (n = 4). #### p < 0.0001 compared to -p115-CAAX. ns: non-significant.
Figure 7
Figure 7
Calcium response promoted by β1AR or β2AR activation. (a) Schematic representation of the luminescence Obelin biosensor used to detect calcium. (b) Schematic representation of the mode of action of p115-RGS-CAAX (p115-CAAX) construct as a dominant negative construct for the inhibition of G12/13 signalling. HEK 293 cells stably expressing HA-β1AR were transfected with Obelin. (c) Kinetics of calcium response by indicated ligands (representative, isoproterenol, n = 10, other ligands n = 3) and expressed as relative luminescence units. (d) Concentration-responses curves for Ca2+ mobilization following β1AR activation by indicated ligands. Data were normalized to maximal isoproterenol response (100%), and expressed as mean ± SEM values. Detail of the number of experiments, maximal responses, pEC50 values and statistical comparisons of curve parameters for different ligands are provided in Supplementary Tables S1 and S2. (e) HEK 293 cells were transiently transfected with β1AR or β2AR along with the obelin biosensor, with or without the p115-CAAX inhibitor. Data were normalized to maximal A23187 response (100%), determined from the area under the curve (AUC), and are expressed as the mean ± SEM values (n = 3). Statistical comparisons were done using two-way ANOVA followed by post-hoc comparison with Tukey’s test. (f) Parental HEK 293 or ΔGαs cells were transfected with β1AR or β2AR, along with obelin, with or without Gαs. Data normalization and statistical analysis were done as described in (e) (n = 3).
Figure 8
Figure 8
β-arrestin2 recruitment by β1AR. (a) Schematic representation of the βarr2 biosensor. HEK 293 cells were transfected with β1AR-GFP along with β-arrestin2-Rluc. (b) Kinetic curves represent time course of β-arrestin2 recruitment (vehicle and isoproterenol n = 3) expressed as absolute BRET ratio. (c) Concentration-responses curves for β-arrestin2 recruitment following β1AR activation by indicated ligands. Data were normalized to maximal isoproterenol response, which was taken as 100%, and are expressed as mean ± SEM values. Detail of the number of experiments, maximal responses, pEC50 values and statistical comparisons of curve parameters for different ligands are provided in Supplementary Tables S1 and S2.

References

    1. Kenakin T. Signaling bias in drug discovery. Expert Opin Drug Discov. 2017;12:321–333. - PubMed
    1. Kenakin T, Christopoulos A. Signalling bias in new drug discovery: detection, quantification and therapeutic impact. Nat Rev Drug Discov. 2013;12:205–16. - PubMed
    1. Kenakin T, Christopoulos A. Measurements of ligand bias and functional affinity. Nat Rev Drug Discov. 2013;12:483. - PubMed
    1. Smith JS, Lefkowitz RJ, Rajagopal S. Biased signalling: from simple switches to allosteric microprocessors. Nat Rev Drug Discov. 2018;17:243–260. - PMC - PubMed
    1. Stallaert W, Dorn JF, van der Westhuizen E, Audet M, Bouvier M. Impedance responses reveal β(2)-adrenergic receptor signaling pluridimensionality and allow classification of ligands with distinct signaling profiles. PLoS One. 2012;7:e29420. - PMC - PubMed

Publication types

MeSH terms

Substances