. 2020 May 29;9(5):55.
doi: 10.1038/s41389-020-0243-y.

Ovarian BDNF promotes survival, migration, and attachment of tumor precursors originated from p53 mutant fallopian tube epithelial cells

Affiliations

Ovarian BDNF promotes survival, migration, and attachment of tumor precursors originated from p53 mutant fallopian tube epithelial cells

Min Kang et al. Oncogenesis. .

Abstract

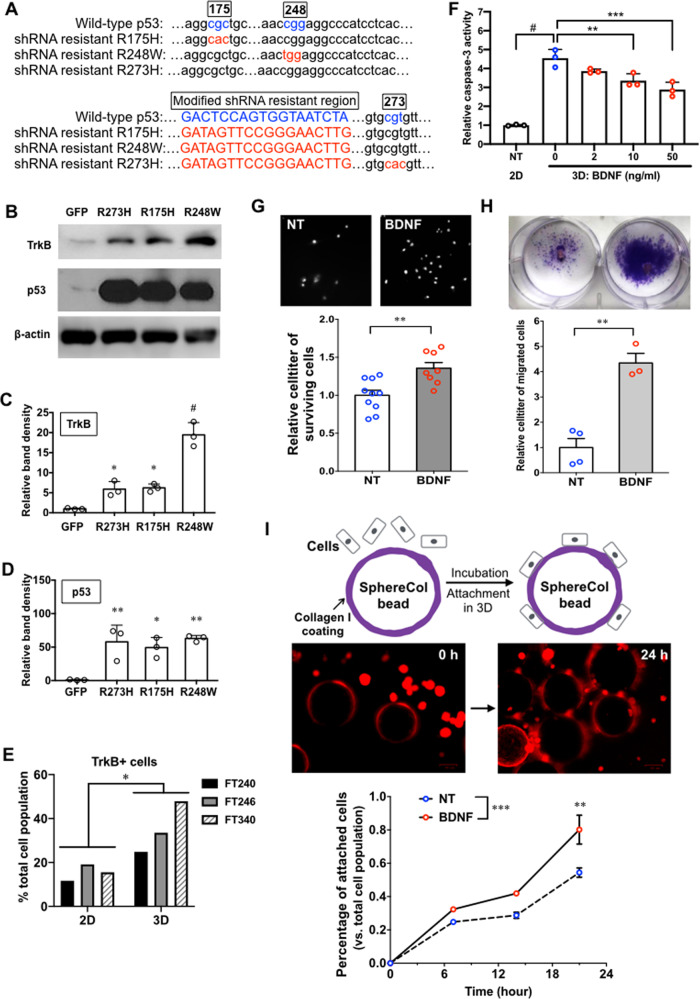
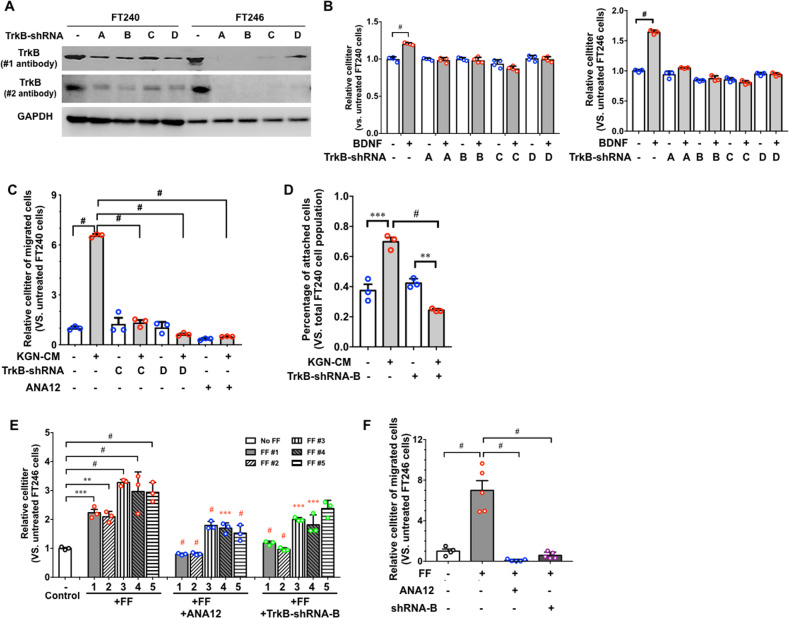
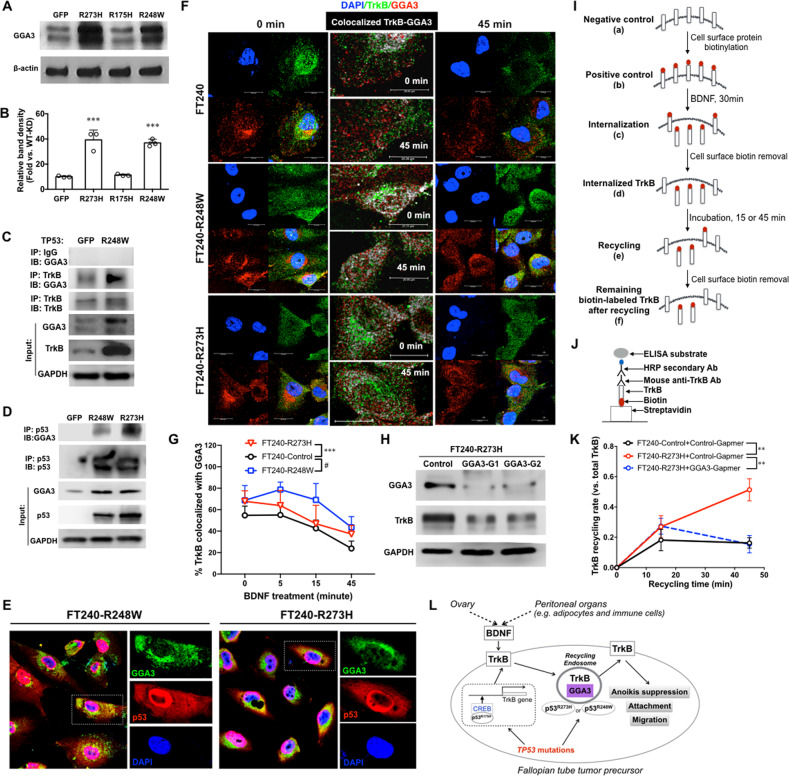
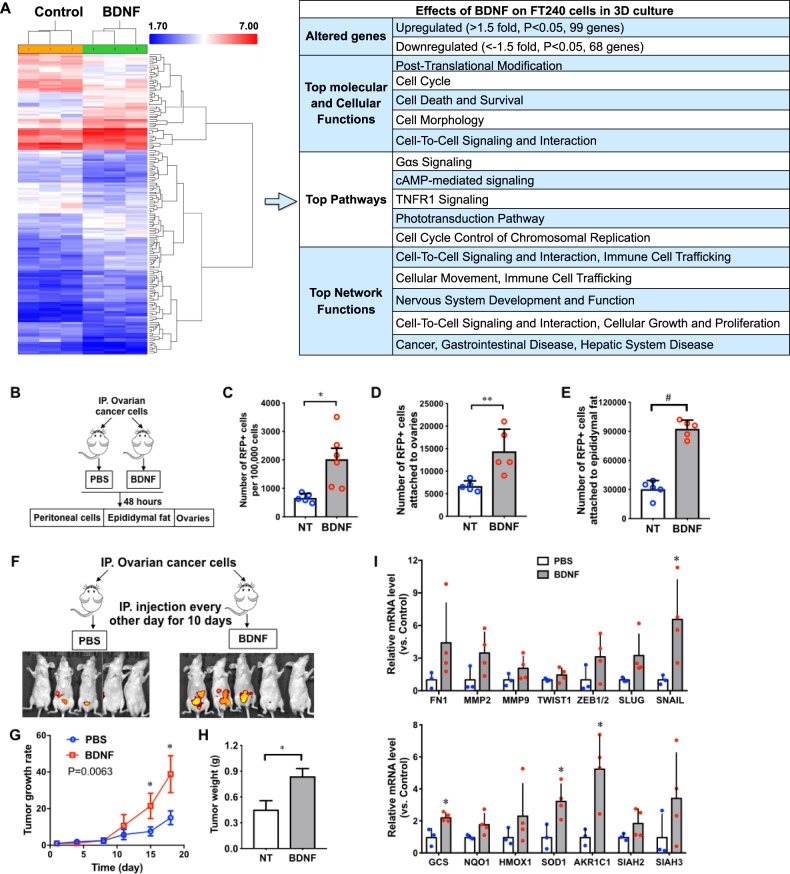
High-grade serous ovarian carcinoma (HGSOC) is the most lethal gynecological malignancy. New evidence supports a hypothesis that HGSOC can originate from fallopian tube epithelium (FTE). It is unclear how genetic alterations and pathophysiological processes drive the progression of FTE tumor precursors into widespread HGSOCs. In this study, we uncovered that brain-derived neurotrophic factor (BDNF) in the follicular fluid stimulates the tropomyosin receptor kinase B (TrkB)-expressing FTE cells to promote their survival, migration, and attachment. Using in vitro and in vivo models, we further identified that the acquisition of common TP53 gain-of-function (GOF) mutations in FTE cells led to enhanced BDNF/TrkB signaling compared to that of FTE cells with TP53 loss-of-function (LOF) mutations. Different mutant p53 proteins can either increase TrkB transcription or enhance TrkB endocytic recycling. Our findings have demonstrated possible interplays between genetic alterations in FTE tumor precursors (i.e., p53 GOF mutations) and pathophysiological processes (i.e., the release of follicular fluid upon ovulation) during the initiation of HGSOC from the fallopian tube. Our data revealed molecular events underlying the link between HGSOC tumorigenesis and ovulation, a physiological process that has been associated with risk factors of HGSOC.


Conflict of interest statement

The authors declare that they have no conflict of interest.

Figures

Fig. 1
Fig. 1. BDNF promotes the survival, migration and attachment of fallopian tube epithelial cells (FTEs).
a Partial sequences of wild-type p53 and shRNA-resistant p53 mutants. The graph was based on the plasmid DNA sequencing result. b Representative images of western blot. The whole-cell lysate of FT240 cells overexpressing green fluorescent protein (GFP), p53R273H, p53R175H, or p53R248W were analyzed. c, d Band density quantification of p53 and TrkB western blot. Band density was normalized to the data of β-actin control and compared to the control FT240 expressing GFP. n = 3. *p < 0.05, **p < 0.005, and #p < 0.0001 for one-way ANOVA followed by Tukey’s HSD test. e Flow cytometry of TrkB in human fallopian tube cell lines FT240, FT246, and FT340. 2D and 3D indicate the regular 2D adhesion culture and cell suspension 3D culture, respectively. *p < 0.05 for paired Student’s t test. f BDNF suppressed Caspase3/7 activity of FT240 cells in 3D culture. Data were normalized to Caspase3/7 activity of untreated cells in 2D culture (NT 2D). n = 3. **p < 0.005, ***p < 0.0005, and #p < 0.0001 for one-way ANOVA followed by Tukey’s HSD test. g BDNF (50 ng/ml) promoted the recovery of FT240 cells (FTEs) from anoikis-inducing condition. Cell viability was quantified after FTEs reattached to collagen I-coated matrix for 48 h. DAPI staining was used to visualize the nuclei (as white dots) of the recovered cells in the representative images. Cell viability was determined using CellTiter-Glo 2D Cell Viability Assay. n = 8. **p < 0.005 for unpaired Student’s t test. h BDNF (50 ng/ml) accelerated the migration of FTEs from hydrogel. Migrated cells were visualized by crystal violet staining. After hydrogel pieces were removed, the migrated cells were quantified with CellTiter-Glo 2D Cell Viability Assay. n = 3. **p < 0.005 for unpaired Student’s t test. i BDNF (50 ng/ml) enhanced the attachment of FTEs to Collagen I-coated beads. Representative images indicate the attachment of red fluorescent FT240 to beads after 24-h incubation as expected. The percentage of attached cells is incubation-time-dependent. BDNF treatment accelerated the attachment. **p < 0.005 and ***p < 0.0005 for two-way ANOVA followed by Sidak HSD test.
Fig. 2
Fig. 2. Ovary-secreted factors promote the survival, migration and attachment of FTEs through BDNF/TrkB pathway.
a Western blot images of TrkB in two FTE cells lines, FT240 and FT246, indicate the knockdown of TrkB by shRNA-A, B, C, and D. Two antibodies (#1 and #2) were used to validate the knockdown. b TrkB-shRNAs inhibited the BDNF-enhanced cell viability of FT246 cells in 3D culture. FT246 expressing nontarget shRNA was used as negative control. n = 3. #p < 0.0001 for two-way ANOVA followed by Sidak HSD test. c Granulosa cell line KGN conditional medium (CM) induced the migration of FT240 cells. TrkB-shRNAs-C and D, and a TrkB antagonist, ANA-12, inhibited the KGN-CM-induced migration. n = 3. #p < 0.0001 for one-way ANOVA followed by Tukey’s HSD test. d KGN CM enhanced the attachment of FT240 to ECM in 3D model. TrkB-shRNA-B inhibited the KGN CM-induced attachment. n = 3. **p < 0.001, ***p < 0.0005, and #p < 0.0001 for two-way ANOVA followed by Sidak HSD test. e Human follicular fluid (FF) increased the cell viability of FT246. ANA-12 and TrkB-shRNA-B inhibited the FF-induced increase of cell viability. Each number (1−5) indicates an FF sample from an individual woman. FT246 expressing nontarget shRNA was cultured in Opti-MEM-reduced serum medium as negative control. n = 3. **p < 0.001, ***p < 0.0005, and #p < 0.0001 for one-way ANOVA followed by Tukey’s HSD test. In the ANA12- and shRNA-B-treated groups, ***p < 0.0005 and #p < 0.0001 in red color indicate the comparisons to the matched sample treated with the FF from the same woman. f Five individual FF samples induced the migration of FT246 cells. ANA-12 and TrkB-shRNAs-B inhibited the FF-induced migration. n = 5. #p < 0.0001 for one-way ANOVA followed by Tukey’s HSD test.
Fig. 3
Fig. 3. p53 mutations enhance BDNF/TrkB signaling in fallopian tube tumor precursors.
a Mutant p53 enhanced the survival of FT240 cells stimulated by 50 ng/ml BDNF in 3D culture for 48 h. n = 6. b Mutant p53 increased the migration of FT240 cells from hydrogel stimulated by 50 ng/ml BDNF. n = 4. c Mutant p53 promoted the BDNF-stimulated (50 ng/ml) attachment of FT240 cells to Collagen I-coated beads. n = 3. ac *p < 0.05, **p < 0.005, ***p < 0.0005, and #p < 0.0001 for two-way ANOVA followed by Sidak HSD test. d Mutant p53-R175H, but not R248W or R273H, induced TrkB mRNA expression of FT240 cells. GAPDH was used as internal control. n = 3. #p < 0.0001 for one-way ANOVA followed by Tukey’s HSD test. e The binding of CREB to NTRK2 DNA was increased in p53-R175H-expressing FT240 cells than control cells as assessed by chromatin-IP of CREB followed by QPCR. n = 3. (See Supplementary Fig. S11 for the data of each biological repeat before normalization.) #p < 0.0001, paired Student’s t test. f The overexpression of p53-R248W in FT240 cells led to enhanced activation of TrkB, AKT, and ERK by BDNF (50 ng/ml) treatment. Relative band density of phosphorylated TrkB normalized to Tubulin (p-TrkB/Tubulin), phosphorylated AKT normalized to total AKT (p-AKT/AKT), and phosphorylated ERK normalized to total ERK (p-ERK/ERK) were quantified and normalized to the relative expression level of FT240-R248W cells at 0 min. n = 3. p values were calculated using two-way ANOVA followed by Sidak HSD test.
Fig. 4
Fig. 4. Mutant p53 promotes GGA3-regulated TrkB recycling in FTE cells.
a Representative images of GGA3 western blot show upregulation of GGA3 in FT240 cells expressing p53-R273H and R248W, but not p53-R175H. The same membrane as in Fig. 1a was re-blotted for GGA3 and β-actin loading control. b The density of GGA3 bands of FTE240 cells expressing GFP or mutant p53 was quantified. n = 3. ***p < 0.0005 for one-way ANOVA followed by Tukey’s HSD test. c Coimmunoprecipitation (co-IP) of TrkB and GGA3 in FT240 cells expressing GFP or mutant p53-R248W. d Co-IP of GGA3 and mutant p53-R248W or R273H in FT240 cells expressing GFP, mutant p53-R248W, or p53-R273H. e IF staining of mutant p53 (red) and GGA3 (green) in FT240 cells expressing mutant p53-R248W or p53-R273H. DAPI (blue) was used to stain nuclear DNA. f IF staining of TrkB (green) and GGA3 (red). DAPI was used to stain nuclear DNA. The colocalized TrkB and GGA3 signals were labeled as white in the middle panel. Cells were treated with 50 ng/ml BDNF for 0–45 min. g TrkB-GGA3 colocalization was quantified by analyzing about 20 cells in 5–6 images at each time point using ImageJ software. Mutant p53 is associated with higher levels of TrkB-GGA3 colocalization in FTE cells. ***p < 0.0005 and #p < 0.0001 for two-way ANOVA followed by Sidak HSD test. h Western blot images validated the knockdown of GGA3 by two GapmeRs (GGA3-G1 and G2). GGA3-G1 and G2 decreased the level of TrkB protein compared to the negative control GapmeR. i Schematic flow chart of TrkB recycling assay using biotin-labeling. The red dots indicate biotin. Surface proteins of FTE cells were biotinylated with membrane impermeable sulfo-NHS-LC-LC-Biotin (a, b). BDNF treatment for 30 min induced the internalization of biotin-labeled TrkB (b, c). Cell surface biotin was removed with biotin-removal buffer on ice (c, d) followed by a rewarming step at 37 °C to allow TrkB to recycle to cell surface (d, e). A second round of biotin-removal was performed (e, f). j Schematic diagram of biotin-labeled TrkB ELISA (enzyme-linked immunosorbent assay). The biotin-labeled TrkB protein was captured by a streptavidin-coated 96-well plate and quantified with TrkB ELISA. k TrkB recycling rate was higher in FT240 cells expressing p53-R273H than the control FT240 cells. Knockdown of GGA3 by the mix of two Gapmers suppressed the recycling of TrkB. n = 3. **p < 0.005 for two-way ANOVA followed by Sidak HSD test. l Schematic model of BDNF/TrkB activation in fallopian tube tumor precursors that express mutant p53.
Fig. 5
Fig. 5. BDNF enhances the survival of FTE cells in vivo.
a Schematic flow chart of mice injected with red fluorescent protein positive (RFP+) FT240 cells or p53-R248W-expressing FT240. FT240 cells, BDNF (0.2 ng/mouse), ANA-12 (0.5 mg/kg), and/or phosphate-buffered saline (PBS) were injected intraperitoneally to nude mice. n = 5. RFP+ cells in the peritoneal cavity were assessed by flow cytometry. RFP+ cells attached to the ovaries or epididymal fat pads were assessed by manual cell counting of the dissociated tissues. bd The numbers of RFP+ FT240 cells in the peritoneal cavity (b), attached to the ovaries (c), and attached to the epididymal fat pads (d) were increased by BDNF treatment and deceased by ANA-12 treatment. *p < 0.05, **p < 0.005, ***p < 0.0005, and #p < 0.0001 for unpaired Student’s t test. e Schematic flow chart illustrating the co-culture of adipose tissues and FT240 cells. f BDNF (50 ng/ml) increased the percentage of FT240 cells attached to the adipose tissues. n = 5. #p < 0.0005 for unpaired Student’s t test.
Fig. 6
Fig. 6. BDNF promotes the expression of prosurvival and prometastasis genes in vitro and in vivo.
a Heat map and Ingenuity Pathway Analysis (IPA) of human transcriptome array of untreated (NT) and BDNF-treated FT240 cells in 3D culture for 24 h. n = 3. *Network functions score was determined by number of molecules, cellular, and disease processes predicted to be affected by differentially regulated genes in BDNF-treated FT240 cells vs. control cells as determined by the IPA software. b Schematic flow chart of mice injected with RFP+ ovarian cancer (OVC) cells. ce BDNF (0.2 ng/mouse) treatment increased the numbers of RFP+ OVC cells in the peritoneal cavity (c), attached to the ovaries (d), and attached to the fat tissues (e). n = 5. *p < 0.05, **p < 0.005, and #p < 0.0005 for unpaired Student’s t test. f Schematic flow chart of mice injected with RFP+ ovarian cancer (OVC) cells. OVC cells and BDNF (0.2 ng/kg) were injected intraperitoneally to nude mice. n = 5. Representative images of in vivo live imaging of mice 10 days after injection. g Tumor growth curves of mice injected with RFP+ OVC cells. Two-way ANOVA followed by Sidak’s test. h Weight of tumors from mice injected with RFP+ OVC cells. Student’s t test, *p < 0.05. i RT-QPCR data of tumors from mice injected with PBS (untreated, NT, n = 3) or BDNF (n = 4). p < 0.0001 between the PBS and BDNF groups, two-way ANOVA followed by Sidak HSD test, *p < 0.05 between the PBS and BDNF groups for each gene.

Similar articles

Cited by

References

    1. Bell DA. Origins and molecular pathology of ovarian cancer. Mod. Pathol. 2005;18(Suppl 2):S19–S32. - PubMed
    1. Werness BA, et al. Altered surface and cyst epithelium of ovaries removed prophylactically from women with a family history of ovarian cancer. Hum. Pathol. 1999;30:151–157. - PubMed
    1. Bell DA, Scully RE. Early de novo ovarian carcinoma. A study of fourteen cases. Cancer. 1994;73:1859–1864. - PubMed
    1. Callahan MJ, et al. Primary fallopian tube malignancies in BRCA-positive women undergoing surgery for ovarian cancer risk reduction. J. Clin. Oncol. 2007;25:3985–3990. - PubMed
    1. Carcangiu ML, et al. Atypical epithelial proliferation in fallopian tubes in prophylactic salpingo-oophorectomy specimens from BRCA1 and BRCA2 germline mutation carriers. Int. J. Gynecol. Pathol. 2004;23:35–40. - PubMed