. 2020 May 29;10(1):8768.
doi: 10.1038/s41598-020-65563-3.

Probe-target hybridization depends on spatial uniformity of initial concentration condition across large-format chips

Affiliations

Probe-target hybridization depends on spatial uniformity of initial concentration condition across large-format chips

Alisha Geldert et al. Sci Rep. .

Abstract

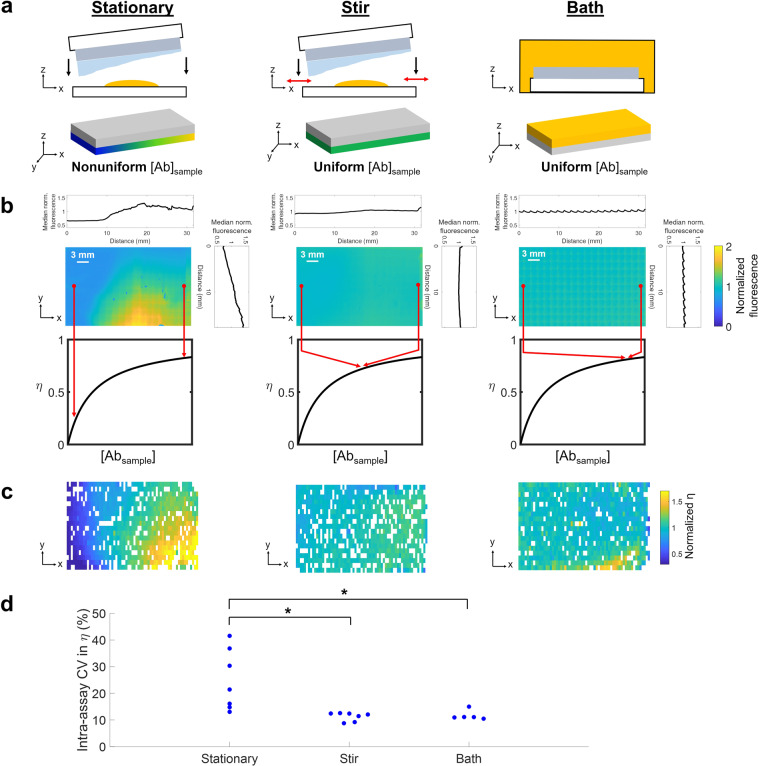
Diverse assays spanning from immunohistochemistry (IHC), to microarrays (protein, DNA), to high-throughput screens rely on probe-target hybridization to detect analytes. These large-format 'chips' array numerous hybridization sites across centimeter-scale areas. However, the reactions are prone to intra-assay spatial variation in hybridization efficiency. The mechanism of spatial bias in hybridization efficiency is poorly understood, particularly in IHC and in-gel immunoassays, where immobilized targets are heterogeneously distributed throughout a tissue or hydrogel network. In these systems, antibody probe hybridization to a target protein antigen depends on the interplay of dilution, thermodynamic partitioning, diffusion, and reaction. Here, we investigate parameters governing antibody probe transport and reaction (i.e., immunoprobing) in a large-format hydrogel immunoassay. Using transport and bimolecular binding theory, we identify a regime in which immunoprobing efficiency (η) is sensitive to the local concentration of applied antibody probe solution, despite the antibody probe being in excess compared to antigen. Sandwiching antibody probe solution against the hydrogel surface yields spatially nonuniform dilution. Using photopatterned fluorescent protein targets and a single-cell immunoassay, we identify regimes in which nonuniformly distributed antibody probe solution causes intra-assay variation in background and η. Understanding the physicochemical factors affecting probe-target hybridization reduces technical variation in large-format chips, improving measurement precision.


Conflict of interest statement

A.E.H. is an inventor on several filed patents related to single-cell immunoblotting. The authors declare no other competing interests.

Figures

Figure 1
Figure 1
Critical parameters influencing and affected by local antibody probe concentration in large-format chips. (a) Two examples of large-format chips: single-cell immunoblot and immunohistochemistry. In both systems, target molecules are immobilized in unknown locations withing a sample matrix (10s of µm thick, centimeters long) and must be incubated with concentrated probe solution for detection. (bd) Physicochemical phenomena which influence immunoprobing efficiency in these assays. (b) Method of distributing a thin antibody fluid layer across a hydrated sample surface may nonuniformly dilute the antibody. Lateral spatial variation in antibody concentration will not equilibrate over assay immunoprobing timescales because the diffusive timescale of antibody across the lateral length scale (L) of the assay (τacross fluid layer) is much greater than the diffusive timescale of antibody into the sample matrix (τinto sample). Here, τinto sample is calculated using the diffusivity of antibody in an 8%T polyacrylamide gel. (c) Equilibrium antibody concentration in a porous sample ([Ab]sample) is governed by the partition coefficient (K) of antibody into the sample and the antibody concentration at the free solution-sample boundary ([Ab]soln). (d) η is strongly dependent on the concentration of antibody in the sample when the concentration is near the antibody dissociation constant (KD), even when antibody is in excess compared to antigen.
Figure 2
Figure 2
Intra-assay spatial variation in antibody probe distribution and η in three immunoprobing configurations yielding different concentration boundary conditions: a stationary antibody fluid layer, a stirred antibody fluid layer, or an antibody bath. (a) We hypothesize that a stationary antibody fluid layer will have lateral spatial variation in antibody concentration due to nonuniform dilution by an uneven fluid layer on the gel. We also hypothesize that stirring the antibody fluid layer by shifting the gel laterally will homogenize the fluid layer to a similar extent as an antibody bath (positive control). (b) Representative heatmaps of antibody fluorescence across the fluid layer, normalized to the mean fluorescence intensity within each image. Median intensity profiles in the x- and y- directions demonstrate that spatial nonuniformity in antibody concentration is greatest in the stationary antibody fluid layer. Bimolecular binding modeling shows that if KD ≈ [Absample], spatial variation in antibody distribution yields variation in η. (c) Representative heatmaps of η of photopatterned tGFP spots immunoprobed with a stationary antibody fluid layer, stirred antibody fluid layer, or antibody bath (chips in (c) were not probed with the antibody fluid layers shown in (b); the spatial patterns are not directly comparable). Each rectangle in the heatmap represents one tGFP spot; white rectangles are spots which did not pass quality control standards and thus do not have quantifiable η. (d) Beeswarm plot of intra-assay CV in η (Kruskal-Wallis test, p = 0.0033; post-hoc Tukey test, pstationary vs. stir = 0.0091, pstationary vs. bath = 0.0131).
Figure 3
Figure 3
Quantifying the degree of agreement between photo-immobilized and immunoprobed AUC of photopatterned tGFP spots as a measure of intra-assay technical variation. Bland-Altman analysis is used to obtain a measure of technical variation in the stationary, stirred, and bath immunoprobing conditions. (a) Photo-immobilized AUC values are mapped to the immunoprobed AUC scale using the linear fit of photo-immobilized and immunoprobed data. (b) True immunoprobed AUCs (based on the linear fit mapping of photo-immobilized AUC) and measured immunoprobed AUCs are log-transformed to facilitate subsequent data analysis and interpretation. The line of equality (y = x) is also shown to indicate what the data would look like in the absence of technical variation. (c) The differences between the log-transformed measured and true immunoprobed AUCs are plotted against protein abundance. The limits of agreement are calculated based on the mean (µ) and standard deviation (σ) of these differences. (d) Data and limits of agreement are back-transformed by taking the anti-log of each value. (e) Fold difference in measured immunoprobed signal which arises from two replicate photo-immobilized protein spots, based on Bland-Altman analysis. Each point on the beeswarm plot is a replicate assay; each assay contains ~1100 photopatterned tGFP bands. Gels immunoprobed with a stationary antibody fluid layer have significantly greater technical variation as compared to the bath immunoprobing configurations (Kruskal-Wallis test, p = 0.0039; post-hoc Tukey test, pstationary vs. bath = 0.0032).
Figure 4
Figure 4
Spatial distribution of background fluorescence and η in a large-format in-gel immunoassay to measure single-cell protein abundance. (a) Single-cell immunoblotting workflow. When run with tGFP-expressing cells, upstream measurement of photo-immobilized tGFP abundance can be measured in addition to immunoprobed tGFP abundance, the standard assay readout. (b,c) Heatmaps of background fluorescence and η in each assay (normalized to the mean within each assay); background was measured in each separation lane, but η is only measured in lanes with a settled cell. Spatial variation in background fluorescence and η is greater when immunoprobing with a (b) stationary antibody fluid layer than with a (c) stirred antibody fluid layer. (d) Intra-assay CV in background fluorescence is significantly higher in assays immunoprobed with a stationary antibody fluid layer than a stirred layer, supporting the hypothesis that in-gel antibody concentration does not diffusively homogenize over immunoprobing timescales (Mann-Whitney U test, p = 0.0159). (e) Intra-assay CV in η in assays immunoprobed with a stationary (n = 5) and stirred (n = 4) fluid layer. (f) Fold difference in measured immunoprobed signal which arises from two replicate photo-immobilized protein spots, based on Bland-Altman analysis. The fold difference is generally greater for assays immunoprobed with a stationary antibody fluid layer, indicating higher technical variation in η.

Similar articles

Cited by

References

    1. Steger Doris, Berry David, Haider Susanne, Horn Matthias, Wagner Michael, Stocker Roman, Loy Alexander. Systematic Spatial Bias in DNA Microarray Hybridization Is Caused by Probe Spot Position-Dependent Variability in Lateral Diffusion. PLoS ONE. 2011;6(8):e23727. - PMC - PubMed
    1. Mazoure B, Nadon R, Makarenkov V. Identification and correction of spatial bias are essential for obtaining quality data in high-throughput screening technologies. Scientific Reports. 2017;7:11921. - PMC - PubMed
    1. Anderson T, Wulfkuhle J, Liotta L, Winslow RL, Petricoin E. Improved reproducibility of reverse-phase protein microarrays using array microenvironment normalization. Proteomics. 2009;9:5562–5566. - PMC - PubMed
    1. Kaushik P, et al. Spatial Normalization of Reverse Phase Protein Array Data. Plos One. 2014;9:e97213. - PMC - PubMed
    1. Adey NB, et al. Gains in Sensitivity with a Device that Mixes Microarray Hybridization Solution in a 25-μm-Thick Chamber. Anal. Chem. 2002;74:6413–6417. - PubMed

Publication types

MeSH terms