. 2020 May 29;11(1):2677.
doi: 10.1038/s41467-020-16504-1.

A network of RNA-binding proteins controls translation efficiency to activate anaerobic metabolism

Affiliations

A network of RNA-binding proteins controls translation efficiency to activate anaerobic metabolism

J J David Ho et al. Nat Commun. .

Abstract

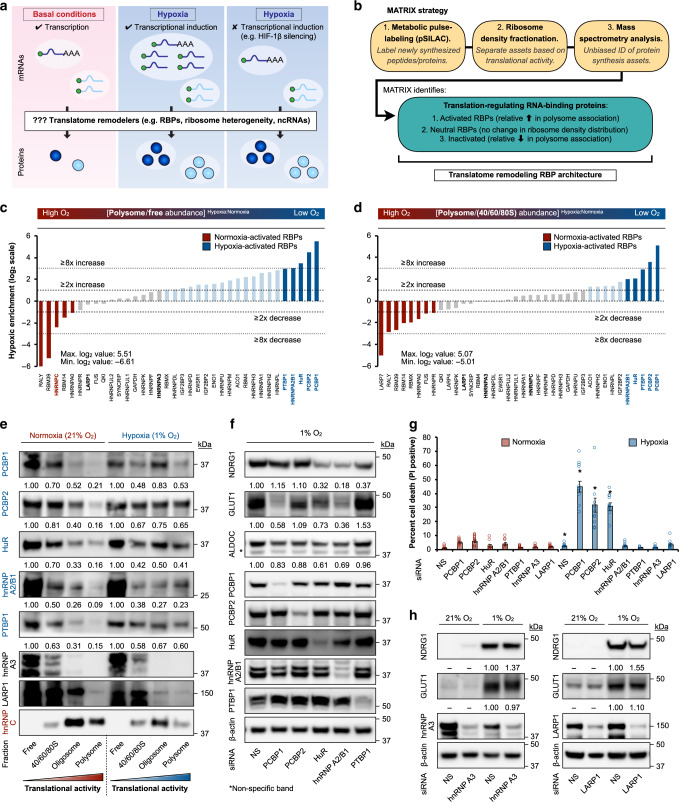
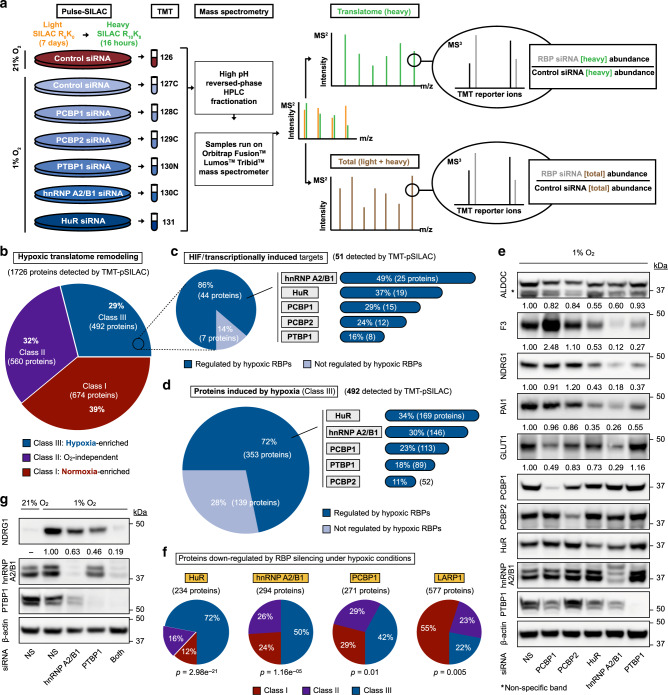
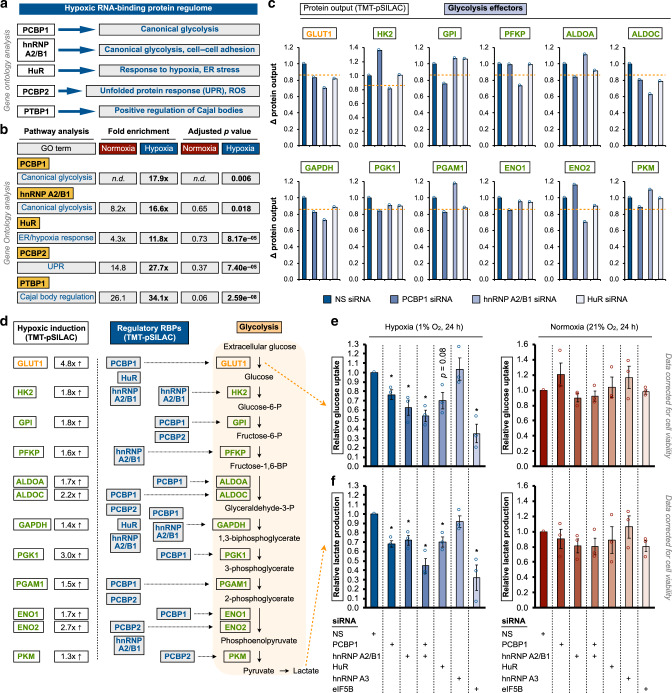
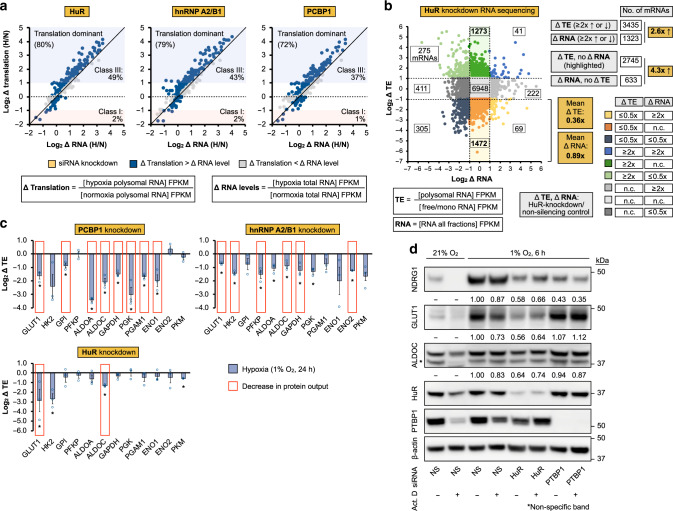
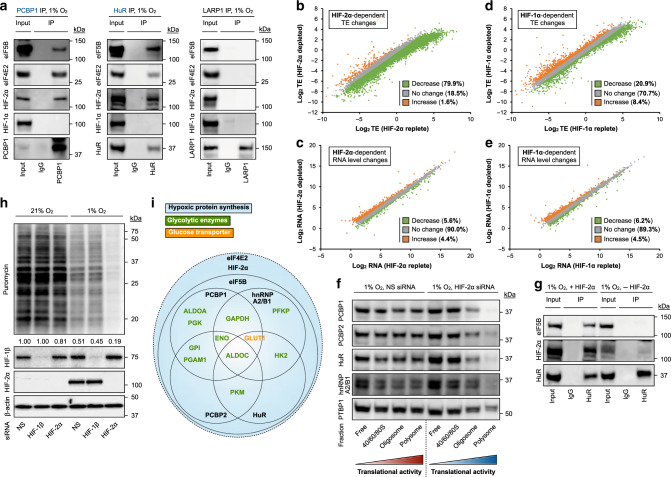
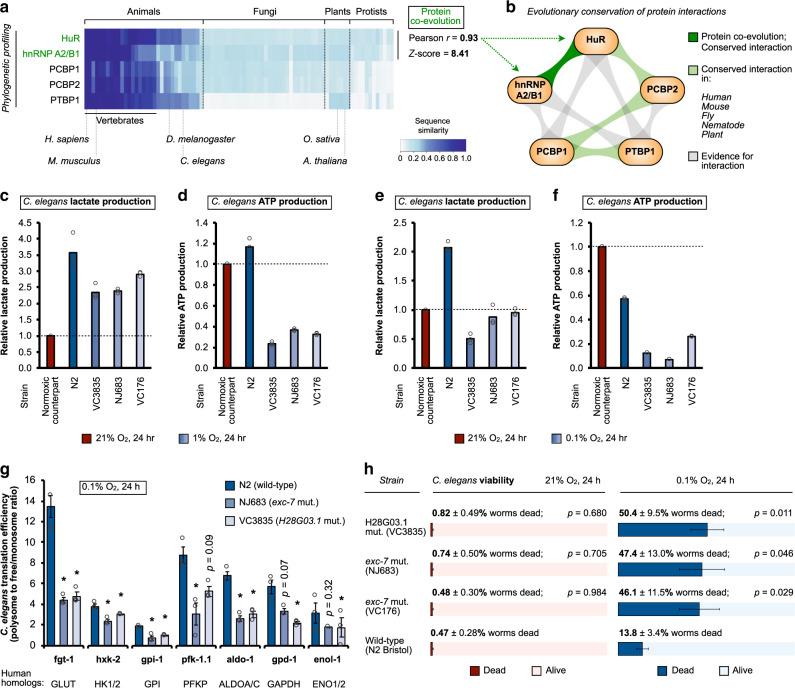
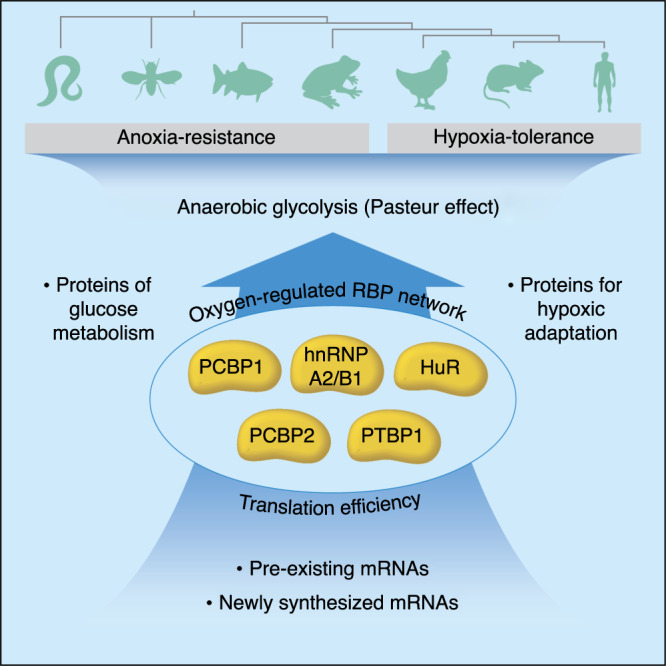
Protein expression evolves under greater evolutionary constraint than mRNA levels, and translation efficiency represents a primary determinant of protein levels during stimuli adaptation. This raises the question as to the translatome remodelers that titrate protein output from mRNA populations. Here, we uncover a network of RNA-binding proteins (RBPs) that enhances the translation efficiency of glycolytic proteins in cells responding to oxygen deprivation. A system-wide proteomic survey of translational engagement identifies a family of oxygen-regulated RBPs that functions as a switch of glycolytic intensity. Tandem mass tag-pulse SILAC (TMT-pSILAC) and RNA sequencing reveals that each RBP controls a unique but overlapping portfolio of hypoxic responsive proteins. These RBPs collaborate with the hypoxic protein synthesis apparatus, operating as a translation efficiency checkpoint that integrates upstream mRNA signals to activate anaerobic metabolism. This system allows anoxia-resistant animals and mammalian cells to initiate anaerobic glycolysis and survive hypoxia. We suggest that an oxygen-sensitive RBP cluster controls anaerobic metabolism to confer hypoxia tolerance.


Conflict of interest statement

The authors declare no competing interests.

Figures

Fig. 1
Fig. 1. Oxygen-sensitive rewiring of RBP engagement in protein synthesis.
a Model of hypoxia-induced translatome remodeling, highlighting the concept that translational reprogramming resulting in increased protein synthesis can occur independently of mRNA-level adaptations. Color scheme: red, normoxia; blue, hypoxia. b Schematic of MATRIX platform. Asset refers to proteins involved in translation, e.g., translation factors, ribosomal proteins, RBPs, etc. c Primary MATRIX readout of relative RBP translational engagement (ratio of polysome/free protein abundance) in hypoxic (1% O2, 24 h, blue) versus normoxic (21% O2, 24 h, red) U87MG. d Secondary MATRIX readout of relative RBP translational engagement (ratio of polysome/monosome protein abundance). Validated RBPs (e) are bolded. e Representative immunoblots of indicated RBPs in normoxic and hypoxic U87MG ribosome density fractions. RBPs whose translational activity is activated and repressed by hypoxia are highlighted in blue and red, respectively. Quantitation represents mean of three independent experiments (n = 3). f Representative immunoblots of U87MG treated with siRNAs (for 48 h prior to following experimentation) against hypoxia-adaptive RBPs. NS: non-silencing. Quantitation represents mean of four independent experiments (n = 4). g Cell death measurements by propidium iodide (PI) staining in U87MG treated with indicated siRNAs. Asterisk denotes statistical significance calculated using two-sided Student’s t-tests compared to corresponding normoxic measurements. Exact p values: NS siRNA (p = 0.005), PCBP1 siRNA (p = 2.11e−06), HuR siRNA (p = 0.0006), and hnRNP A2/B1 siRNA (p = 2.08e−07). Data represent mean ± SEM (error bars) (n = 10 fields over three independent experiments). h Representative immunoblots of U87MG treated with siRNAs against non-hypoxia-activated RBPs. NS: non-silencing. Quantitation represents mean of three independent experiments (n = 3). Source data are provided as a Source data file.
Fig. 2
Fig. 2. Translatome (protein output) remodeling by hypoxia-adaptive RBPs.
a Schematic of TMT-pSILAC translatome analysis strategy. Color scheme: red, normoxia; blue, hypoxia. b Hypoxic translatome (protein output) remodeling. Class III: hypoxia-enriched proteins (at least 15% increase protein output under hypoxic conditions); Class II: oxygen-neutral proteins (no change in protein output); Class I: normoxia-enriched proteins (at least 15% decrease in protein output under hypoxic conditions). c Classical HIF/transcriptionally induced targets represent ~10% of all Class III proteins. Left panel: of these, 86% are regulated by the top five hypoxia-adaptive RBPs identified by MATRIX. Right panel: percentage and number of proteins regulated by each RBP. d Left panel: the majority (72%) of all Class III, hypoxia-inducible proteins are regulated by the top five hypoxia-adaptive RBPs identified by MATRIX. Right panel: percentage and number of proteins regulated by each RBP. e Representative immunoblots of U87MG treated with siRNAs (for 48 h prior to following experimentation) against hypoxia-adaptive RBPs. NS: non-silencing. Quantitation represents mean of three independent experiments (n = 3). f Classification of proteins downregulated at the production level by knockdowns of indicated RBPs. p values represent Chi-Square tests for significant proportional differences compared to overall hypoxic translatome remodeling (presented in b). g Representative immunoblots of U87MG treated with siRNAs against one or two hypoxia-adaptive RBPs. NS: non-silencing. Quantitation represents mean of three independent experiments (n = 3). Source data are provided as a Source data file.
Fig. 3
Fig. 3. Oxygen-dependent reconfiguration of RBP-regulated cellular networks.
a Hypoxia-induced rewiring of RBP-regulated processes by Gene Ontology (GO) pathway enrichment analysis. b GO analysis of representative enriched biological processes for downregulated proteins when indicated RBPs are silenced. c Protein output regulation of each glycolytic effector by the hypoxia-adaptive RBPs PCBP1, hnRNP A2/B1, and HuR, as determined by TMT-pSILAC (three independent experiments pooled into a single sample for measurement). Orange dotted line represents the MS regulatory threshold, validated empirically at the steady-state protein level by immunoblot, and at the translation efficiency level by qRT-PCR of ribosome density fractions. d Left panel: protein expression of glycolytic effectors are induced under hypoxic conditions (confirmed by TMT-pSILAC). Synergistic regulation of glycolytic proteins (right panel) by hypoxia-adaptive RBPs (middle panel) as determined by TMT-pSILAC analysis. Measurements of e glucose uptake and f lactate production in U87MG treated with indicated siRNAs (for 48 h prior to following experimentation). Color scheme: red, normoxia; blue, hypoxia. NS: non-silencing. Asterisk denotes statistical significance calculated using two-sided Student’s t-tests compared to NS control. Exact p values e: PCBP1 siRNA (p = 0.04), hnRNP A2/B1 siRNA (p = 0.04), PCBP1 + hnRNPA2/B1 siRNA (p = 0.02), eIF5B siRNA (p = 0.02). Exact p values f: PCBP1 siRNA (p = 0.01), hnRNP A2/B1 siRNA (p = 0.03), PCBP1 + hnRNPA2/B1 siRNA (p = 0.02), HuR siRNA: (p = 0.03), eIF5B siRNA (p = 0.04). Data represent mean ± SEM (error bars) of three independent experiments. Source data are provided as a Source data file.
Fig. 4
Fig. 4. Hypoxia-adaptive RBPs promote glycolytic induction through translation efficiency.
a Mechanism of hypoxic induction for RBP-dependent translatomes. Global analysis of hypoxia-induced translational versus RNA-level changes in U87MG using RNA sequencing of ribosome density fractions for HuR-, hnRNP A2/B1-, and PCBP1-dependent targets. Color scheme: red, Class I proteins, normoxia-enriched; blue, Class III proteins, hypoxia-enriched. b Global analysis of HuR-dependent changes in mRNA translation efficiency and steady-state expression in U87MG using RNA sequencing of ribosome density fractions following siRNA-mediated HuR-silencing. c Hypoxic translation efficiency regulation of glycolytic effectors by the hypoxia-adaptive RBPs PCBP1, hnRNP A2/B1, and HuR, as determined by qRT-PCR of ribosome density fractions. Asterisk denotes statistical significance calculated using two-sided Student’s t-tests compared to non-silencing control. Exact p values: PCBP1 siRNA: GLUT1 (p = 0.02), GPI (p = 0.03), ALDOA (p = 0.001), ALDOC (p = 0.02), GAPDH (p = 0.007), PGK (p = 0.03), PGAM1 (p = 0.004), ENO1 (p = 0.047); hnRNP A2/B1 siRNA: GLUT1 (p = 0.007), HK2 (p = 0.004), PFKP (p = 0.04), ALDOA (p = 0.04), ALDOC (p = 0.048), GAPDH (p = 0.05), PGK (p = 0.03), ENO2 (p = 6.79e−05); HuR siRNA: GLUT1 (p = 0.04), HK2 (p = 0.04), ALDOC (p = 0.001), PKM (p = 0.0008). Data represent mean ± SEM (error bars) of three independent experiments (n = 3). Red box: observed decrease in protein output as determined by TMT-pSILAC. d Representative immunoblots of normoxic and hypoxic (6 h) U87MG treated with actinomycin D (+) or vehicle DMSO (−). NS: non-silencing. Quantitation represents mean of three independent experiments (n = 3). Source data are provided as a Source data file.
Fig. 5
Fig. 5. Oxygen-sensitive RBPs collaborate with the hypoxic protein synthesis machinery.
a Representative immunoblots of HuR, PCBP1 (hypoxia-adaptive, blue), and LARP1 (non-hypoxia-activated, black) co-immunoprecipitations in U87MG. Three independent experiments (n = 3) were performed with similar results. Global RNA sequencing analysis of (b, c) HIF-2α- and (d, e) HIF-1α-dependent changes in (b, d) translation efficiency (TE) and (c, e) steady-state mRNA levels. f Representative immunoblots of hypoxia-adaptive RBPs in hypoxic U87MG ribosome density fractions with and without HIF-2α siRNA-mediated knockdown (for 48 h prior to following experimentation). Color scheme: red, normoxia; blue, hypoxia. Three independent experiments (n = 3) were performed with similar results. g Representative immunoblots of HuR co-immunoprecipitations with and without HIF-2α siRNA-mediated knockdown in U87MG. Three independent experiments (n = 3) were performed with similar results. h Representative immunoblots of U87MG treated with indicated siRNAs. Puromycin incorporation was used as a measure of global translational intensity. NS: non-silencing. Quantitation represents mean of three independent experiments (n = 3). i Empirically derived model of functional integration between hypoxia-adaptive RBPs and elements of the hypoxic protein synthesis machinery. Source data are provided as a Source data file.
Fig. 6
Fig. 6. The oxygen-sensitive RBP network regulates hypoxia sensitivity across species.
a Protein sequence similarity of hypoxia-activated RBPs across species. High protein sequence similarity (compared to the human homolog, first column) is indicated by dark blue coloring, and low protein similarity by light blue/white coloring (see legend on bottom right corner of panel). Analysis using the normalized phylogenetic profiling algorithm identified evidence suggesting co-evolution between HuR and hnRNP A2/B1 (Pearson r = 0.93, z score = 8.41). b Analysis of published RBP interactome data using the BioGRID bioinformatics resource reveals conserved protein interactions (indicated in green) between hypoxia-adaptive RBPs. An interaction is considered conserved if observed in human, mouse, fly, nematode, and at least one plant species. Measurements of c, e lactate and d, f ATP production in C. elegans subjected to c, d 1% O2 or e, f 0.1% O2. Color scheme: red, normoxia; blue, hypoxia. Data represent mean of triplicate measurements from a representative experiment. Three independent experiments (n = 3) were performed with similar results. g Translation efficiencies of glycolytic effectors in hypoxic (0.1% O2) C. elegans that contain wild-type (N2) or mutant homologs of HuR (exc-7, strain NJ683) or hnRNP A2/B1 (H28G03.1, strain VC3835), as determined by qRT-PCR of ribosome density fractions. Asterisk denotes statistical significance calculated using two-sided Student’s t-tests compared to wild-type control. Exact p values: NJ683: fgt-1 (p = 0.02), hxk-2 (p = 0.04), gpi-1 (p = 0.02), pfk-1.1 (p = 0.03), aldo-1 (p = 0.002); VC3835: fgt-1 (p = 0.03), hxk-2 (p = 0.04), gpi-1 (p = 0.003), aldo-1 (p = 0.009), gpd-1 (p = 0.02), enol-1 (p = 0.004). Data represent mean ± SEM (error bars) of three independent experiments (n = 3). h Measurements of normoxic and hypoxic (0.1% O2) death for adult (day 1 at the start of treatment) C. elegans that contain wild-type (N2) or mutant homologs of HuR (strains NJ683 and VC176) or hnRNP A2/B1 (strain VC3835). Statistical significance was calculated using two-sided Student’s t-tests compared to wild-type control. Exact p values are indicated in the figure. Data represent mean ± SEM (error bars) of four independent experiments (n = 4; total number of worms for N2, NJ683, VC176, VC3835: 927, 860, 753, 731, respectively). Source data are provided as a Source data file.
Fig. 7
Fig. 7. A network of RBPs activates anaerobic glycolysis through translation efficiency.
An abstract representation of hypoxia-activated RBPs that activate anaerobic metabolism through mRNA translation efficiency of glycolytic proteins. This system enables hypoxic tolerance across species.

References

    1. DeBerardinis RJ, Thompson CB. Cellular metabolism and disease: what do metabolic outliers teach us? Cell. 2012;148:1132–1144. - PMC - PubMed
    1. Muller M, et al. Biochemistry and evolution of anaerobic energy metabolism in eukaryotes. Microbiol Mol. Biol. Rev. 2012;76:444–495. - PMC - PubMed
    1. Fothergill-Gilmore LA, Michels PA. Evolution of glycolysis. Prog. Biophys. Mol. Biol. 1993;59:105–235. - PubMed
    1. Racker E. History of the Pasteur effect and its pathobiology. Mol. Cell Biochem. 1974;5:17–23. - PubMed
    1. Hochachka PW, Buck LT, Doll CJ, Land SC. Unifying theory of hypoxia tolerance: molecular/metabolic defense and rescue mechanisms for surviving oxygen lack. Proc. Natl Acad. Sci. USA. 1996;93:9493–9498. - PMC - PubMed

Publication types