. 2020 May 29;11(1):2682.
doi: 10.1038/s41467-020-16395-2.

ISG15 and ISGylation is required for pancreatic cancer stem cell mitophagy and metabolic plasticity

Affiliations

ISG15 and ISGylation is required for pancreatic cancer stem cell mitophagy and metabolic plasticity

Sonia Alcalá et al. Nat Commun. .

Abstract

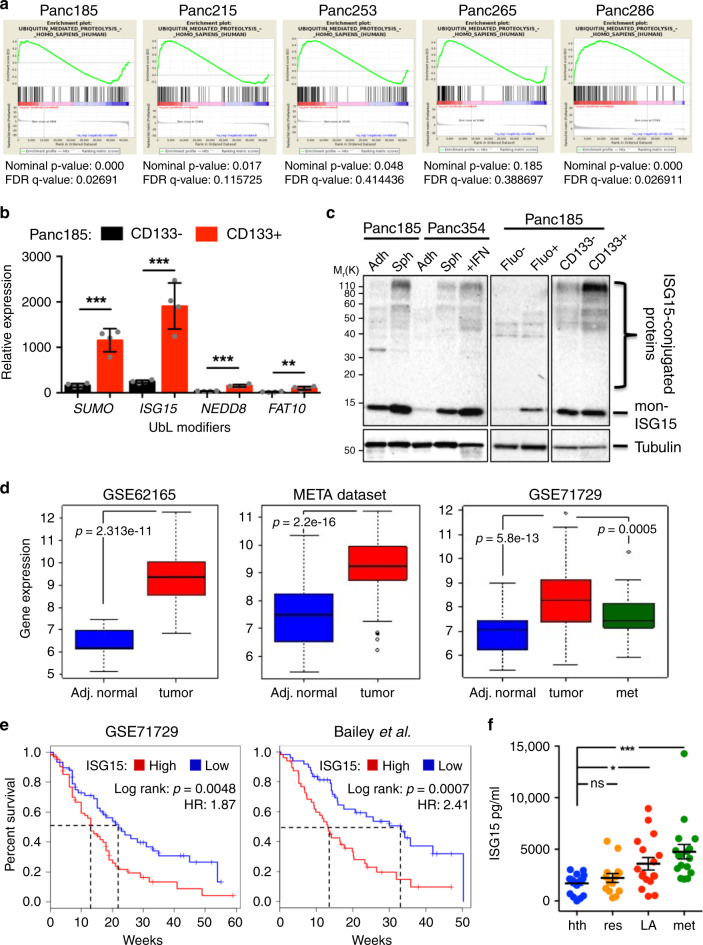
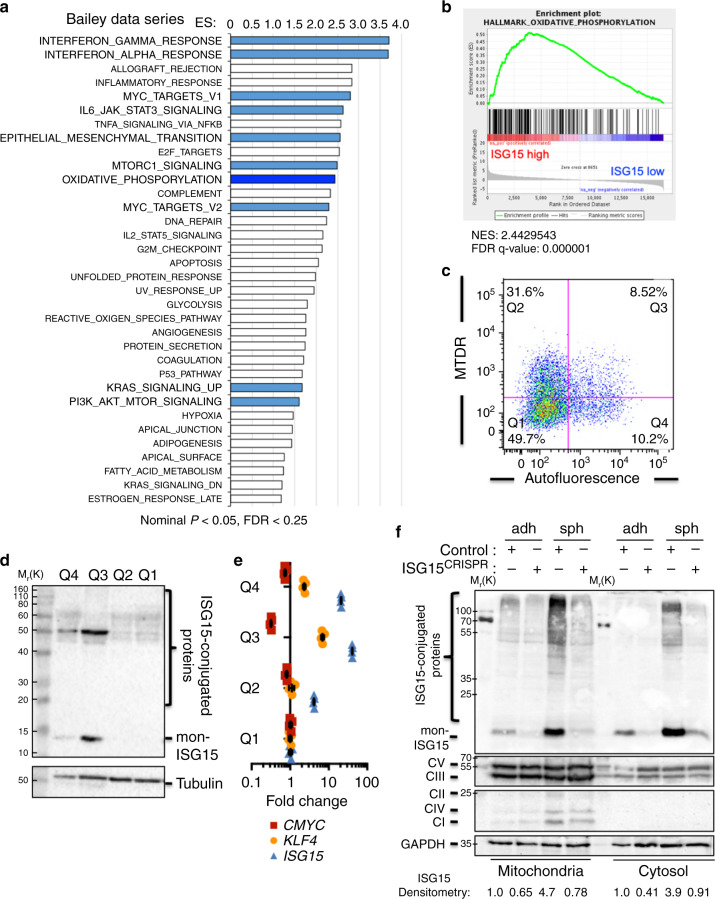
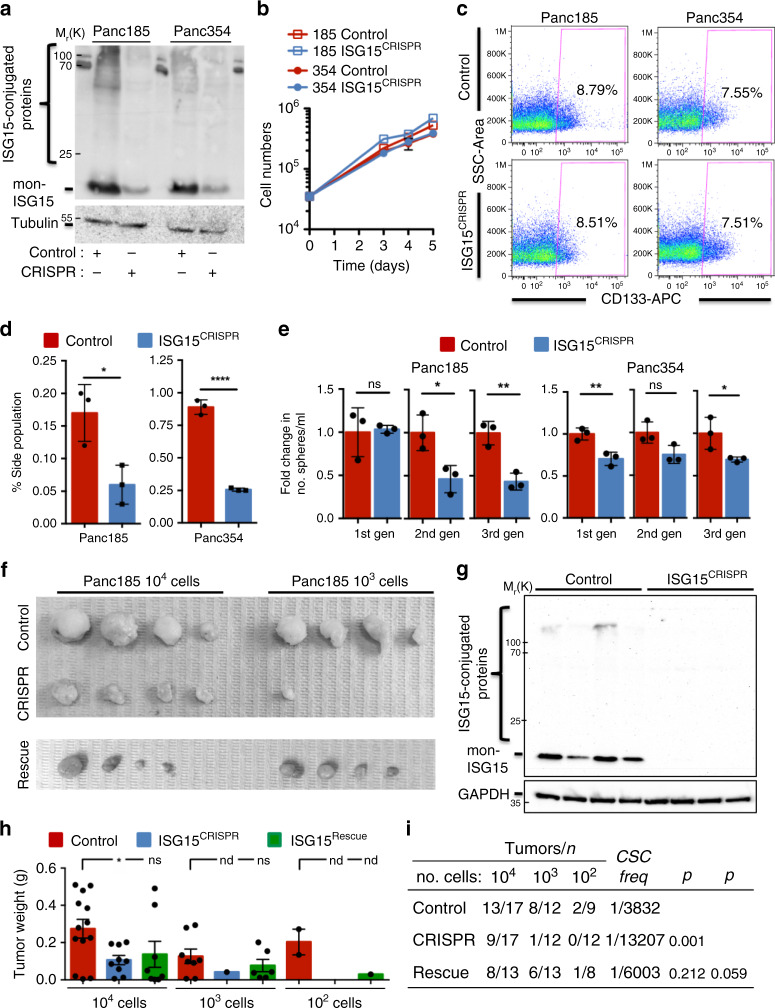
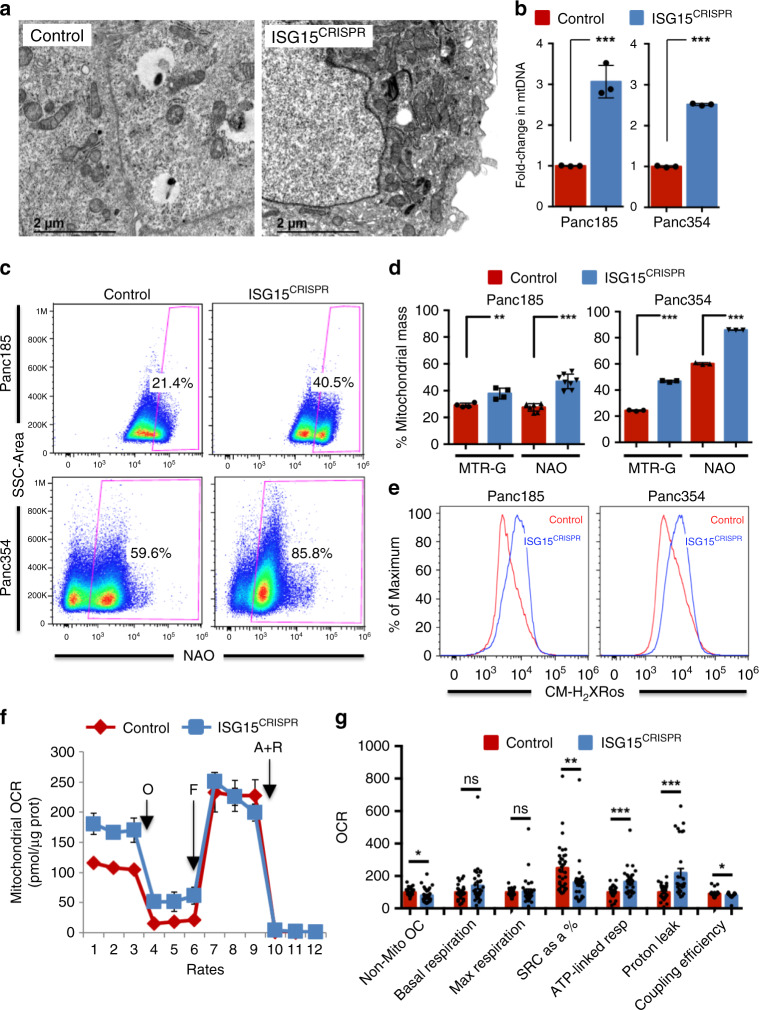
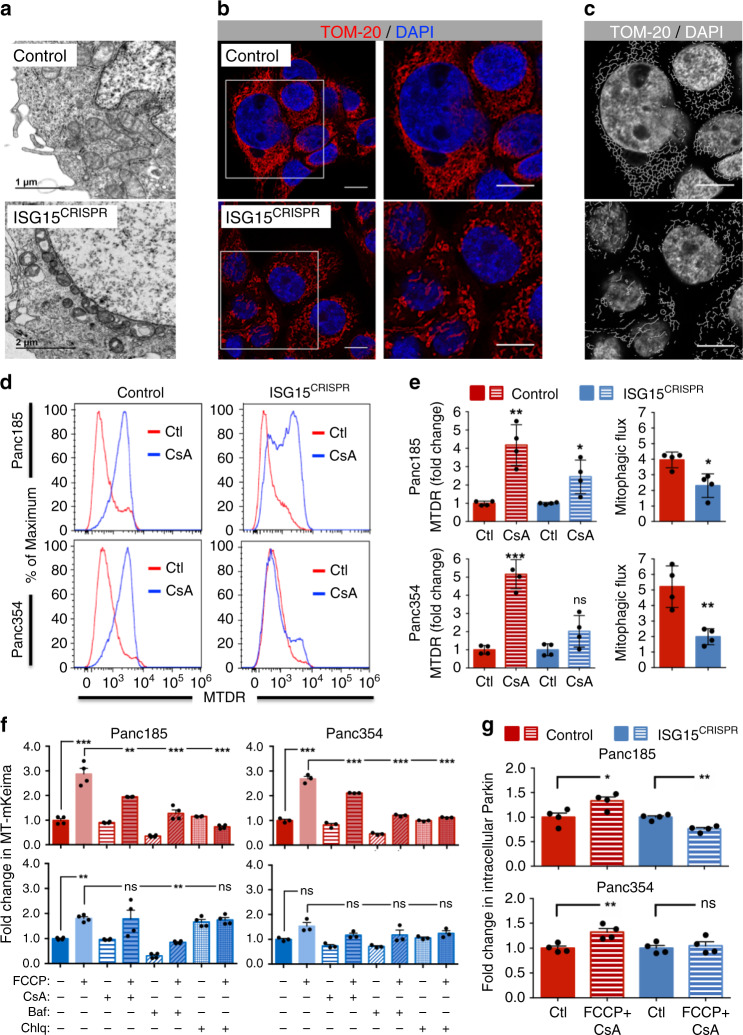
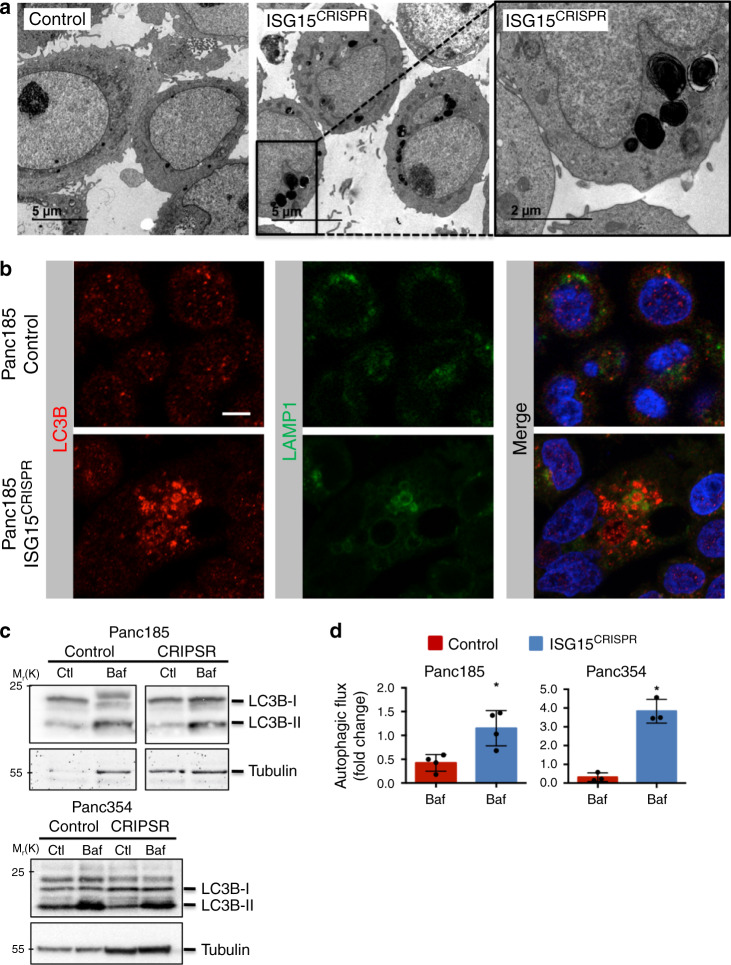
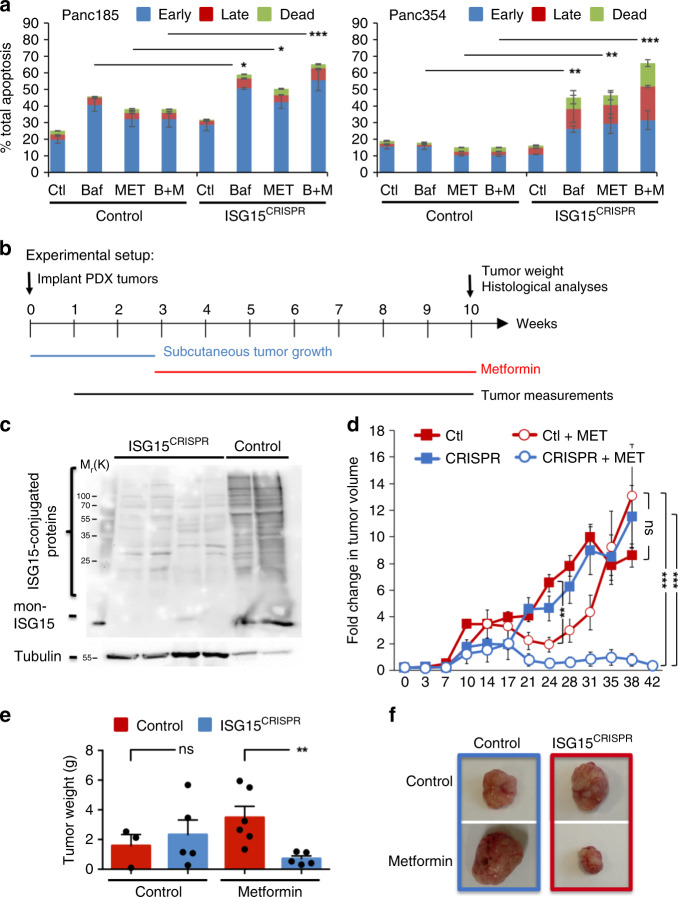
Pancreatic cancer stem cells (PaCSCs) drive pancreatic cancer tumorigenesis, chemoresistance and metastasis. While eliminating this subpopulation of cells would theoretically result in tumor eradication, PaCSCs are extremely plastic and can successfully adapt to targeted therapies. In this study, we demonstrate that PaCSCs increase expression of interferon-stimulated gene 15 (ISG15) and protein ISGylation, which are essential for maintaining their metabolic plasticity. CRISPR-mediated ISG15 genomic editing reduces overall ISGylation, impairing PaCSCs self-renewal and their in vivo tumorigenic capacity. At the molecular level, ISG15 loss results in decreased mitochondrial ISGylation concomitant with increased accumulation of dysfunctional mitochondria, reduced oxidative phosphorylation (OXPHOS) and impaired mitophagy. Importantly, disruption in mitochondrial metabolism affects PaCSC metabolic plasticity, making them susceptible to prolonged inhibition with metformin in vivo. Thus, ISGylation is critical for optimal and efficient OXPHOS by ensuring the recycling of dysfunctional mitochondria, and when absent, a dysregulation in mitophagy occurs that negatively impacts PaCSC stemness.


Conflict of interest statement

The authors declare no competing interests.

Figures

Fig. 1
Fig. 1. Ub and UbL pathways are enriched in PaCSCs and predict survival.
a Ubiquitin pathway enrichment plots from RNAseq analysis (ArrayExpress: E-MTAB-3808) of sphere and adherent cultures (CSCs and non-CSCs, respectively) derived from five different primary PDX PDAC cultures. b Mean relative mRNA levels ± sd of UbL modifiers ISG15, SUMO, NEDD8, and FAT10 in CD133 + and CD133– cells sorted from Panc185 spheres. Data are normalized to β-Actin mRNA expression. (n = 4 biologically independent sortings; **p = 0.0058; ***p < 0.001, as determined by Student’s t-test). c Western blot (WB) analysis of monomeric (mon)-ISG15 and ISG15-conjugated proteins in non-CSCs [adherent (adh), Fluo- and CD133–] versus CSCs [spheres (sph), Fluo+ or CD133 + ] from indicated PDX-derived cultures. Interferon (IFN)-treated Panc354 cells was used as positive control and tubulin as a loading control. Molecular weight markers kDa Mr(K) are shown. d Box and Whisker Plots showing the differential expression of ISG15 in normal adjacent (Adj.) tissue versus PDAC tumors and metastasis (met) in three independent transcriptomic data series: GSE62165 (13 Adj. normal, 118 tumors), META data set (70 Adj. normal, 108 tumors), GSE71729 (45 Adj. normal, 145 tumors, 61 mets). Rectangles show the first quartile, the median, and the third quartile. The two whiskers indicate the minimum and maximum values, and outliers are depicted as circles (unpaired two-sided Student’s t-test). e Kaplan–Meier curves showing the overall survival of PDAC patients in two independent data series: GSE71729 (n = 145) and Bailey (n = 96), stratified according to the median value of ISG15 expression. HR hazard ratio. A Log-rank test was performed for survival analysis and a Cox Proportional Hazard regression model to calculate HRs. f Mean ISG15 protein levels (pg/mL) ± sem present in serum form healthy (hth) (n = 21), resectable (res) (n = 14), locally advanced (LA) (n = 17), and metastasis (met) (n = 19) patients. *p < 0.05; ***p < 0.001; ns, not significant, as determined by one-way ANOVA with Bonferroni’s multiple comparisons test.
Fig. 2
Fig. 2. ISG15 expression is linked to mitochondria-related pathways.
a Gene sets enriched in the transcriptional profile of tumors belonging to the top ISG15 high-expression group, compared with the bottom expression group in the Bailey data series. Shown are the NES (normalized enrichment score) values for each pathway using the Hallmark genesets, meeting the significance criteria: nominal p-value of <0.05, FDR < 25%. b Enrichment plot for OXPHOS signaling in ISG15 high versus low. c Autofluorescence (CSC) and Mitotracker Deep Red (MTDR, approximation of mitochondrial mass) were combined to sort the four gated populations (Q1–Q4) from Panc185 spheres. d WB analysis of ISG15 protein expression in the four FACS sorted populations in c. Tubulin was included as a loading control. e RTqPCR analysis of CMYC, KLF4 and ISG15 gene mean fold change ± sd in the four FACS sorted populations in c (n = 3 replicates from one independent sorting experiment). Values compared to Q1, set as 1.0. f WB analysis of ISG15 protein expression in mitochondrial and cytosolic fraction from Panc185 Control or CRISPR-Cas9 ISG15-edited (ISG15CRISPR) CSCs (sph) and non-CSCs (adh). The membrane was additionally blotted for mitochondria OXPHOS complex proteins using the Mitoprofile Total OXPHOS antibody cocktail in addition to GAPDH (loading control). Shown are bands corresponding to Complex (C)V, CIII, CII, CIV, and CI. Total ISG15 expression [ISG15-conjugated and monomeric (mon-) proteins] for each sample was quantified by densitometric analysis and fold changes are shown, relative to control adherent (adh), set as 1.0 for both mitochondria and cytosolic fractions.
Fig. 3
Fig. 3. Loss of ISG15/ISGylation affects PaCSC functional properties.
a WB analysis of mon-ISG15 and ISG15-conjugated proteins after CRISPR-Cas9 ISG15 editing (CRISPR) in two different primary PDAC PDX cultures. Tubulin was used as loading control. b Proliferation of control and ISG15CRISPR Panc185 and Panc354 cells, graphed as mean cell numbers ± sd determined at the indicated days post seeding (n = 3 biologically independent samples). c Representative flow cytometry plots for CD133 expression in control and ISG15CRISPR Panc185 and Panc354 cells. d Mean percent of Hoechst non-retaining cells (i.e., side population) ± sd in control and ISG15CRISPR Panc185 and Panc354 cells (n = 3 biologically independent samples; *p = 0.0227; ****p < 0.0001, as determined by Student’s t-test). e Mean fold change ± sd of 1st, 2nd, and 3rd generation (gen) sphere formation capacity of control versus ISG15CRISPR cells (Panc185: n = 3 biologically independent samples; *p = 0.0230; **p = 0.0044; ns not significant, as determined by Student’s t-test; and Panc354: n = 3 biologically independent samples; *p = 0.0482; **p = 0.0090; ns, not significant, as determined by Student’s t-test). Control set as 1.0. f Images of tumors obtained after injection of 104 and 103 Panc185 control, ISG15CRISPR and ISG15Rescue (ISG15CRISPR + ISG15-V5-GFP, E1, E2, and E3 overexpression) (Rescue) cells. g WB analysis of mon-ISG15 and ISG15-conjugated proteins in freshly digested 104 tumors obtained from f. GAPDH was used as loading control. hi Average tumor weights ± sem (n = indicated in i; *p = 0.0172; ns, not significant, as determined by Student’s t-test; nd, not determined) (h) and total number of tumors obtained from control, ISG15CRISPR and ISG15Rescue injections from three independent in vivo ELDA animal experiments (i). CSCs frequencies were calculated using the Extreme Limiting Dilution Analysis software.
Fig. 4
Fig. 4. Loss of ISG15/ISGylation alters mitochondrial state and metabolism.
a Transmission electron micrographs of control and ISG15CRISPR Panc185 cells. Scale bars = 2 µM. b RTqPCR analysis of fold-change in mitochondrial DNA (mtDNA) gene 12s mean copies ± sd in control and ISG15CRISPR Panc185 and Panc354 cells. Data are normalized to β-Actin expression and control set as 1.0. (n = 3 biologically independent samples; ***p < 0.0001, as determined by Student’s t-test). c, d Representative histograms of flow cytometric analysis of NAO (10-N-Nonyl acridine orange) in control and ISG15CRISPR Panc185 and Panc354 cells c, and mean percentages ± sd in mitochondrial mass as a function of Mitotracker Green (MTR-G) and NAO (10-N-Nonyl acridine orange) staining d (Panc185: MTR-G n = 4 biologically independent samples **p = 0.0092 and NAO n = 8 biologically independent samples ***p < 0.001, as determined by Student’s t-test; and Panc354: MTR-G and NAO n = 3 biologically independent samples ***p < 0.001, as determined by Student’s t-test). e Representative histograms of Mitotracker CM-H2XRos in control and ISG15CRISPR Panc185 and Panc354 cells. f Representative plot of mean Oxygen Consumption Rate (OCR) levels ± sem, normalized to protein content, for control and ISG15CRISPR Panc185 cells, which were treated with O (oligomycin), F (FCCP), A (antimycinA) and R (rotenone) into culture medium. Continuous OCR values (pmoles/min/µg protein) are shown. g Measured and mean calculated parameters of OCR ± sem (n = 6 measurements per time point examined over five independent experiments; *p = 0.0148; **p = 0.0088; ***p < 0.001; *p = 0.0366; ns, not significant, as determined by Student’s t-test).
Fig. 5
Fig. 5. Loss of ISG15/ISGylation reduces mitophagy.
a Transmission electron micrographs of control and ISG15CRISPR Panc354 cells. Scale bars = 1 or 2 µM. b Immunofluorescent images of TOM-20 in control and ISG15CRISPR Panc354 cells. Nuclei stained with DAPI in blue. Scale bars = 10 µM. c Mitochondrial network from b displayed as a skeleton network using ImageJ skeleton filter. Scale bar = 10 µM. d Representative histograms of MTDR expression in control and ISG15CRISPR Panc185 and Panc354 cells after 6 h of treatment with CsA (5 µM) or without (Ctl). e Mean fold change in MTDR levels ± sd in control (Ctl)- and CsA-treated cultures (left) and mitophagic flux determined as the ratio of MTDR accumulation after CsA treatment compared to its respective control (right) in control and ISG15CRISPR Panc185 and Panc354 cells (Panc185: n = 4 biologically independent samples; **p = 0.0013; *p = 0.0191; *p = 0.0111, as determined by Student’s t-test; and Panc354: n = 4 biologically independent samples; ***p < 0.001; ns, not significant; **p = 0.0041, as determined by Student’s t-test). f Mean fold change in Keima protein fluorescence levels ± sem in control (red) and ISG15CRISPR (blue) Panc185 and Panc354 cells. Cells were untreated or treated with FCCP (16 µM), with or without co-treatment with the autophagy inhibitors CsA (5 µM), Bafilomycin (Baf; 150 nM) or Chloroquine (Chlq; 50 µM). Fluorescence in control-treated cells is set to 1.0. (n = 4 biologically independent samples for Panc185 and n = 3 biologically independent samples for Panc354; **p < 0.01; ***p < 0.001, ns, not significant, as determined by one-way ANOVA with Dunnett’s multiple comparison test). g Summary of average fold change in parkin levels ± sem, determined by flow cytometric analysis, in control and ISG15CRISPR Panc185 and Panc354 cells untreated (Ctl) or treated with FCCP (16 µM) plus CsA (5 µM) for 4 h (Panc185: n = 4 biologically independent samples; *p = 0.0283; **p = 0.0013, as determined by Student’s t-test; and Panc354: n = 4 biologically independent samples **p = 0.0084; ns, not significant, as determined by Student’s t-test).
Fig. 6
Fig. 6. Autophagosomes and autophagic flux increase in the absence of ISG15/ISGylation.
a Transmission electron micrographs of control and ISG15CRISPR Panc185 cells. Scale bars = 5 or 2 µM. b Immunofluorescent images of LC3B (red) and LAMP1 (green) in control and ISG15CRISPR Panc185 cells. Nuclei stained with DAPI in blue. Scale bar = 10 µM. c WB analysis of LC3B in control and ISG15CRISPR cultures untreated (Ctl) or treated with the autophagy inhibitor Bafilomycin (Baf) for 5 h. Tubulin was used as loading control. d Mean fold change ± sd in autophagic flux determined by densitometric quantification of LC3B-II accumulation after autophagy inhibitor addition, subtracting their respective control expression levels (Panc185: n = 4 independent experiments; *p = 0.0162, as determined by Student’s t-test; and Panc354: n = 3 independent experiments; *p = 0.0143, as determined by Student’s t-test).
Fig. 7
Fig. 7. Loss of ISG15/ISGylation prevents PaCSC metabolic plasticity.
a Quantification of the average percentage ± sd of cells in early apoptosis (Annexin-V + ), late apoptosis (Annexin-V + /DAPI + ) and dead (DAPI + ) from control and ISG15CRISPR sphere cultures after 3 days of treatment with Bafilomycin (1 nM, Baf, B) and/or Metformin (10 µM, MET, M) (n = 3 biologically independent samples; *p < 0.05; **p < 0.01; ***p < 0.001, as determined by Student’s t-test). b Experimental set-up for in vivo experiments using subcutaneously implanted control and ISG15CRISPR tumors (xenografts) and treatment with Metformin (MET). c WB analysis of mon-ISG15 and ISG15-conjugated proteins in freshly digested donor tumors obtained from control and ISG15CRISPR injected cells, used for tumor implantations in b. d Average fold change in tumor volume ± sem in control and ISG15CRISPR xenografts with or without Metformin (MET) treatment over the course of 42 days (n = 6 tumors/group examined over two independent in vivo animal experiments; ***p < 0.001; ns, not significant, as determined by Student’s t-test). e Average tumor weights ± sem obtained at sacrifice from d (**p = 0.0099; ns, not significant, as determined by Student’s t-test). f Representative images of tumors at the end of the experiment.

References

    1. Rahib L, et al. Projecting cancer incidence and deaths to 2030: the unexpected burden of thyroid, liver, and pancreas cancers in the United States. Cancer Res. 2014;74:2913–2921. - PubMed
    1. Hidalgo M, et al. Addressing the challenges of pancreatic cancer: future directions for improving outcomes. Pancreatology. 2015;15:8–18. - PubMed
    1. Ko AH. Progress in the treatment of metastatic pancreatic cancer and the search for next opportunities. J. Clin. Oncol. 2015;33:1779–1786. - PubMed
    1. Valle S, Martin-Hijano L, Alcala S, Alonso-Nocelo M, Jr. Sainz B. The ever-evolving concept of the cancer stem cell in pancreatic cancer. Cancers. 2018;10:E33. - PMC - PubMed
    1. de Sousa e Melo F, et al. A distinct role for Lgr5(+) stem cells in primary and metastatic colon cancer. Nature. 2017;543:676–680. - PubMed

Publication types

MeSH terms