. 2020 May 29;10(1):8798.
doi: 10.1038/s41598-020-65643-4.

Station and train surface microbiomes of Mexico City's metro (subway/underground)

Affiliations

Station and train surface microbiomes of Mexico City's metro (subway/underground)

Apolinar Misael Hernández et al. Sci Rep. .

Abstract

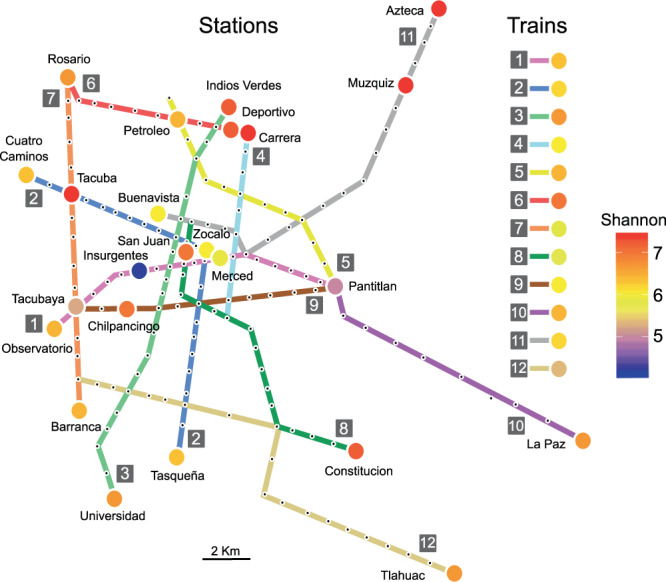
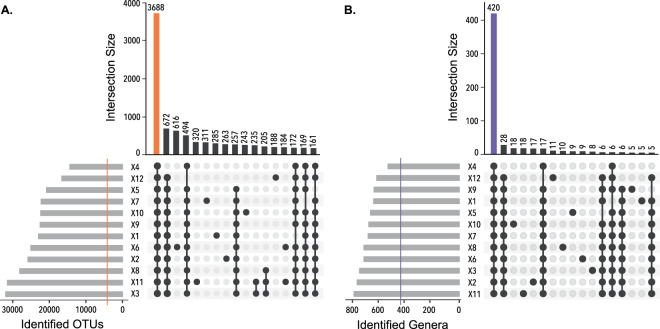
The metro is one of the more representative urban transportation systems of Mexico City, and it transports approximately 4.5 million commuters every day. Large crowds promote the exchange of microbes between humans. In this study, we determined the bacterial diversity profile of the Mexico City metro by massive sequencing of the 16S rRNA gene. We identified a total of 50,174 operational taxonomic units (OTUs) and 1058 genera. The metro microbiome was dominated by the phylum Actinobacteria and by the genera Cutibacterium (15%) (C. acnes 13%), Corynebacterium (13%), Streptococcus (9%), and Staphylococcus (5%) (S. epidermidis; 4%), reflecting the microbe composition of healthy human skin. The metro likely microbial sources were skin, dust, saliva, and vaginal, with no fecal contribution detected. A total of 420 bacterial genera were universal to the twelve metro lines tested, and those genera contributed to 99.10% of the abundance. The annual 1.6 billion ridership makes this public transport a main hub for microbe-host-environment interactions. Finally, this study shows that the microbial composition of the Mexico City metro comes from a mixture of environmental and human sources and that commuters are exposed to healthy composition of the human microbiota.


Conflict of interest statement

The authors declare no competing interests.

Figures

Figure 1
Figure 1
Sampling diversity and location. The metro network, with each black dot representing a station and colored circles showing the sampling locations. The circles are colored according to the Shannon diversity index. Train diversity is also shown in colored circles.
Figure 2
Figure 2
OTUs richness and diversity of Mexico City’s metro. The surface microbiome diversity on the station entrance and the metro train. A total of 50,174 OTUs were observed, across 47 samples (*p < 0.05, **p < 0.01, Kruskal-Wallis test).
Figure 3
Figure 3
Shared taxa between metro lines. All the train and station samples are merged into its source metro line. The histogram shows the number of shared elements for each intersection sets. The plots are ordered from higher to lower cardinal numbers. (A) Shared OTUs: of the 50,174 OTUs, 3,688 were found in all lines. (B) Shared genera: of 1,058 genera, 420 were found in all lines. The 420 genera represented 99.10% of the entire dataset. The gray bars show the number of taxa identified for each subway line. Sets smaller than 150 elements for OTUs, and sets smaller than 5 elements for genera, were excluded from the diagrams.
Figure 4
Figure 4
Phylogenetic profile of Mexico City’s metro surfaces. (A) Phylum abundance in all samples: Actinobacteria was the most abundant phylum followed by Firmicutes and Proteobacteria. (B) Genus abundance: Cutibacterium was the most abundant genus. (C) Heatmap of the 30 most abundant taxa, and their abundance in each sampled metro line. The unknown genera were classified into the higher known taxonomic rank, shown in different text colors. The asterisk indicates plants.
Figure 5
Figure 5
Metro bacterial communities grouped into the sample types collected in this study: for train and station. (A) Community distances dendrogram using unweighted UniFrac distances. (B) Constrained analysis of principal coordinates (CAP) ordinations based on unweighted UniFrac distances for turnstiles and handrails at the OTU level. Significantly segregated (p = 0.001, Adonis) ellipses denote the 95% confidence interval of the points distribution by the station and train samples sample type.
Figure 6
Figure 6
Source tracking comparison between stations and train microbiota. A source tracker algorithm was used to identify microbes to the genus level, using dust, soil, saliva, skin, feces, and vaginal samples as potential sources (***p < 0.001, Student’s t-test). Dots in the figure represent outliers from the boxplot quartiles.

References

    1. International Association of Public Transport. World Metro Figures 2018, http://www.uitp.org/world-metro-figures-2018 (2018).
    1. Casado Izquierdo JM. Patrones horarios de la movilidad cotidiana en la Zona Metropolitana del Valle de México. Scr. Nova. Rev. Electrónica Geogr. y Ciencias Soc. 2014;18:487.
    1. Walker AR, Grimes TL, Datta S, Datta S. Unraveling bacterial fingerprints of city subways from microbiome 16S gene profiles. Biol. Direct. 2018;13:1–16. - PMC - PubMed
    1. Hsu T, et al. Urban transit system microbial communities differ by surface type and interaction with humans and the environment. mSystems. 2016;1:1–18. - PMC - PubMed
    1. Afshinnekoo E, et al. Geospatial resolution of human and bacterial diversity with city-scale metagenomics. Cell Syst. 2015;1:72–87. - PMC - PubMed

Publication types