. 2021 Feb;35(2):454-467.
doi: 10.1038/s41375-020-0880-3. Epub 2020 May 29.

Neoplastic fibrocytes play an essential role in bone marrow fibrosis in Jak2V617F-induced primary myelofibrosis mice

Affiliations

Neoplastic fibrocytes play an essential role in bone marrow fibrosis in Jak2V617F-induced primary myelofibrosis mice

Yoshinori Ozono et al. Leukemia. 2021 Feb.

Abstract

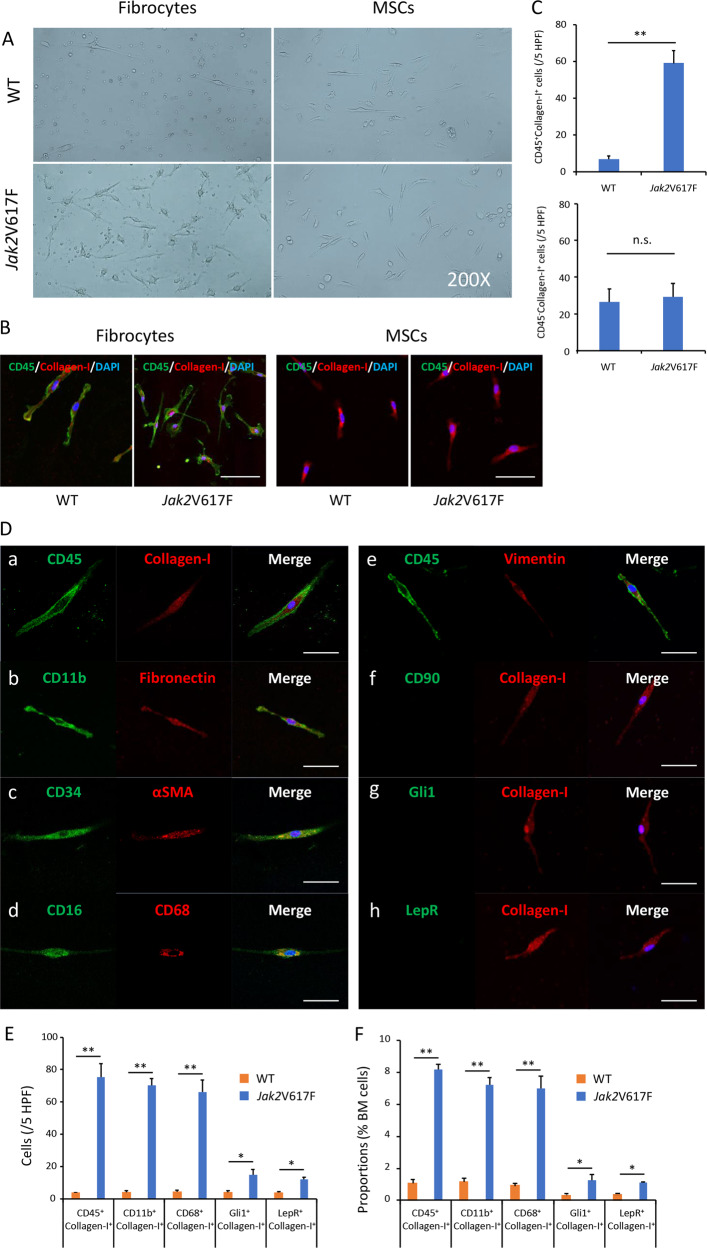
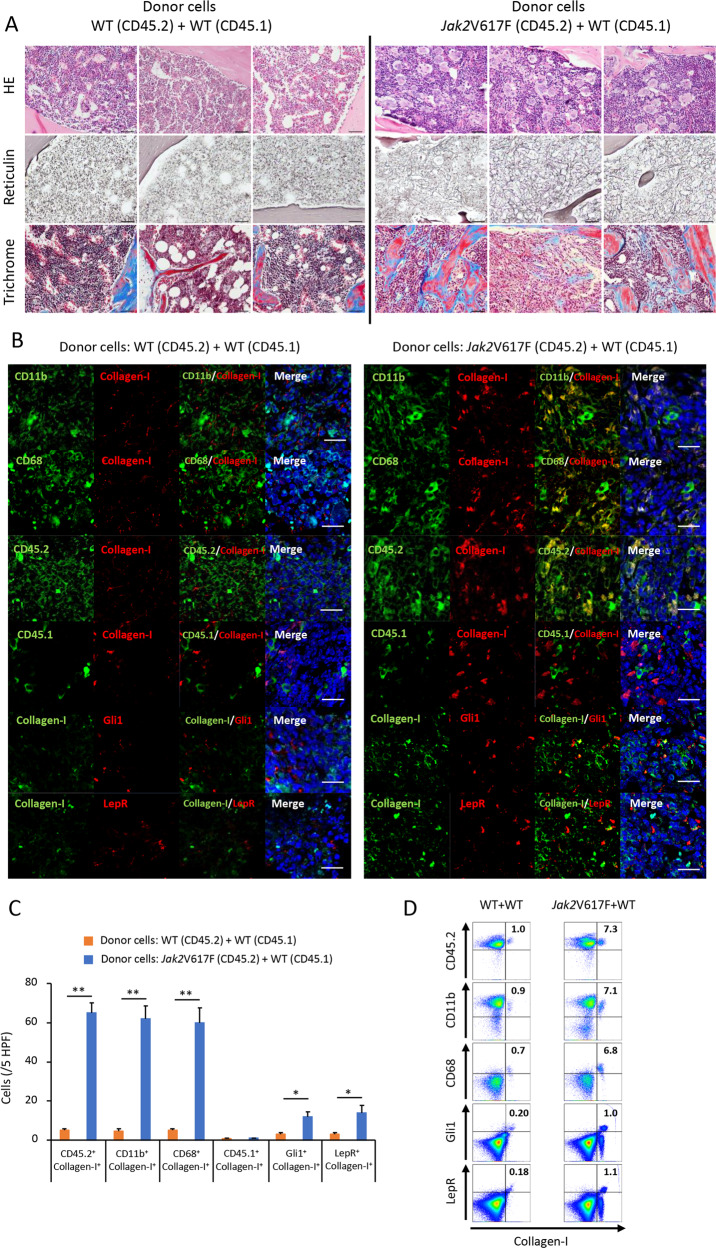
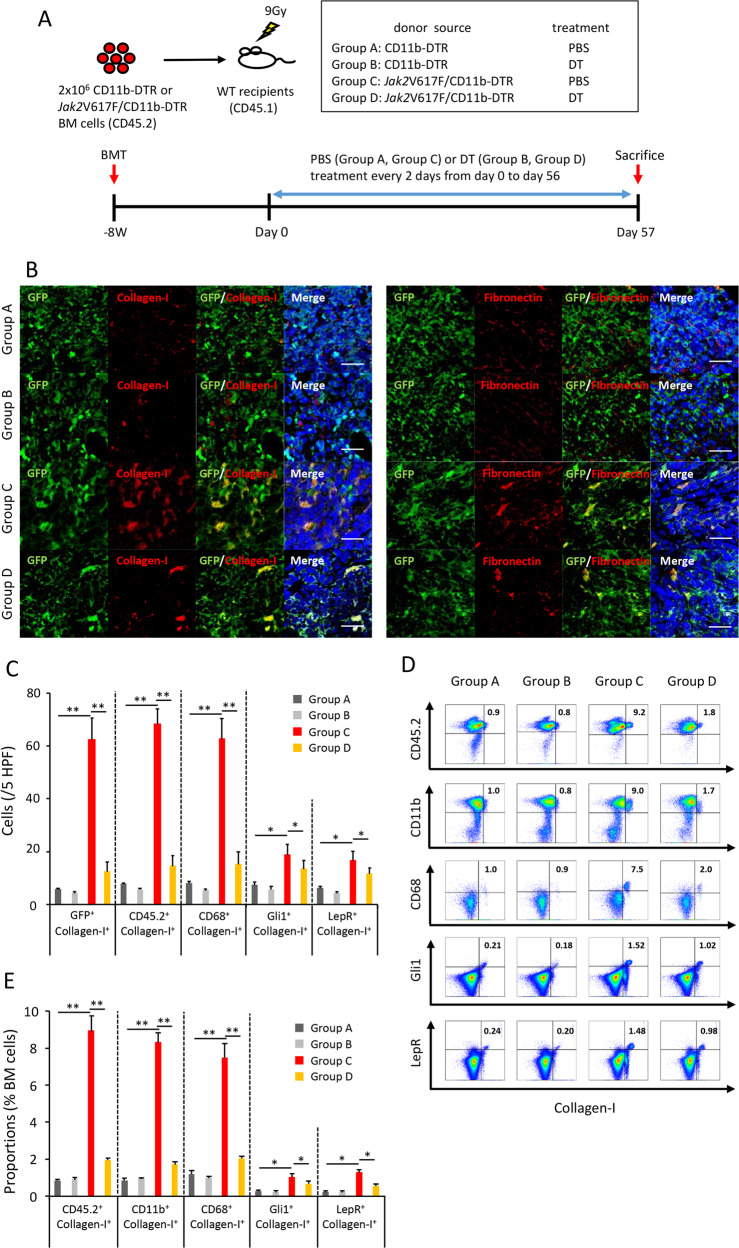
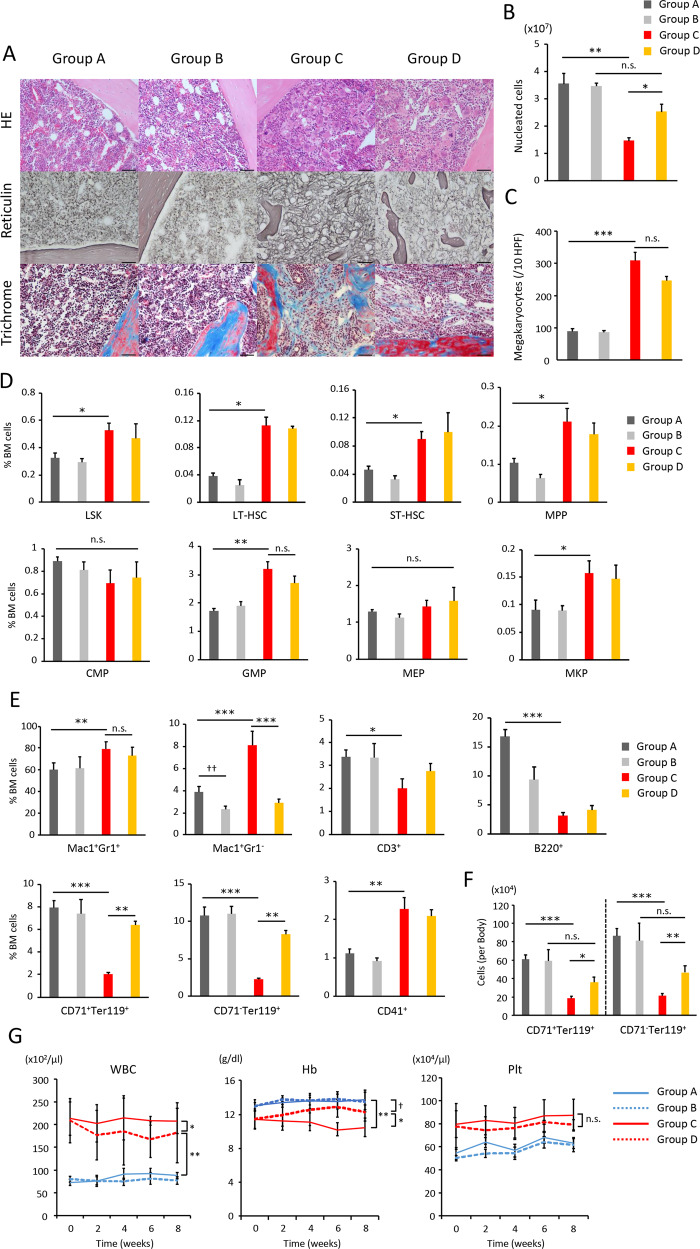
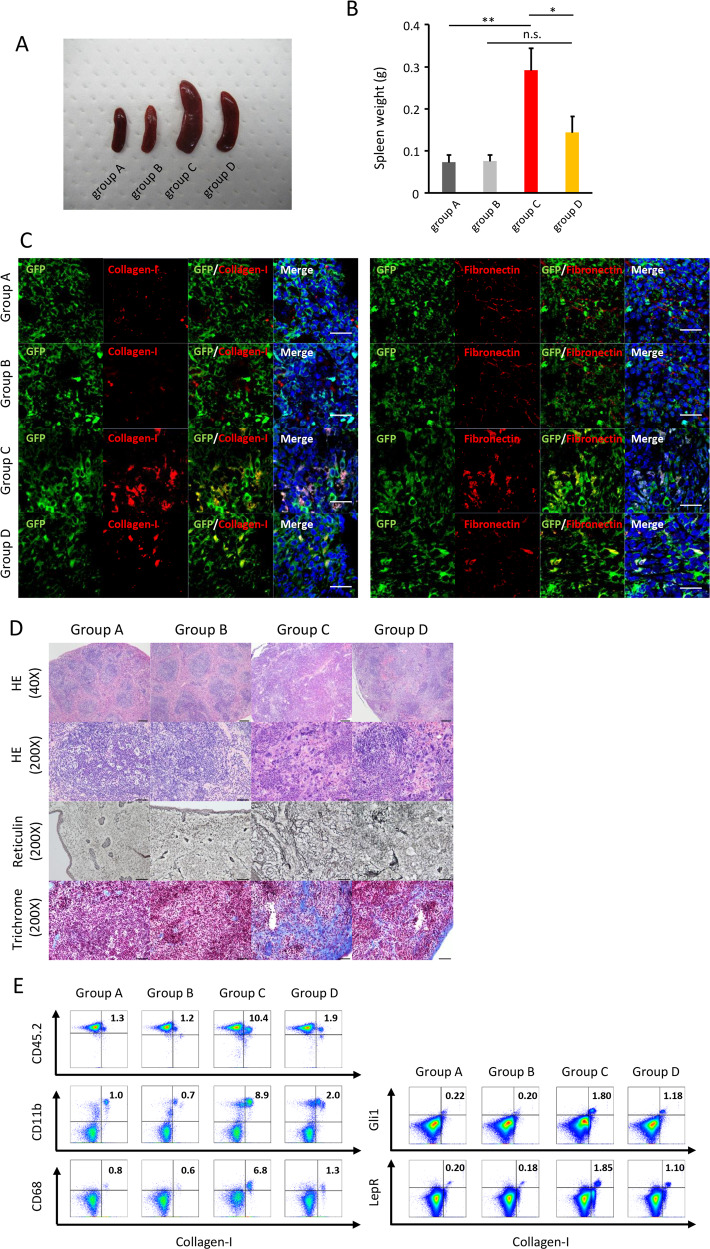
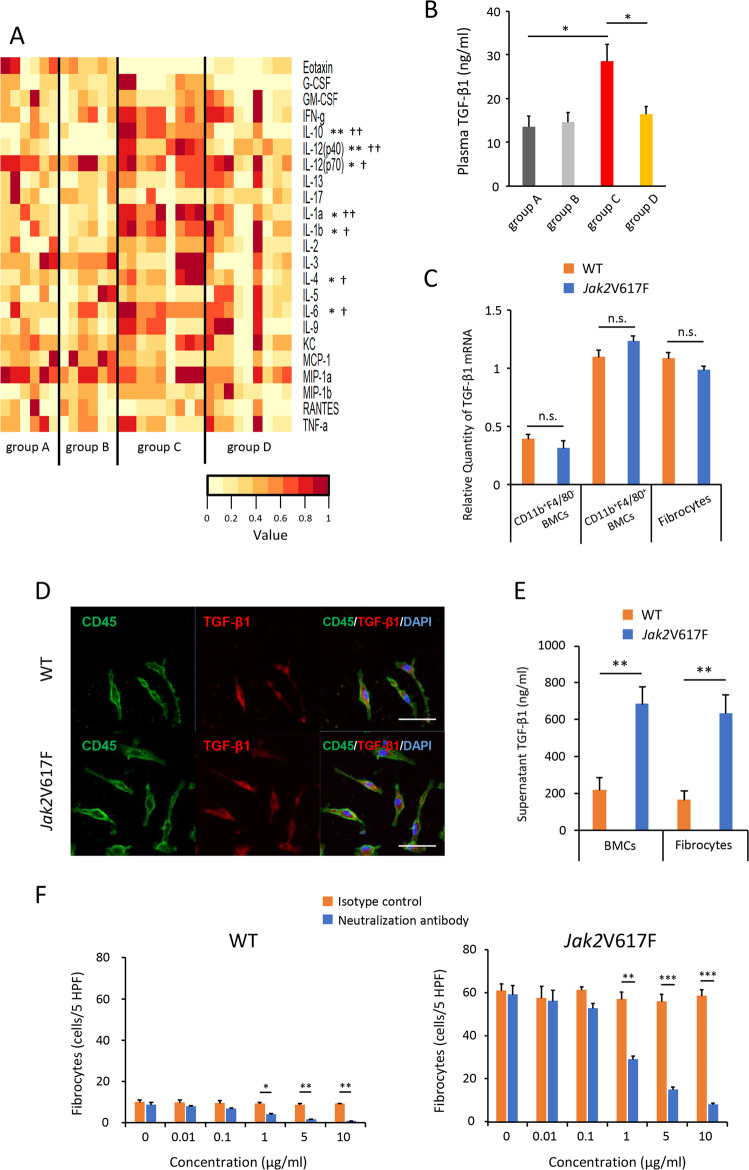
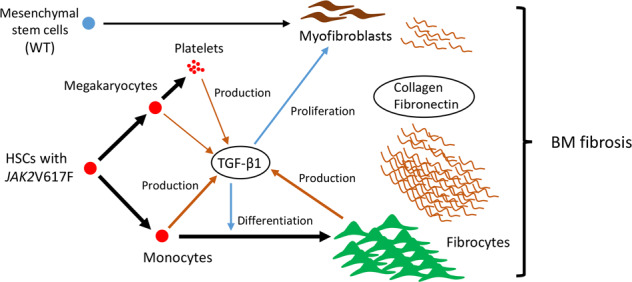
Primary myelofibrosis (PMF) is a myeloproliferative neoplasm (MPN) characterized by clonal myeloproliferation, progressive bone marrow (BM) fibrosis, splenomegaly, and anemia. BM fibrosis was previously thought to be a reactive phenomenon induced by mesenchymal stromal cells that are stimulated by the overproduction of cytokines such as transforming growth factor (TGF)-β1. However, the involvement of neoplastic fibrocytes in BM fibrosis was recently reported. In this study, we showed that the vast majority of collagen- and fibronectin-producing cells in the BM and spleens of Jak2V617F-induced myelofibrosis (MF) mice were fibrocytes derived from neoplastic hematopoietic cells. Neoplastic monocyte depletion eliminated collagen- and fibronectin-producing fibrocytes in BM and spleen, and ameliorated most characteristic MF features in Jak2V617F transgenic mice, including BM fibrosis, anemia, and splenomegaly, while had little effect on the elevated numbers of megakaryocytes and stem cells in BM, and leukothrombocytosis in peripheral blood. TGF-β1, which was produced by hematopoietic cells including fibrocytes, promoted the differentiation of neoplastic monocytes to fibrocytes, and elevated plasma TGF-β1 levels were normalized by monocyte depletion. Collectively, our data suggest that neoplastic fibrocytes are the major contributor to BM fibrosis in PMF, and TGF-β1 is required for their differentiation.


Conflict of interest statement

The authors declare that they have no conflict of interest.

Figures

Fig. 1
Fig. 1. Morphology of fibrocytes derived from BM of Jak2V617F and WT mice.
a Phase-contrast micrographs of cultured BM MNCs from WT (top) and Jak2V617F (bottom) mice in conditions that promote differentiation of monocytes to fibrocytes (left) or that support MSCs proliferation (right). Representative images are presented from 24 wells of cultured BM MNCs from three mice of each type. b Spindle-shaped cells in BM MNCs that were cultured in conditions that promote differentiation to fibrocytes were CD45+Collagen-I+, whereas spindle-shaped cells in BM MNCs that were cultured in conditions that support MSC proliferation are CD45Collagen-I+ by immunofluorescence imaging. Bars: 50 μm. c The number of CD45+Collagen-I+ or CD45Collagen-I+ cells per five random high-powered fields (HPFs) in BM MNCs from WT and Jak2V617F TG mice (n = 3 in each group) that were cultured in conditions that promote differentiation to fibrocytes or that support MSCs proliferation, respectively. d Representative immunofluorescence imaging of spindle-shaped cells cultured from BM MNCs of Jak2V617F mice in conditions that promote differentiation of monocytes to fibrocytes. DAPI staining is shown in blue (merge). Bars: 50 μm. (a) Costaining for CD45 and Collagen-I. (b) Costaining for CD11b and fibronectin. (c) Costaining for CD34 and αSMA. (d) Costaining for CD16 and CD68. (e) Costaining for CD45 and vimentin. (f) Costaining for CD90 and Collagen-I. (g) Costaining for Gli1 and Collagen-I. (h) Costaining for LepR and Collagen-I. e The number of CD45+ Collagen-I+, CD11b+ Collagen-I+, and CD68+ Collagen-I+ fibrocytes and Gli1+Collagen-I+ and LepR+Collagen-I+ myofibroblasts in five random HPFs from BM of WT mice (n = 3) and Jak2V617F TG mice (n = 3) by immunofluorescence analysis. f The proportion of CD45+ Collagen-I+, CD11b+Collagen-I+, and CD68+Collagen-I+fibrocytes and Gli1+Collagen-I+ and LepR+Collagen-I+ myofibroblasts in BMCs of WT and Jak2V617F TG mice by FACS analysis (n = 5 in each group). Data are expressed as means ± SEM. The two-tailed student's t test was used (c, e, f). **P < 0.01, *P < 0.05. n.s. not significant. The representative result is shown in three independent experiments (a, b, d).
Fig. 2
Fig. 2. Increased numbers of neoplastic fibrocytes in BM from recipient mice transplanted with a mixture of Jak2V617F BMCs and WT BMCs.
a Hematoxylin and eosin (HE), reticulin silver, and Masson trichrome staining of BM sections from recipient mice transplanted with a mixture of Jak2V617F BMCs and WT BMCs in a 5:1 ratio (n = 3), and those transplanted with a mixture of WT BMCs and WT BMCs (n = 3). Images from all six mice are presented. Bars: 50 μm. b Immunofluorescence imaging of BM sections from recipient mice (CD45.1) transplanted with the mixture of Jak2V617F BMCs (CD45.2) plus WT BMCs (CD45.1) (right) and recipient mice (CD45.1) transplanted with the mixture of WT BMCs (CD45.2) plus WT BMCs (CD45.1) (left). DAPI staining is shown in blue (merge). Bars: 20 μm. The representative result is shown in three independent experiments. c The numbers of cells with the following characteristics: neoplastic fibrocytes positive for CD45.2/Collagen-I, CD11b/Collagen-I, and CD68/Collagen-I; WT fibrocytes positive for CD45.1/Collagen-I; and myofibroblasts positive for Gli1/Collagen-I and LepR/Collagen-I. Cell numbers are presented as the average of five random HPFs from three mice of each type. Data are expressed as means ± SEM. The two-tailed student’s t test was used. **P < 0.01. *P < 0.05. d Representative plots of FACS analysis of CD45.2+Collagen-I+, CD11b+Collagen-I+, and CD68+Collagen-I+fibrocytes, and Gli1+Collagen-I+ and LepR+Collagen-I+ myofibroblasts in BMCs isolated from recipient mice (CD45.1) transplanted with the mixture of Jak2V617F BMCs (CD45.2) plus WT BMCs (CD45.1) and recipient mice (CD45.1) transplanted with the mixture of WT BMCs (CD45.2) plus WT BMCs (CD45.1). The reproducibility was confirmed by five experiments.
Fig. 3
Fig. 3. Monocyte depletion reduces the number of neoplastic fibrocytes in BM from recipient mice transplanted with Jak2V617F BMCs.
a Outline of experimental design. BMCs from CD11b-DTR TG (groups A, B) or Jak2V617F/CD11b-DTR TG (groups C, D) were transplanted into lethally irradiated recipient mice (n = 12 in group A and C, n = 14 in group B and D). GFP was expressed under the CD11b promoter. After 8 weeks, treatment with PBS (groups A, C) or DT (groups B, D) was performed every 2 days for 8 weeks. b Immunofluorescence imaging of BM sections from each group of recipient mice (n = 3 in each group). DAPI staining is shown in blue (merge). Bars: 20 μm. The representative result is shown in three independent experiments. c The number of GFP+Collagen-I+, CD45.2+Collagen-I+, and CD68+Collagen-I+fibrocytes, and Gli1+Collagen-I+ and LepR+Collagen-I+ myofibroblasts in BM. Cell numbers are presented as the average of five random HPFs (n = 3 in each group). d Representative plots of FACS analysis of collagen-producing cells (same as Fig. 2d) in BMCs from each recipient mouse group after 8-week PBS or DT treatment. The reproducibility was confirmed by six experiments. e The proportion of fibrocytes and myofibroblasts in recipient mice transplanted with CD11b-DTR BMCs or Jak2V617F/CD11b-DTR BMCs (n = 6 in group A and B, n = 8 in group C and D). Data are expressed as means ± SEM. One-way ANOVA followed by the Tukey–Kramer test was used (c, e). **P < 0.01, *P < 0.05.
Fig. 4
Fig. 4. Monocyte depletion ameliorates BM fibrosis and anemia in mice transplanted with Jak2V617F BMCs.
a Representative images of HE, reticulin silver, and Masson trichrome staining of BM sections from recipient mice transplanted with Jak2V617F/CD11b-DTR BMCs and those transplanted with CD11b-DTR BMCs (n = 3 in each group). Bars: (HE) 50 μm; (reticulin) 50 μm; (trichrome) 50 μm. b The total numbers of BM nucleated cells in one femur and one tibia. c The number of megakaryocytes is presented as the average of 10 random HPFs from three mice of each type. d The proportion of LSKs (LinSca-1+ c-Kit+), long-term HSCs (CD150+48LinSca-1+c-Kit+), short-term HSCs (CD15048LinSca-1+c-Kit+), MPPs (CD15048+LinSca-1+c-Kit+), CMPs (IL-7RαLinc-Kit+Sca-1FcγRloCD34+), GMPs (IL-7RαLinc-Kit+Sca-1FcγR+CD34+), MEPs (IL-7RαLinc-Kit+Sca-1FcγRloCD34), and MKPs (CD9+CD41+FcγRloc-kit+Lin) in BMCs was analyzed by flow cytometry. e FACS analysis of Mac1+Gr1+ granulocytes, Mac1+Gr1 monocytes, CD3+ T cells, B220+ B cells, CD71+Ter119+ early erythroblasts, CD71Ter119+ late erythroblasts, and CD41+ megakaryocytes in BM. f The absolute number of CD71+Ter119+ early erythroblasts and, CD71Ter119+ late erythroblasts per mouse. Six mice were analyzed in group A and B, and eight mice were analyzed in group C and D (b, df). Data are expressed as means ± SEM. One-way ANOVA followed by the Tukey–Kramer test was used (bf). ***P < 0.001, **P < 0.01, *P < 0.05, ☨☨P < 0.01. n.s. not significant. g Peripheral blood counts in each group (n = 12 in group A and C, n = 14 in group B and D) during 8-week treatment with PBS or DT. Data are expressed as means ± SEM. ANOVA with repeated measures was used. **P < 0.01, *P < 0.05, P < 0.05. n.s. not significant.
Fig. 5
Fig. 5. Monocyte depletion ameliorates splenic fibrosis and splenomegaly in mice transplanted with BMCs from Jak2V617F TG.
a Representative spleens from 8-week PBS-treated recipient mice transplanted with CD11b-DTR BMCs (Group A), 8-week DT-treated recipient mice transplanted with CD11b-DTR BMCs (Group B), 8-week PBS-treated Jak2V617F/CD11b-DTR BMCs (Group C), and 8-week DT-treated Jak2V617F/CD11b-DTR BMCs (Group D). b Spleen weight after 8-week PBS or DT treatment (n = 6 in group A and B, n = 8 in group C and D). Data are expressed as means ± SEM. One-way ANOVA followed by the Tukey–Kramer test was used. **P < 0.01, *P < 0.05. n.s. not significant. c Immunofluorescence imaging of spleen sections from each group of recipient mice. The representative result is shown in three independent experiments. GFP was expressed under the CD11b promoter. DAPI staining is shown in blue (merge). Bars: 20 μm. d Representative imaging with HE, reticulin silver, and Masson trichrome stains of spleen sections from each group of mice (n = 3 in each group). Bars: (HE) 200 µm (top) and 50 µm (second column), (reticulin, trichrome) 50 μm. e Representative plots of FACS analysis of CD45.2+Collagen-I+, CD11b+Collagen-I+, and CD68+Collagen-I+ fibrocytes, and Gli1+Collagen-I+ and LepR+Collagen-I+ myofibroblasts in spleen cells isolated from each recipient mouse after 8-week PBS or DT treatment. The reproducibility was confirmed by six experiments.
Fig. 6
Fig. 6. Fibrocytes produce multiple cytokines, including TGF-β1.
a Heat maps comparing cytokines levels in plasma isolated from recipient mice transplanted with Jak2V617F/CD11b-DTR BMCs and those transplanted with CD11b-DTR BMCs. Six samples in groups A and B, and nine samples in groups C and D were used. A color gradient from white (low levels) to brown (high levels) is shown. One-way ANOVA followed by the Tukey–Kramer test was used. **P < 0.01 and *P < 0.05 (group A vs group C). ☨☨P < 0.01 and P < 0.05 (group C vs group D). b Plasma TGF-β1 levels are shown for each experimental group (n = 6 in group A and B, n = 8 in group C and D). Data are expressed as means ± SEM. One-way ANOVA followed by the Tukey–Kramer test was used. *P < 0.05. c Quantitative RT-PCR for TGF-β1 in CD11b+F4/80 BMCs, CD11b+F4/80+ BMCs, and cultured fibrocytes from Jak2V617F TG and WT mice. The reproducibility was confirmed by two experiments. d Representative immunofluorescence imaging of cultured fibrocytes from BM MNCs of WT mice (top) and Jak2V617F TG (bottom). Bars: 50 μm. e Supernatants TGF-β1 levels secreted from 2-day-cultured BMCs and fibrocytes are shown. The reproducibility was confirmed by two experiments. f The inhibitory effect of TGF-β1-neutralizing antibodies on neoplastic fibrocyte growth. TGF-β1-neutralizing antibodies or isotype control were added in the culture of BM MNCs from WT (left) and Jak2V617F TG mice (right) mice in conditions that promote differentiation of monocytes to fibrocytes at the beginning of culture. The reproducibility was confirmed by two experiments. Data are expressed as means ± SEM, and the two-tailed student’s t test was used (c, e, f). ***P < 0.001, **P < 0.01, *P < 0.05. n.s. not significant.
Fig. 7
Fig. 7. The mechanism of fibrosis in PMF (schematic diagram).
TGF-β1 is produced by not only megakaryocytes and platelets but also monocytes and fibrocytes. While TGF-β1 promotes the proliferation of wild-type myofibroblast, it strongly promotes the differentiation of neoplastic monocytes having JAK2V617F mutation into fibrocytes. The proportion of neoplastic fibrocyte in collagen- and fibronectin-producing cells is much higher than that of wild-type myofibroblast.

Similar articles

Cited by

References

    1. Swerdlow SH, Campo E, Harris NL, Jaffe ES, Pileri SA, Stein H, et al. WHO classification of tumours of haematopoietic and lymphoid tissues. 4th ed. Lyon: International Agency for Research on Cancer; 2017. pp. 39–53.
    1. Geyer HL, Emanuel RM, Dueck AC, Kiladjian JJ, Xiao Z, Slot S, et al. Distinct clustering of symptomatic burden amongst myeloproliferative neoplasm patients: retrospective assessment in 1470 patients. Blood. 2014;123:3803–10. doi: 10.1182/blood-2013-09-527903. - DOI - PMC - PubMed
    1. Jacobson RJ, Salo A, Fialkow PJ. Agnogenic myeloid metaplasia: a clonal proliferation of hematopoietic stem cells with secondary myelofibrosis. Blood. 1978;51:189–94. doi: 10.1182/blood.V51.2.189.189. - DOI - PubMed
    1. Rampal R, Al-Shahrour F, Abdel-Wahab O, Patel JP, Brunel JP, Mermel CH, et al. Integrated genomic analysis illustrates the central role of JAK-STAT pathway activation in myeloproliferative neoplasm pathogenesis. Blood. 2014;123:e123–33. doi: 10.1182/blood-2014-02-554634. - DOI - PMC - PubMed
    1. Verstovsek S, Mesa RA, Gotlib J, Levy RS, Gupta V, DiPersio JF, et al. A double-blind, placebo-controlled trial of ruxolitinib for myelofibrosis. N Engl J Med. 2012;366:799–807. doi: 10.1056/NEJMoa1110557. - DOI - PMC - PubMed

Publication types