. 2020 Jun;26(6):909-918.
doi: 10.1038/s41591-020-0839-y. Epub 2020 May 29.

Interplay of somatic alterations and immune infiltration modulates response to PD-1 blockade in advanced clear cell renal cell carcinoma

Affiliations

Interplay of somatic alterations and immune infiltration modulates response to PD-1 blockade in advanced clear cell renal cell carcinoma

David A Braun et al. Nat Med. 2020 Jun.

Abstract

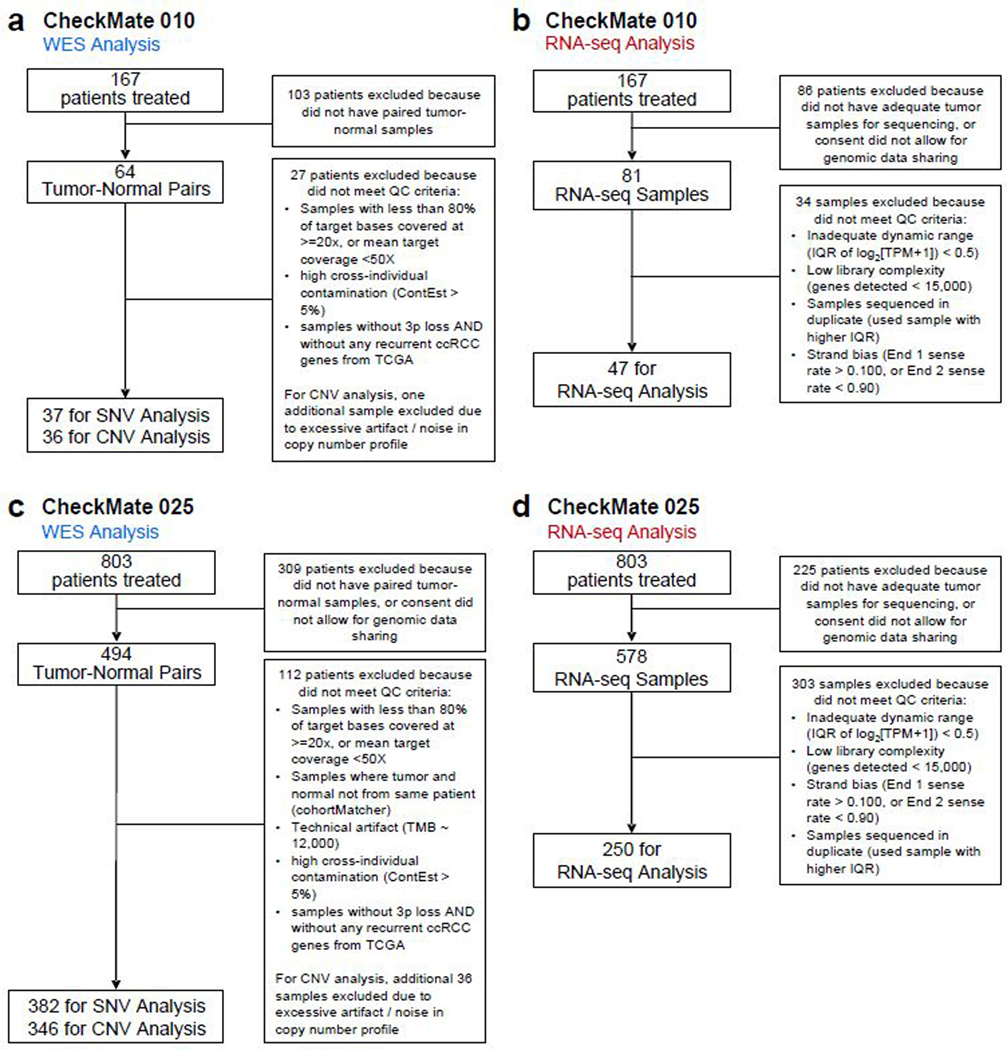
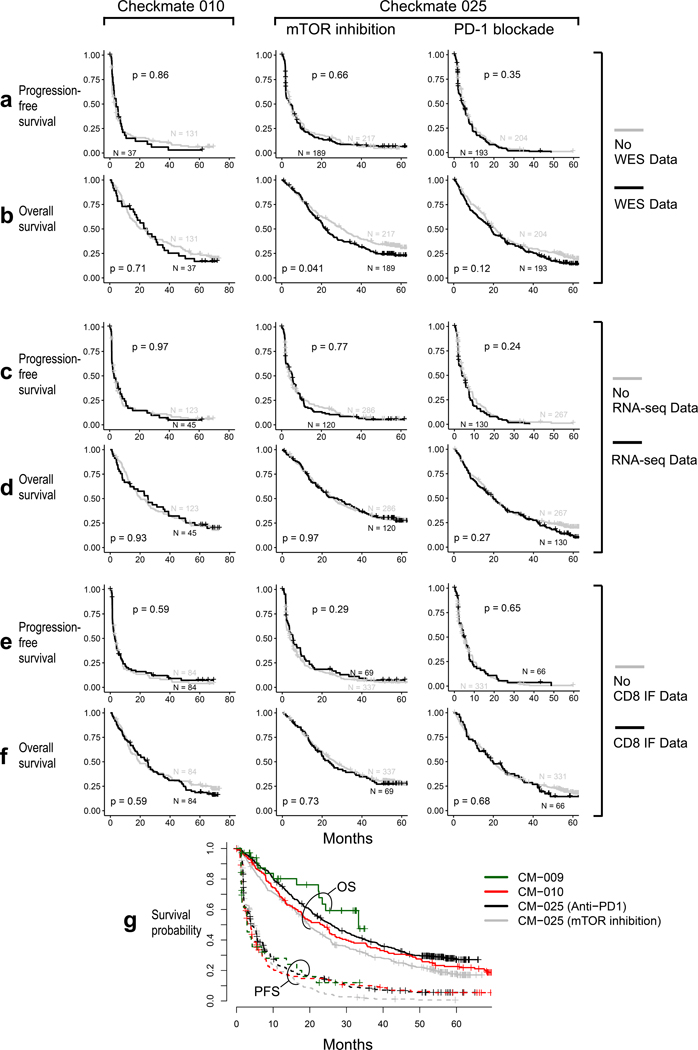
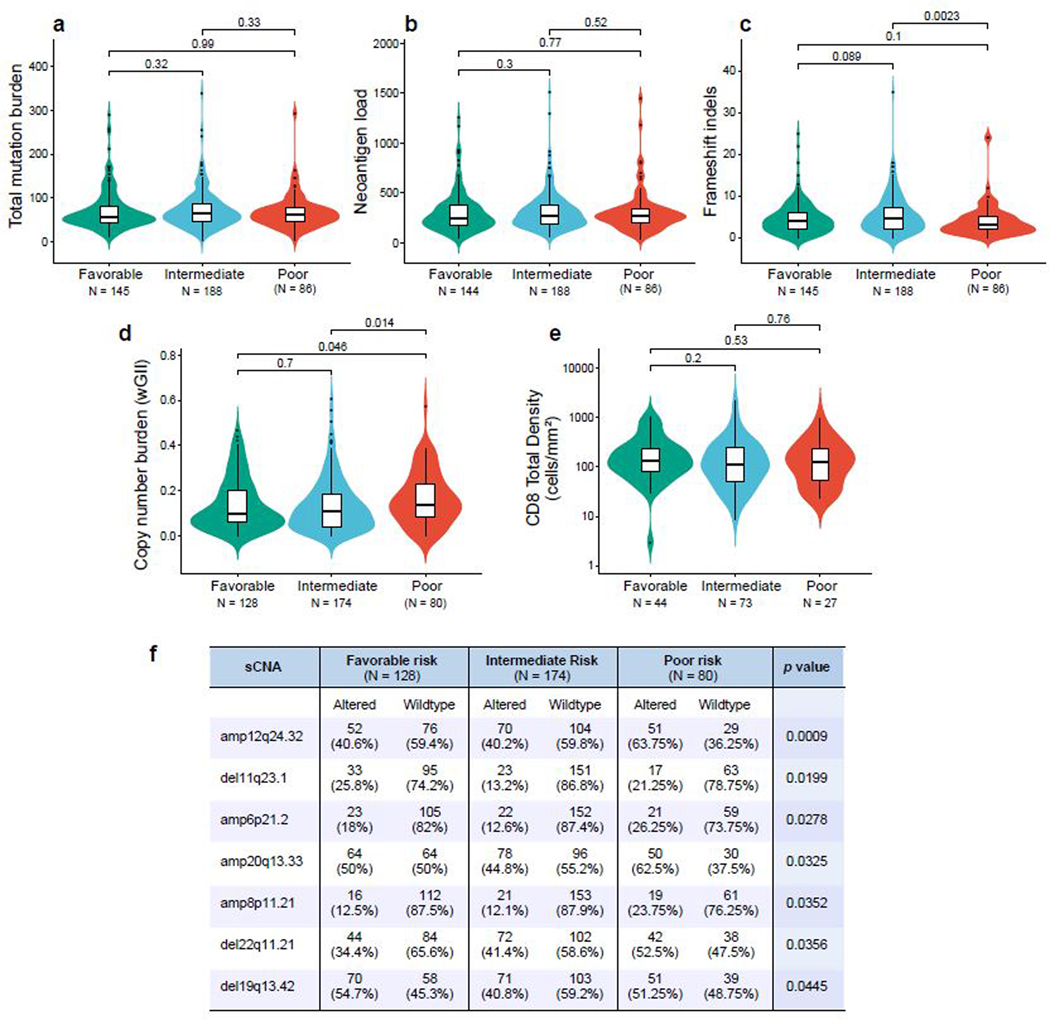
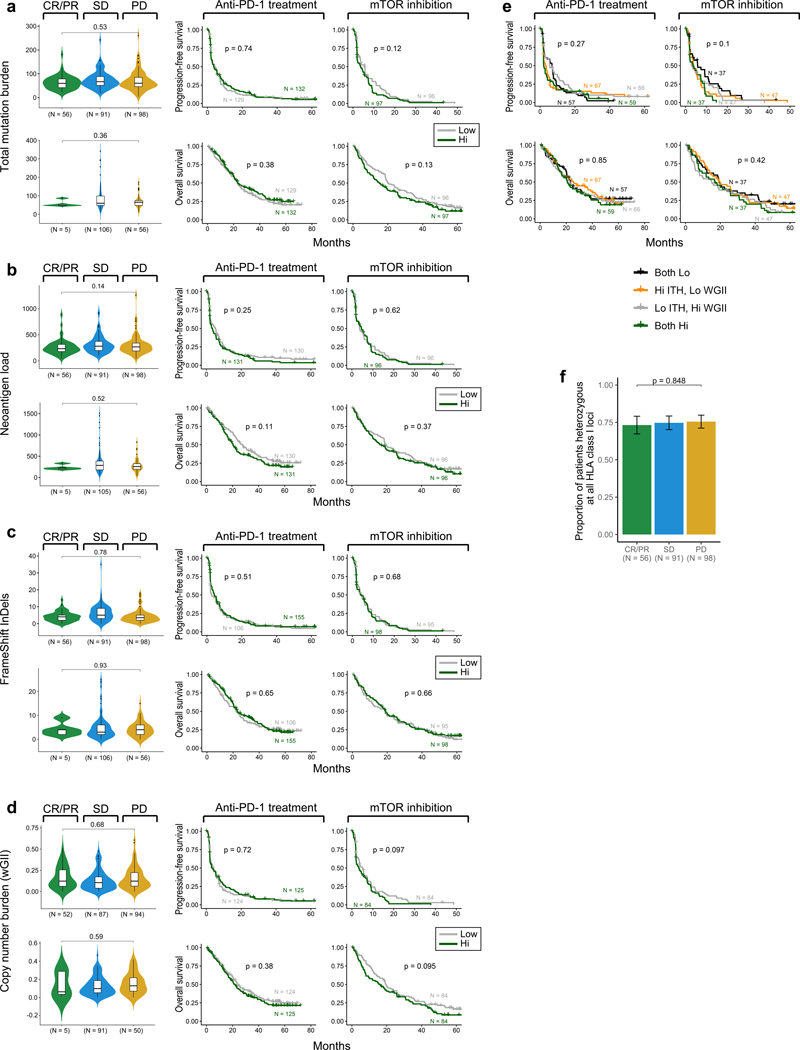
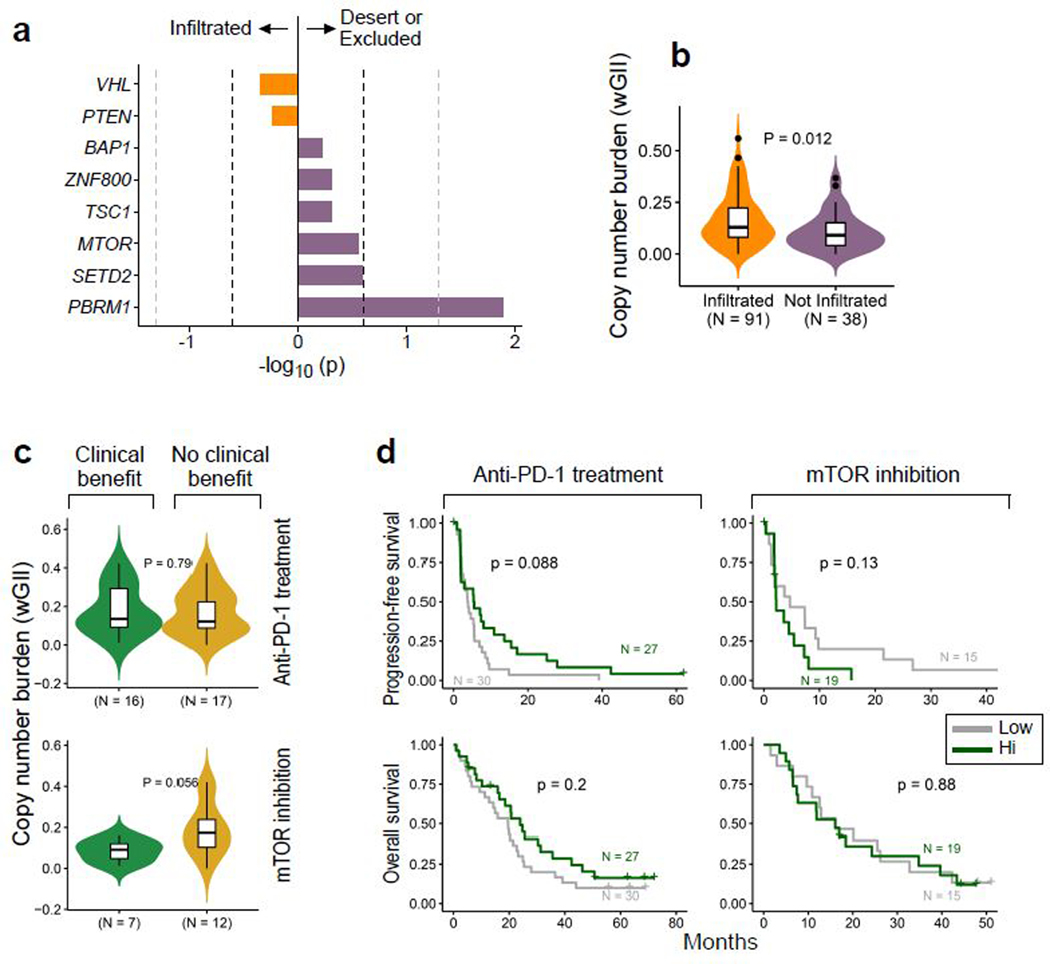
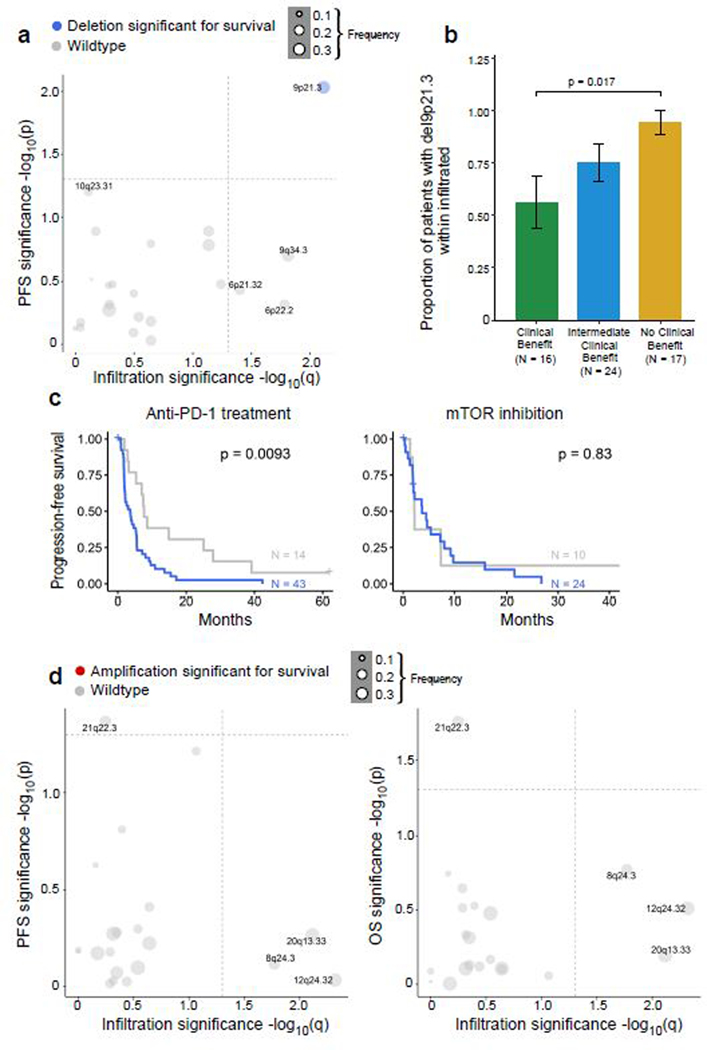
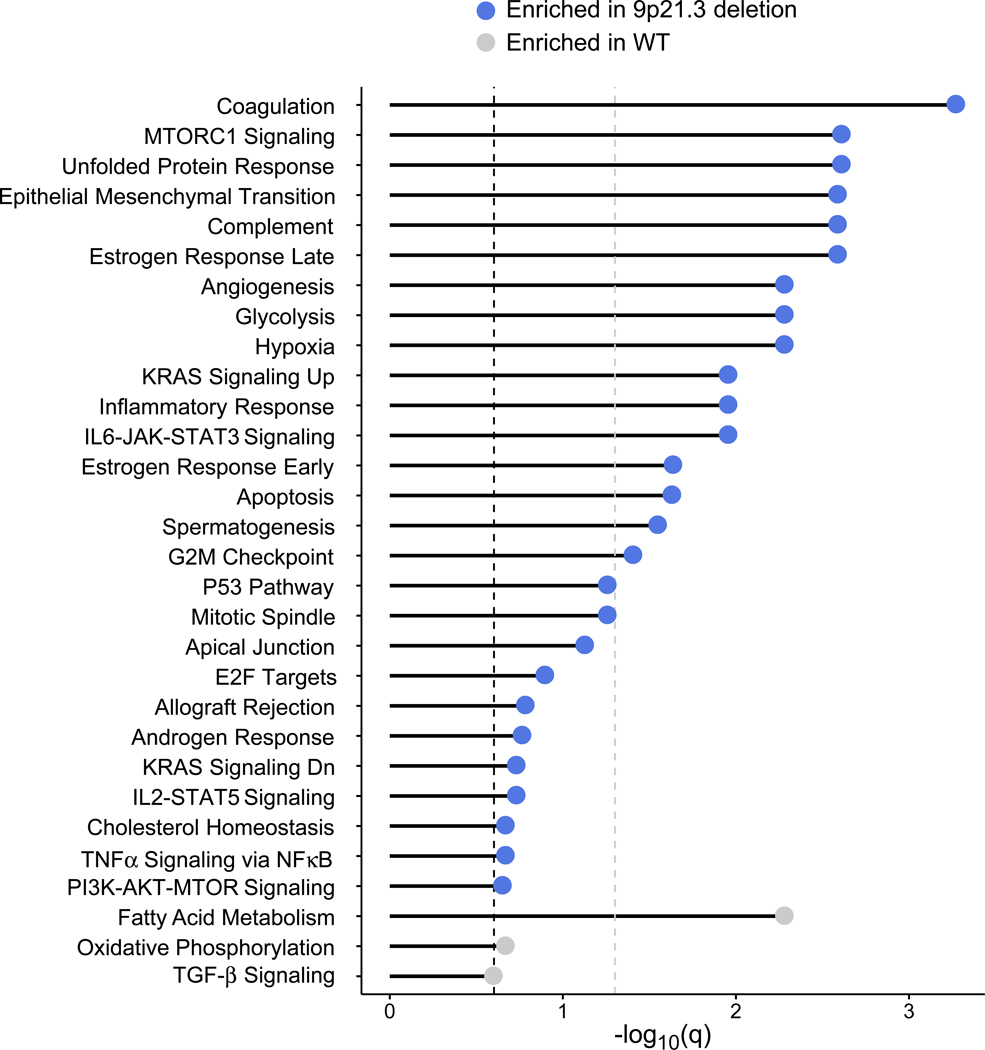
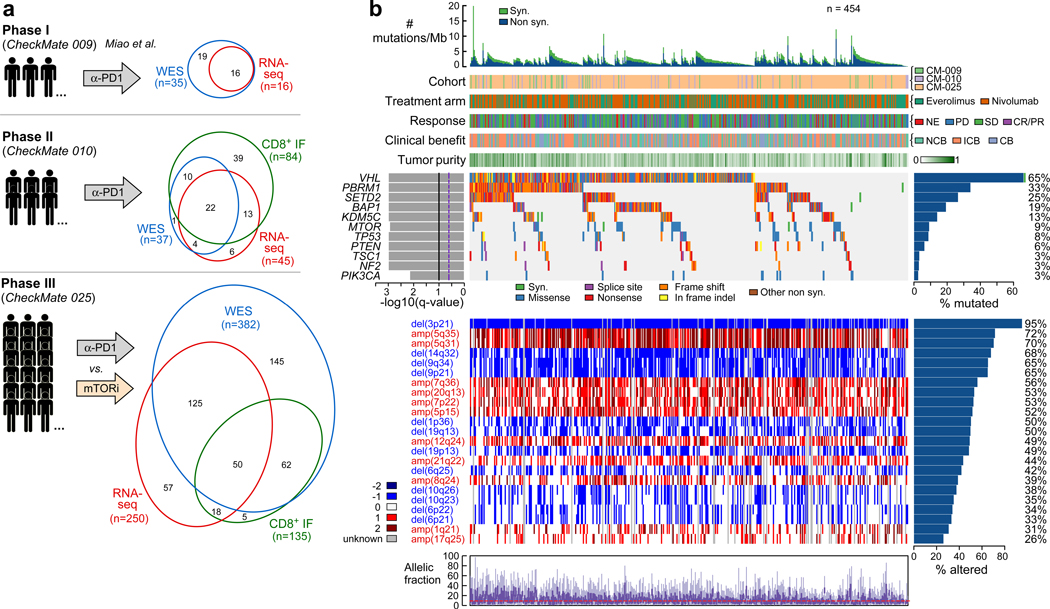
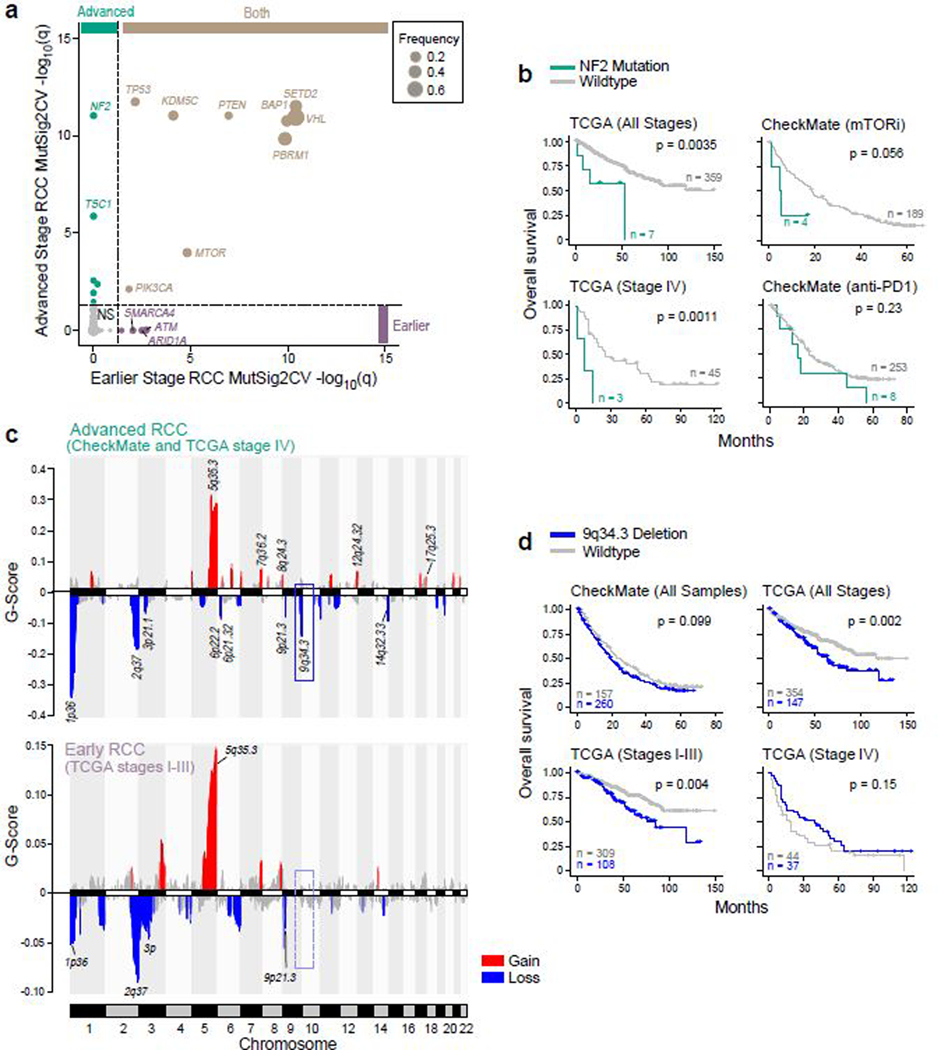
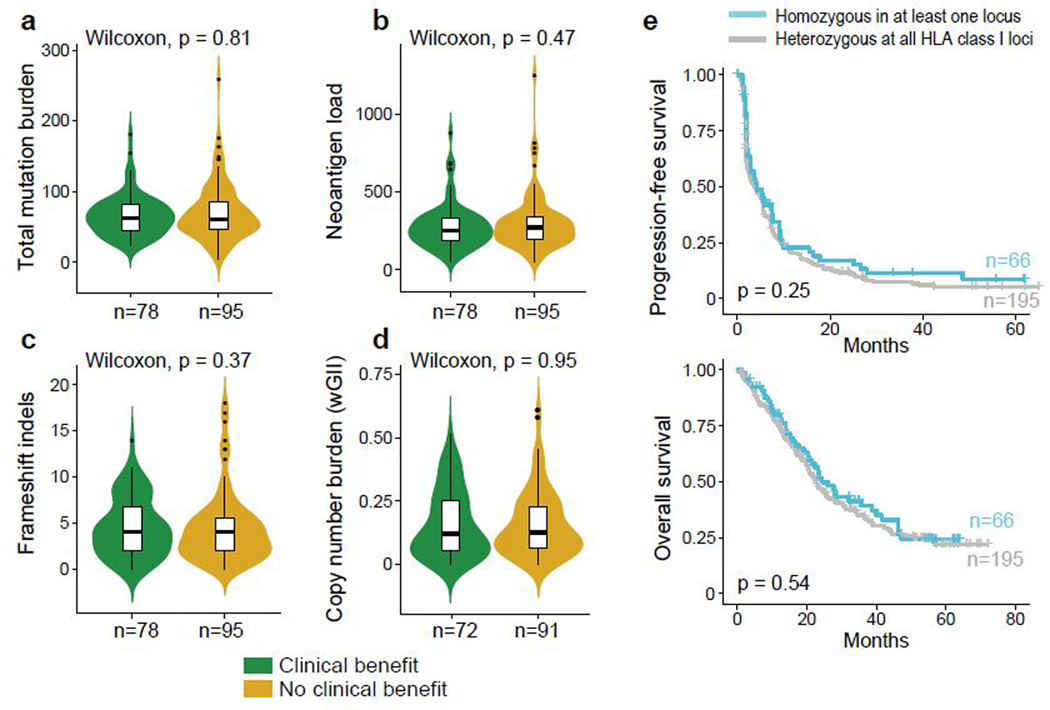
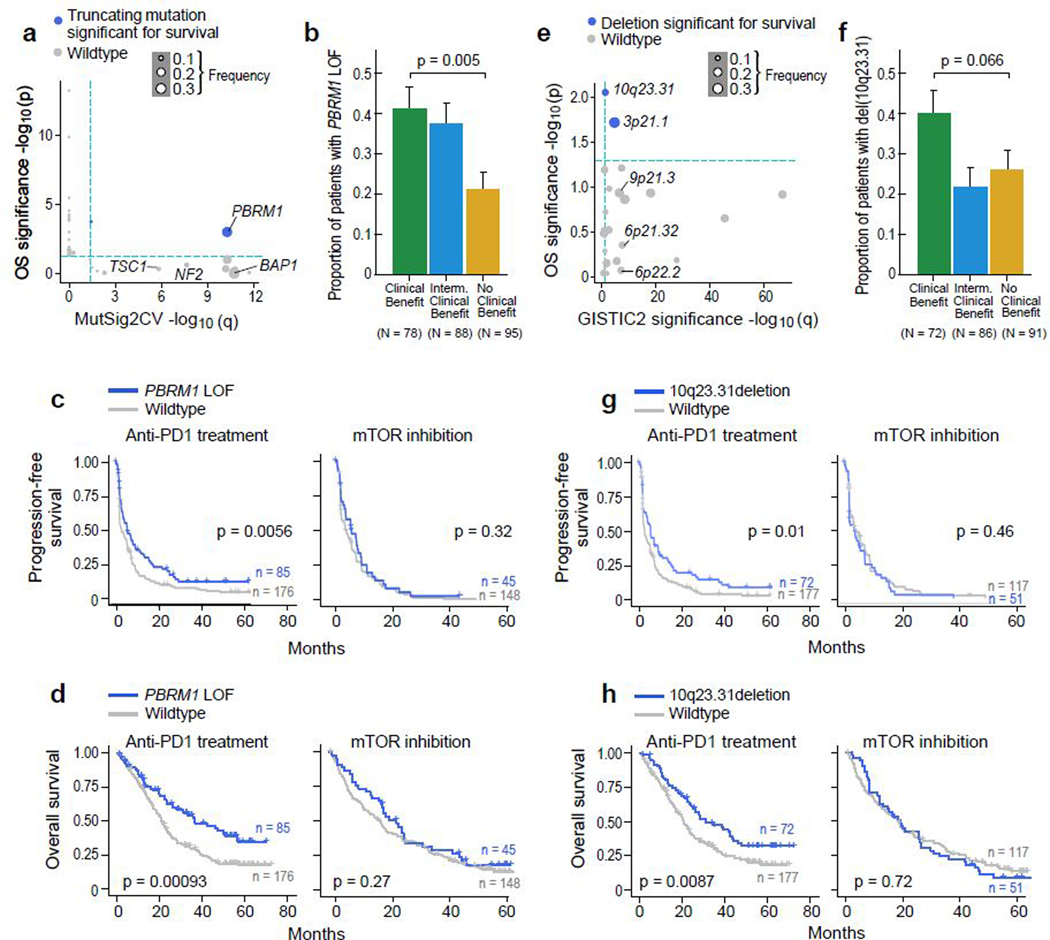
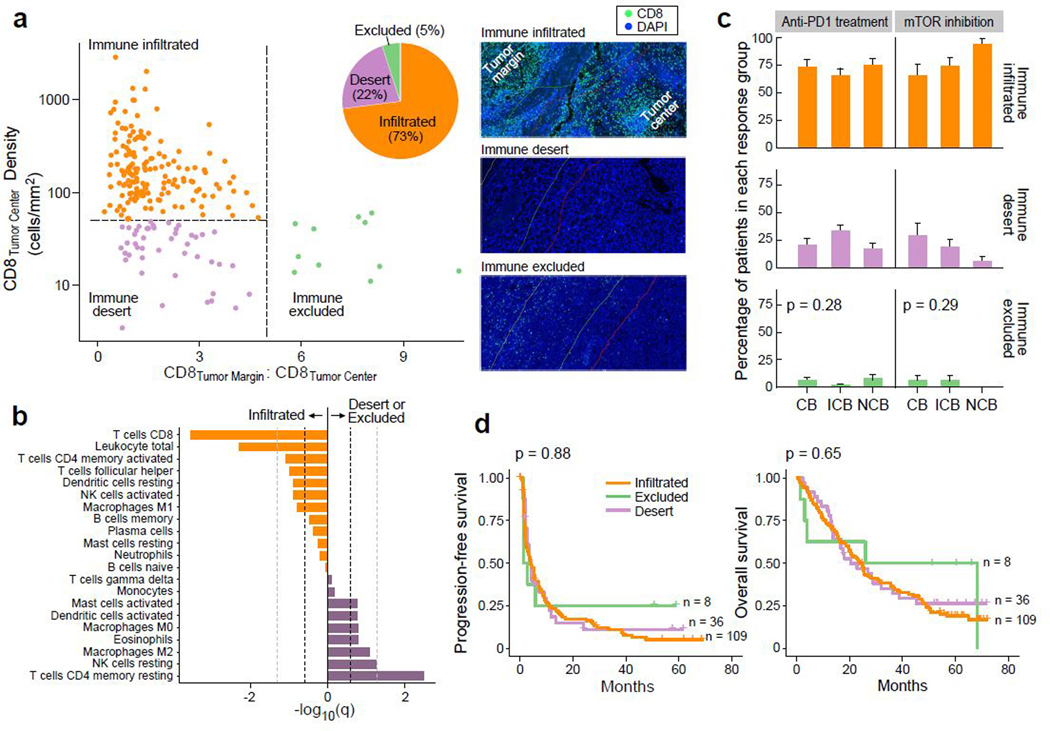
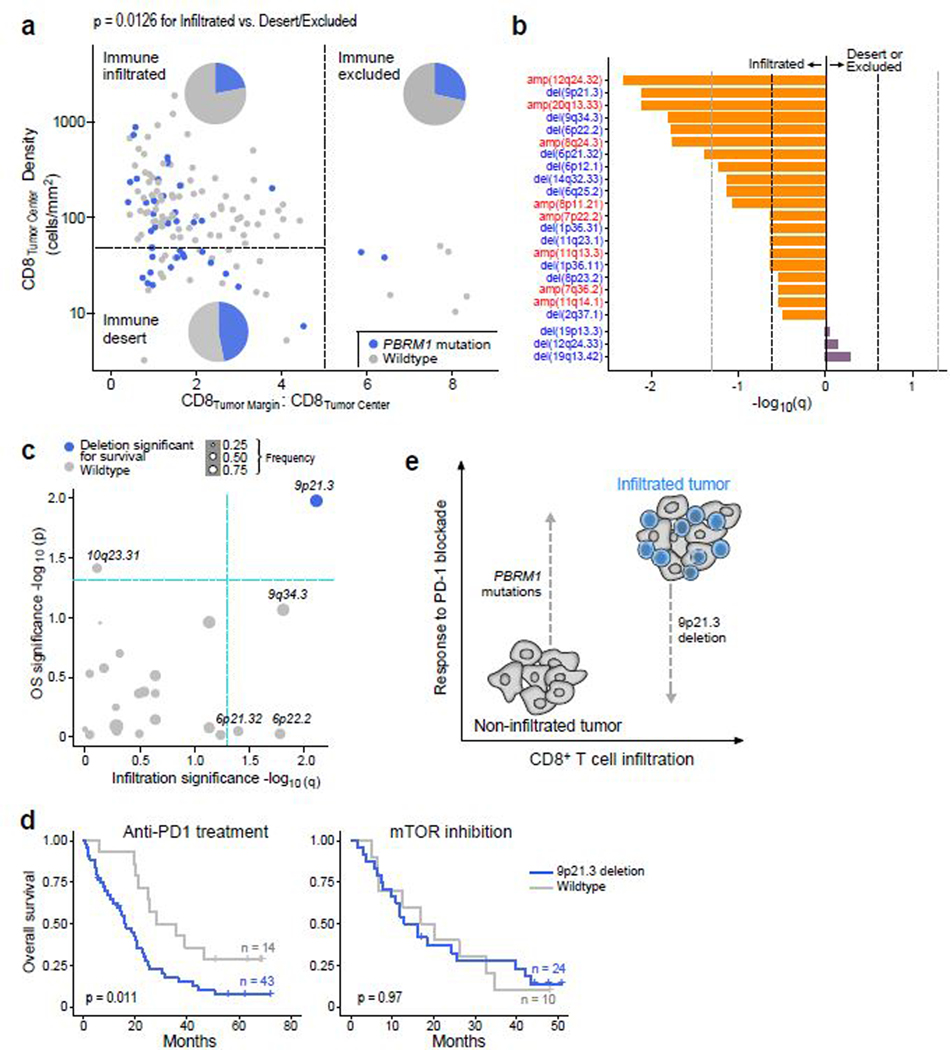
PD-1 blockade has transformed the management of advanced clear cell renal cell carcinoma (ccRCC), but the drivers and resistors of the PD-1 response remain incompletely elucidated. Here, we analyzed 592 tumors from patients with advanced ccRCC enrolled in prospective clinical trials of treatment with PD-1 blockade by whole-exome and RNA sequencing, integrated with immunofluorescence analysis, to uncover the immunogenomic determinants of the therapeutic response. Although conventional genomic markers (such as tumor mutation burden and neoantigen load) and the degree of CD8+ T cell infiltration were not associated with clinical response, we discovered numerous chromosomal alterations associated with response or resistance to PD-1 blockade. These advanced ccRCC tumors were highly CD8+ T cell infiltrated, with only 27% having a non-infiltrated phenotype. Our analysis revealed that infiltrated tumors are depleted of favorable PBRM1 mutations and enriched for unfavorable chromosomal losses of 9p21.3, as compared with non-infiltrated tumors, demonstrating how the potential interplay of immunophenotypes with somatic alterations impacts therapeutic efficacy.


Conflict of interest statement

COMPETING INTERESTS:

The other authors declare no potential conflicts of interest.

Figures

Extended Data Fig 1.
Sample inclusion and exclusion criteria including quality control filtering for CM-010
Extended Data Fig 2.
Response and survival for sequenced vs non-sequenced patients in each cohort
Extended Data Fig 3
Extended Data Fig 3
Genomic and immune features associated with MSKCC risk groups
Extended Data Fig 4
Extended Data Fig 4
Survival of patients with high versus low somatic alteration burden
Extended Data Fig 5
Extended Data Fig 5
Genomic correlates of survival following anti-PD-1 or mTOR treatment
Extended Data Fig 6
Extended Data Fig 6
Characterization of immune infiltration and its association with clinical outcome
Extended Data Fig 7
Extended Data Fig 7
Immune-related gene signature expression is not associated with improved response or survival with anti-PD-1 therapy
Extended Data Fig 8
Extended Data Fig 8
Enrichment of individual mutations and chromosomal instability in infiltrated versus noninfiltrated tumors
Extended Data Fig 9
Extended Data Fig 9
Association of focal amplifications and deletions with T cell infiltration and survival with PD1 blockade
Extended Data Fig 10
GSEA of 9p21 3 deleted tumors versus wildtype using the Hallmark gene sets
Figure 1.
Figure 1.
Somatic alteration landscape of the Checkmate cohorts. (a) Immunogenomic characterization of Checkmate cohorts. WES, RNA-seq and IF data were generated from samples collected prior to PD-1 blockade (or mTOR inhibition) from three prospective clinical trials (Checkmate-009, −010, −025). (b) Somatic alterations in ccRCC. Top histogram, mutation rate per sample; Top tracks, indication of cohort and treatment arm, clinical outcome and purity of each sample. Left histograms, MutSig2CV significance for recurrently mutated genes; right histograms, frequency of somatic alterations. Upper heatmap, distribution of synonymous and nonsynonymous mutation events; middle heatmap, distribution of copy number events (negative values indicating loss, positive indicating gain; 1 and 2 indicating low and high amplitude, respectively). Lower chart, allele fractions per sample.
Figure 2.
Figure 2.
Genomic features of advanced renal cell carcinoma (RCC) tumors. (a) NF2 and TSC1 genes are recurrently mutated in advanced RCC. MutSig2CV q-values for early stage RCC (TCGA stages I-III, n = 452 patients) versus corresponding q-values for advanced stage RCC samples (CheckMate cohorts + TCGA stage IV, n = 1089 patients). Dotted lines indicate a MutSig2CV FDR threshold of q = 0.05. (b) NF2 mutations are associated with worse OS across RCC stages (two-sided log-rank test). (c) 9q34.3 locus is recurrently deleted in advanced RCC. Upper panel, GISTIC2 peaks in advanced RCC. Lower panel, GISTIC2 peaks in earlier stage RCC. Recurrent copy number events (GISTIC2 q < 0.1) are colored by gain and loss. (d) 9q34.3 loss is associated with worse OS in earlier stage disease (two-sided log-rank test).
Figure 3.
Figure 3.
Somatic alteration burden and HLA zygosity are not associated with clinical outcome with PD-1 blockade. (a-d). Measures of sample-wide somatic burden, including number of (a) tumor mutations, (b) neoantigen load, (c) frameshift indels and (d) weighted genome integrity index (wGII) were not associated with clinical benefit with PD-1 blockade (two-sided Wilcoxon rank-sum test). Boxplot hinges represent 25th to 75th percentiles, central lines represent the medians, the whiskers extend to highest and lowest values no greater than 1.5× interquartile range and the dots indicate outliers; the violin component refers to the kernel probability density and encompasses all cells. (e) HLA zygosity was not associated with progression-free or overall survival (two-sided log-rank test).
Figure 4.
Figure 4.
Genomic correlates of response and resistance to anti-PD-1 therapy. (a) PBRM1 truncating mutations are recurrent (MutSig2CV q < 0.05) and associated with better survival (p < 0.05, two-sided univariable cox regression with mutation status as a categorical covariate) with anti-PD-1 therapy (n = 249 patients with anti-PD-1 therapy). Truncating mutations in PBRM1 are associated with improved (b) response (p = 0.005, two-sided Fisher’s exact test for clinical benefit vs. no clinical benefit tumors. Error bars are SEM and measure of center is mean), (c) PFS, and (d) OS with PD-1 blockade but not with mTOR inhibition (two-sided log-rank test). (e) Deletions in 10q23.31 are recurrent (GISTIC2 q < 0.1) and associated with improved progression-free and overall survival (p < 0.05, two-sided univariate cox regression with copy number deletion status as a categorical covariate) following anti-PD-1 therapy but not mTOR inhibition (two-sided log-rank test, n = 249 patients with anti-PD-1 therapy). Deletions in 10q23.31 are associated with (f) response (p = 0.066, two-sided Fisher’s exact test for clinical benefit vs. no clinical benefit tumors. Error bars are SEM and measure of center is mean), (g) PFS, and (h) OS with PD-1 blockade but not with mTOR inhibition (two-sided log-rank test).
Figure 5.
Figure 5.
Baseline CD8+ infiltration of RCC tumors is not associated with response to anti-PD-1 therapy. (a) The majority of ccRCC samples (73%) are infiltrated with CD8+ T cells (n = 160 for infiltrated, n = 48 for desert, n = 11 for excluded groups). Thresholds of tumor center density (horizontal dotted line; 25th percentile or 50 CD8+ T cells/mm2) and ratio of tumor margin to tumor center densities (vertical dotted line; CD8 tumor margin:tumor center ratio >=5) were used for immune phenotyping, and classifications were confirmed by manual review by pathologists (see Methods). Right panels, CD8 and DAPI staining of representative samples (from n = 219 stained samples) classified as immune infiltrated (top), desert (middle) and excluded (bottom). (b) Immune compartments with a higher relative proportion in immune infiltrated and non-infiltrated samples, by CIBERSORTx deconvolution of RNA-seq data. Dotted lines indicate FDR threshold of q = 0.25 (dark) and q = 0.05 (light) respectively (two-sided Wilcoxon rank-sum test and Benjamini-Hochberg method for FDR correction, n = 79 infiltrated and n = 24 non-infiltrated). (c-d). No association was observed between immune infiltration phenotype and (c) clinical benefit (two-sided chi-squared test, n = 153 patients with anti-PD-1 treatment and n = 66 patients with mTOR inhibition. Error bars are SEM and measure of center is mean.) or (d) survival (two-sided log-rank test) with PD-1 blockade.
Figure 6.
Figure 6.
Potential interplay of immune infiltration and genomic features modulate response to PD-1 blockade. (a) Truncating mutations in PBRM1 are preferentially enriched in non-infiltrated (desert or excluded) samples as compared to infiltrated samples (two-sided Fisher’s exact test for infiltrated vs. non-infiltrated tumors, p = 0.0126, n = 105 infiltrated and n = 39 non-infiltrated). (b) Numerous copy number aberrations are significantly enriched in infiltrated samples (two-sided Fisher’s exact test for infiltrated vs. non-infiltrated tumors, n = 91 infiltrated and n = 38 non-infiltrated). Dotted lines indicate a q-value of 0.25 (dark) and 0.05 (light). (c) 9p21.3 loss is enriched in immune infiltrated samples (two-sided Fisher’s exact test, q < 0.05) and associated with altered PFS and OS (two-sided log-rank test, p < 0.05) following anti-PD-1 therapy (n = 57 infiltrated patients with anti-PD-1 therapy). (d) del(9p21.3) is associated with worse OS following PD-1 blockade but not mTOR inhibition (two-sided log-rank test). (e) Schematic representation of potential interplay of immune infiltration and tumor genomics. CD8+ T cell infiltrated tumors are poised to respond to PD-1 blockade, but are also enriched for unfavorable 9p21.3 deletions, which decreases survival in this context. By contrast, non-infiltrated tumors may be less likely to respond, but are enriched for favorable PBRM1 mutations, which are associated with improved clinical outcome with anti-PD-1 therapy.

Similar articles

Cited by

References

MAIN REFERENCES:

    1. Ribas A. & Wolchok JD Cancer immunotherapy using checkpoint blockade. Science 359, 1350–1355, doi:10.1126/science.aar4060 (2018). - DOI - PMC - PubMed
    1. Motzer RJ et al. Nivolumab versus Everolimus in Advanced Renal-Cell Carcinoma. N Engl J Med 373, 1803–1813, doi:10.1056/NEJMoa1510665 (2015). - DOI - PMC - PubMed
    1. Motzer RJ et al. Avelumab plus Axitinib versus Sunitinib for Advanced Renal-Cell Carcinoma. N Engl J Med 380, 1103–1115, doi:10.1056/NEJMoa1816047 (2019). - DOI - PMC - PubMed
    1. Motzer RJ et al. Nivolumab plus Ipilimumab versus Sunitinib in Advanced Renal-Cell Carcinoma. N Engl J Med 378, 1277–1290, doi:10.1056/NEJMoa1712126 (2018). - DOI - PMC - PubMed
    1. Rini BI et al. Pembrolizumab plus Axitinib versus Sunitinib for Advanced Renal-Cell Carcinoma. N Engl J Med 380, 1116–1127, doi:10.1056/NEJMoa1816714 (2019). - DOI - PubMed

METHODS REFERENCES:

    1. Cibulskis K. et al. ContEst: estimating cross-contamination of human samples in next-generation sequencing data. Bioinformatics 27, 2601–2602, doi:10.1093/bioinformatics/btr446 (2011). - DOI - PMC - PubMed
    1. Cibulskis K. et al. Sensitive detection of somatic point mutations in impure and heterogeneous cancer samples. Nat Biotechnol 31, 213–219, doi:10.1038/nbt.2514 (2013). - DOI - PMC - PubMed
    1. Saunders CT et al. Strelka: accurate somatic small-variant calling from sequenced tumor-normal sample pairs. Bioinformatics 28, 1811–1817, doi:10.1093/bioinformatics/bts271 (2012). - DOI - PubMed
    1. Ramos AH et al. Oncotator: cancer variant annotation tool. Hum Mutat 36, E2423–2429, doi:10.1002/humu.22771 (2015). - DOI - PMC - PubMed
    1. Costello M. et al. Discovery and characterization of artifactual mutations in deep coverage targeted capture sequencing data due to oxidative DNA damage during sample preparation. Nucleic Acids Res 41, e67, doi:10.1093/nar/gks1443 (2013). - DOI - PMC - PubMed

Publication types

MeSH terms

Substances