. 2020 May 29;7(1):6.
doi: 10.1186/s40708-020-00107-z.

EEG-based classification of epilepsy and PNES: EEG microstate and functional brain network features

Affiliations

EEG-based classification of epilepsy and PNES: EEG microstate and functional brain network features

Negar Ahmadi et al. Brain Inform. .

Abstract

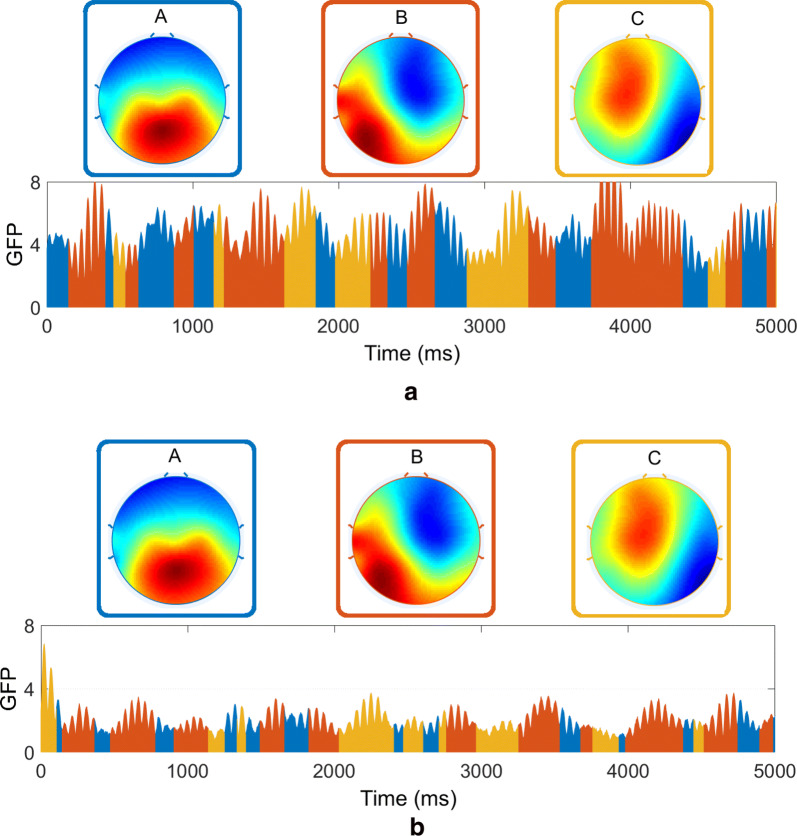
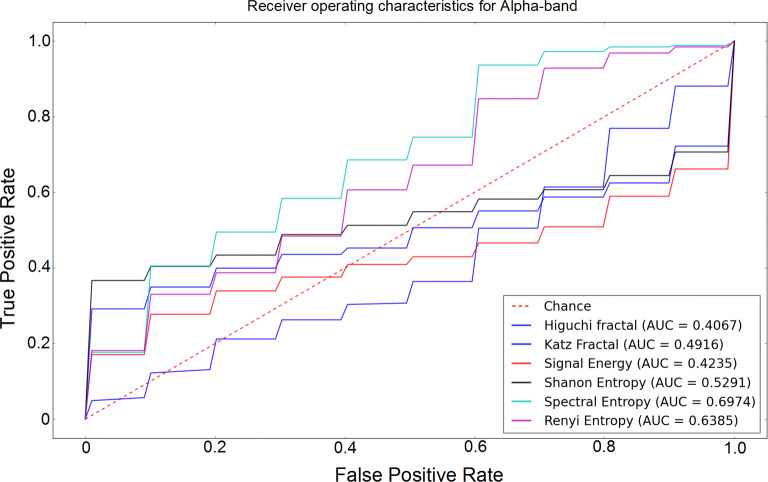
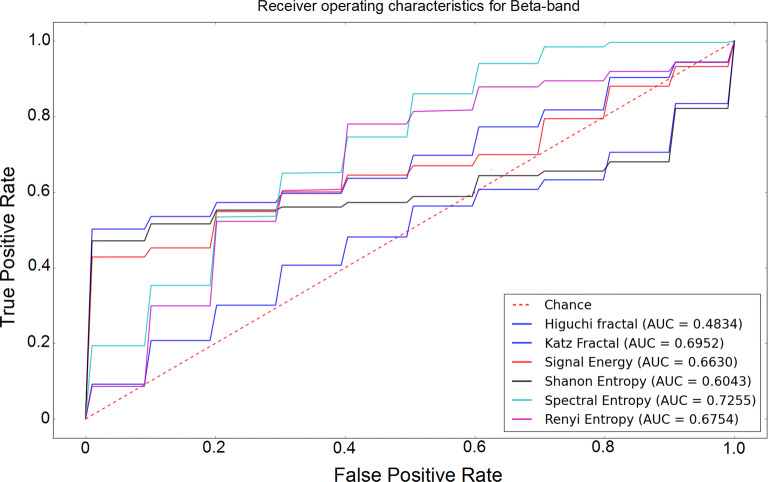
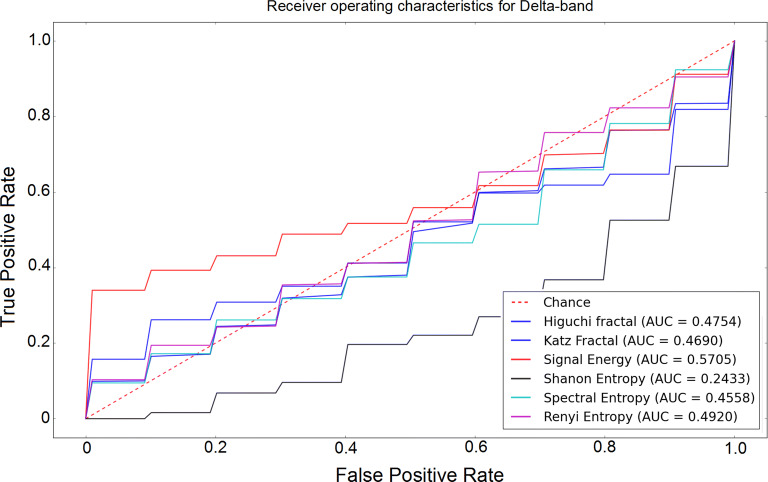
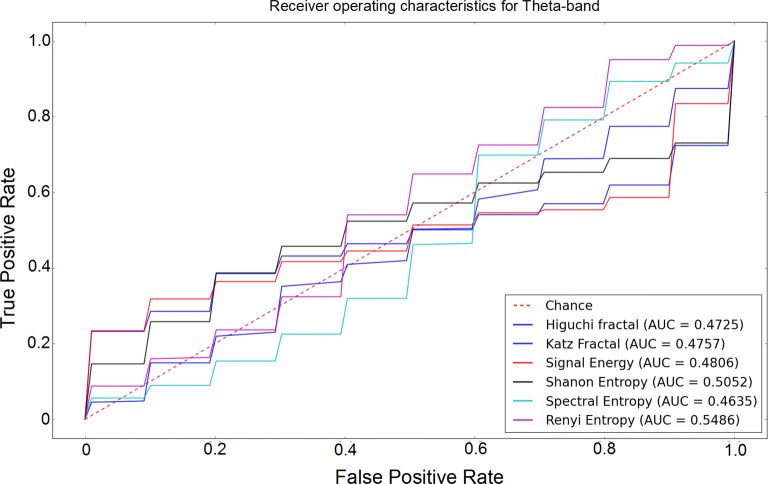
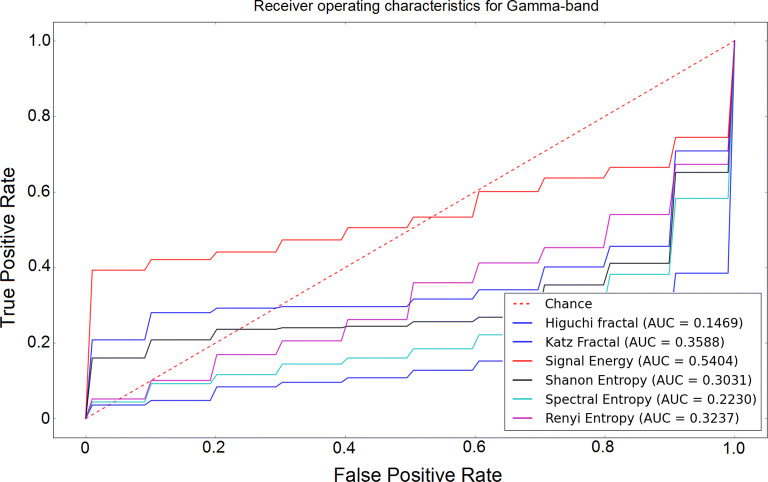
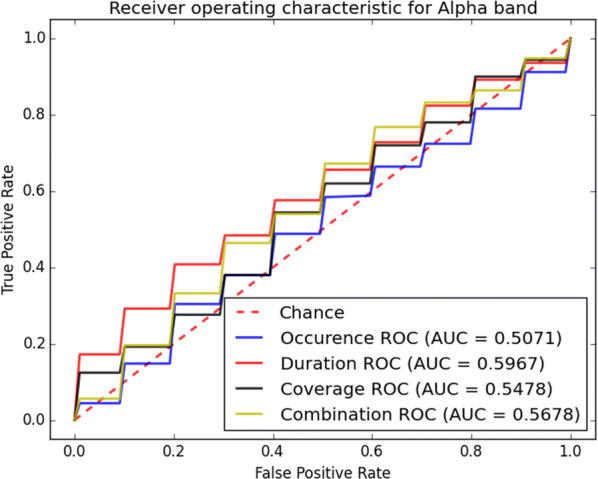
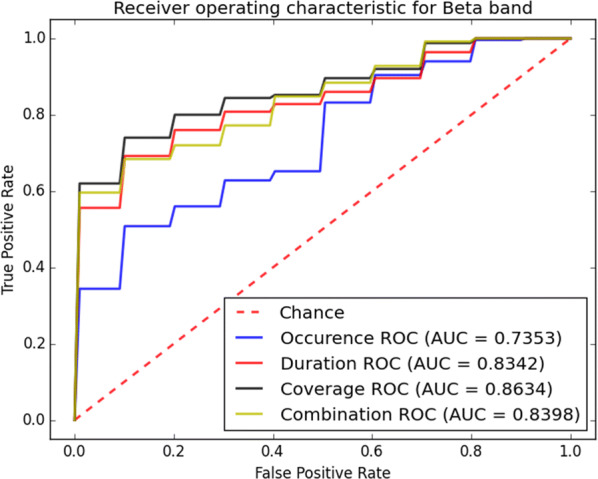
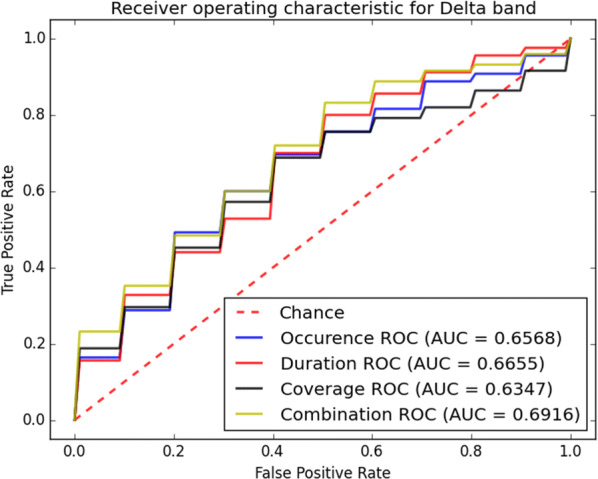
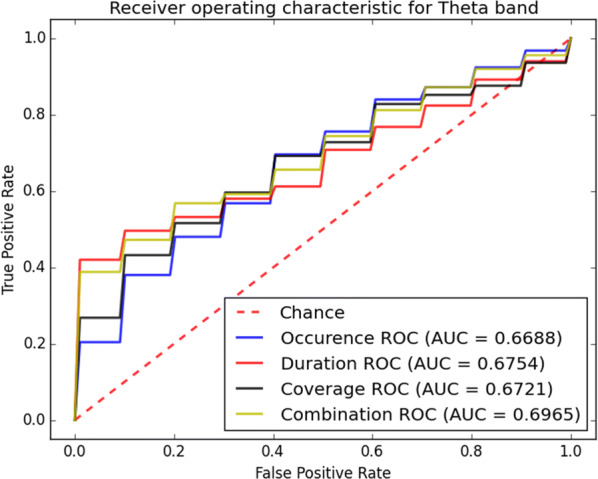
Epilepsy and psychogenic non-epileptic seizures (PNES) often show over-lap in symptoms, especially at an early disease stage. During a PNES, the electrical activity of the brain remains normal but in case of an epileptic seizure the brain will show epileptiform discharges on the electroencephalogram (EEG). In many cases an accurate diagnosis can only be achieved after a long-term video monitoring combined with EEG recording which is quite expensive and time-consuming. In this paper using short-term EEG data, the classification of epilepsy and PNES subjects is analyzed based on signal, functional network and EEG microstate features. Our results showed that the beta-band is the most useful EEG frequency sub-band as it performs best for classifying subjects. Also the results depicted that when the coverage feature of the EEG microstate analysis is calculated in beta-band, the classification shows fairly high accuracy and precision. Hence, the beta-band and the coverage are the most important features for classification of epilepsy and PNES patients.

Keywords: Classification; EEG microstate; Epilepsy; Functional network; PNES.


Conflict of interest statement

The authors declare that they have no competing interests.

Figures

Fig. 1
Fig. 1
a An EEG time series (filled circles represent time points), b top: applying HVG criteria on time points, bottom: corresponding graph, and c corresponding degree sequences of the HVG for such time points
Fig. 2
Fig. 2
Schematic flowchart of the EEG microstate analysis. Each EEG datum is used to calculate the GFP curve at each data point. The electric potentials of all electrodes at moments of local maxima of the GFP curve are plotted to generate topographic original maps. The original maps are submitted to a clustering algorithm, which groups the submitted maps into a small set of clusters (here: 3) based on topographic similarity, and optimal number of cluster microstate maps is generated for each subject. Finally, the cluster maps are back-fitted to the GFP curve and each data point is labeled with the cluster map that they best correlated to. Therefore, the multichannel EEG recording is now described as a series of alternating microstates
Fig. 3
Fig. 3
The CV measure of fit plotted for a alpha-band, b beta-band, c delta-band and d theta-band
Fig. 4
Fig. 4
The topographies of the selected global microstate classes retrieved from the clustering algorithm for a alpha-band, b beta-band, c delta-band and d theta-band
Fig. 5
Fig. 5
The global cluster maps are back-fitted to the GFP curve of a a subject with epilepsy and b a subject with PNES at beta-band. Each data point is labeled with the cluster map based on the maximal spatial correlation with the global template. The time period that each of the cluster maps covered is shown by color bars
Fig. 6
Fig. 6
ROC analysis of the classification method using various EEG signal features in alpha-band
Fig. 7
Fig. 7
ROC analysis of the classification method using various EEG signal features in beta-band
Fig. 8
Fig. 8
ROC analysis of the classification method using various EEG signal features in delta-band
Fig. 9
Fig. 9
ROC analysis of the classification method using various EEG signal features in theta-band
Fig. 10
Fig. 10
ROC analysis of the classification method using various EEG signal features in gamma-band
Fig. 11
Fig. 11
ROC analysis of the classification method using various microstate features in alpha-band
Fig. 12
Fig. 12
ROC analysis of the classification method using various microstate features in beta-band
Fig. 13
Fig. 13
ROC analysis of the classification method using various microstate features in delta-band
Fig. 14
Fig. 14
ROC analysis of the classification method using various microstate features in theta-band

References

    1. Fisher R S, Boas W V E, Blume W, Elger C, Genton P, Lee P, Engel J., Jr Epileptic seizures and epilepsy: definitions proposed by the international league against epilepsy (ilae) and the international bureau for epilepsy (ibe) Epilepsia. 2005;46:470–472. - PubMed
    1. Devinsky O, Gazzola D, LaFrance WC., Jr Differentiating between nonepileptic and epileptic seizures. Nat Rev Neurol. 2011;7:210. - PubMed
    1. Reuber M. Psychogenic nonepileptic seizures: answers and questions. Epilepsy Behav. 2008;12:622–635. - PubMed
    1. Smith BJ. Closing the major gap in pnes research: finding a home for a borderland disorder. Epilepsy Curr. 2014;14:63–67. - PMC - PubMed
    1. Reuber M, Elger CE. Psychogenic nonepileptic seizures: review and update. Epilepsy Behav. 2003;4:205–216. - PubMed