. 2020 Aug 10;54(3):395-409.e7.
doi: 10.1016/j.devcel.2020.05.003. Epub 2020 May 29.

The Perinuclear ER Scales Nuclear Size Independently of Cell Size in Early Embryos

Affiliations

The Perinuclear ER Scales Nuclear Size Independently of Cell Size in Early Embryos

Richik Nilay Mukherjee et al. Dev Cell. .

Abstract

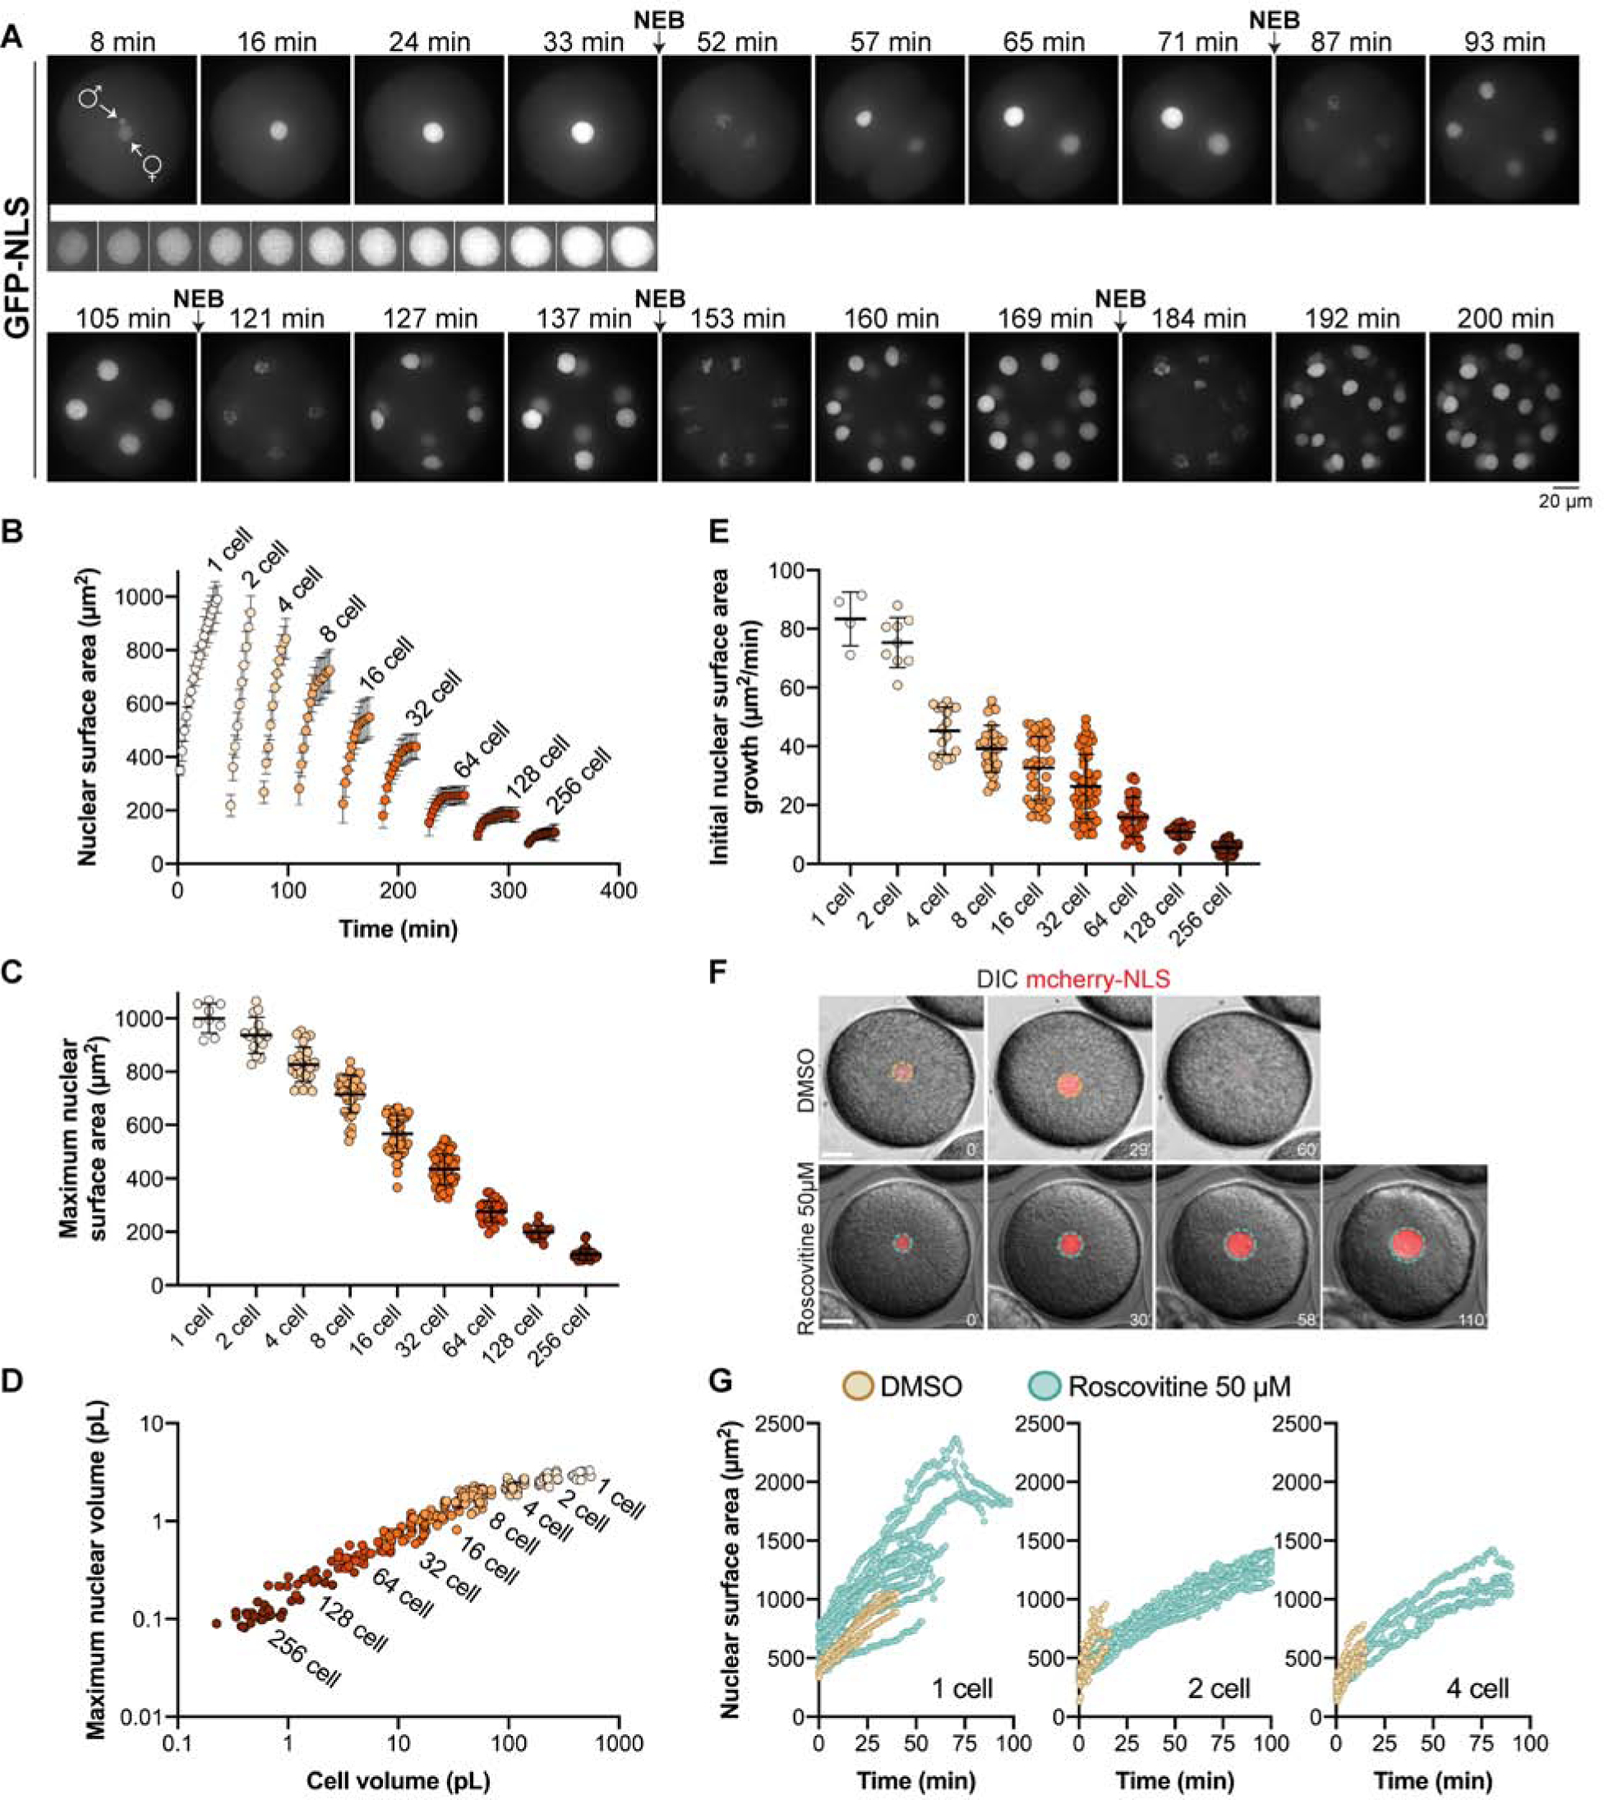
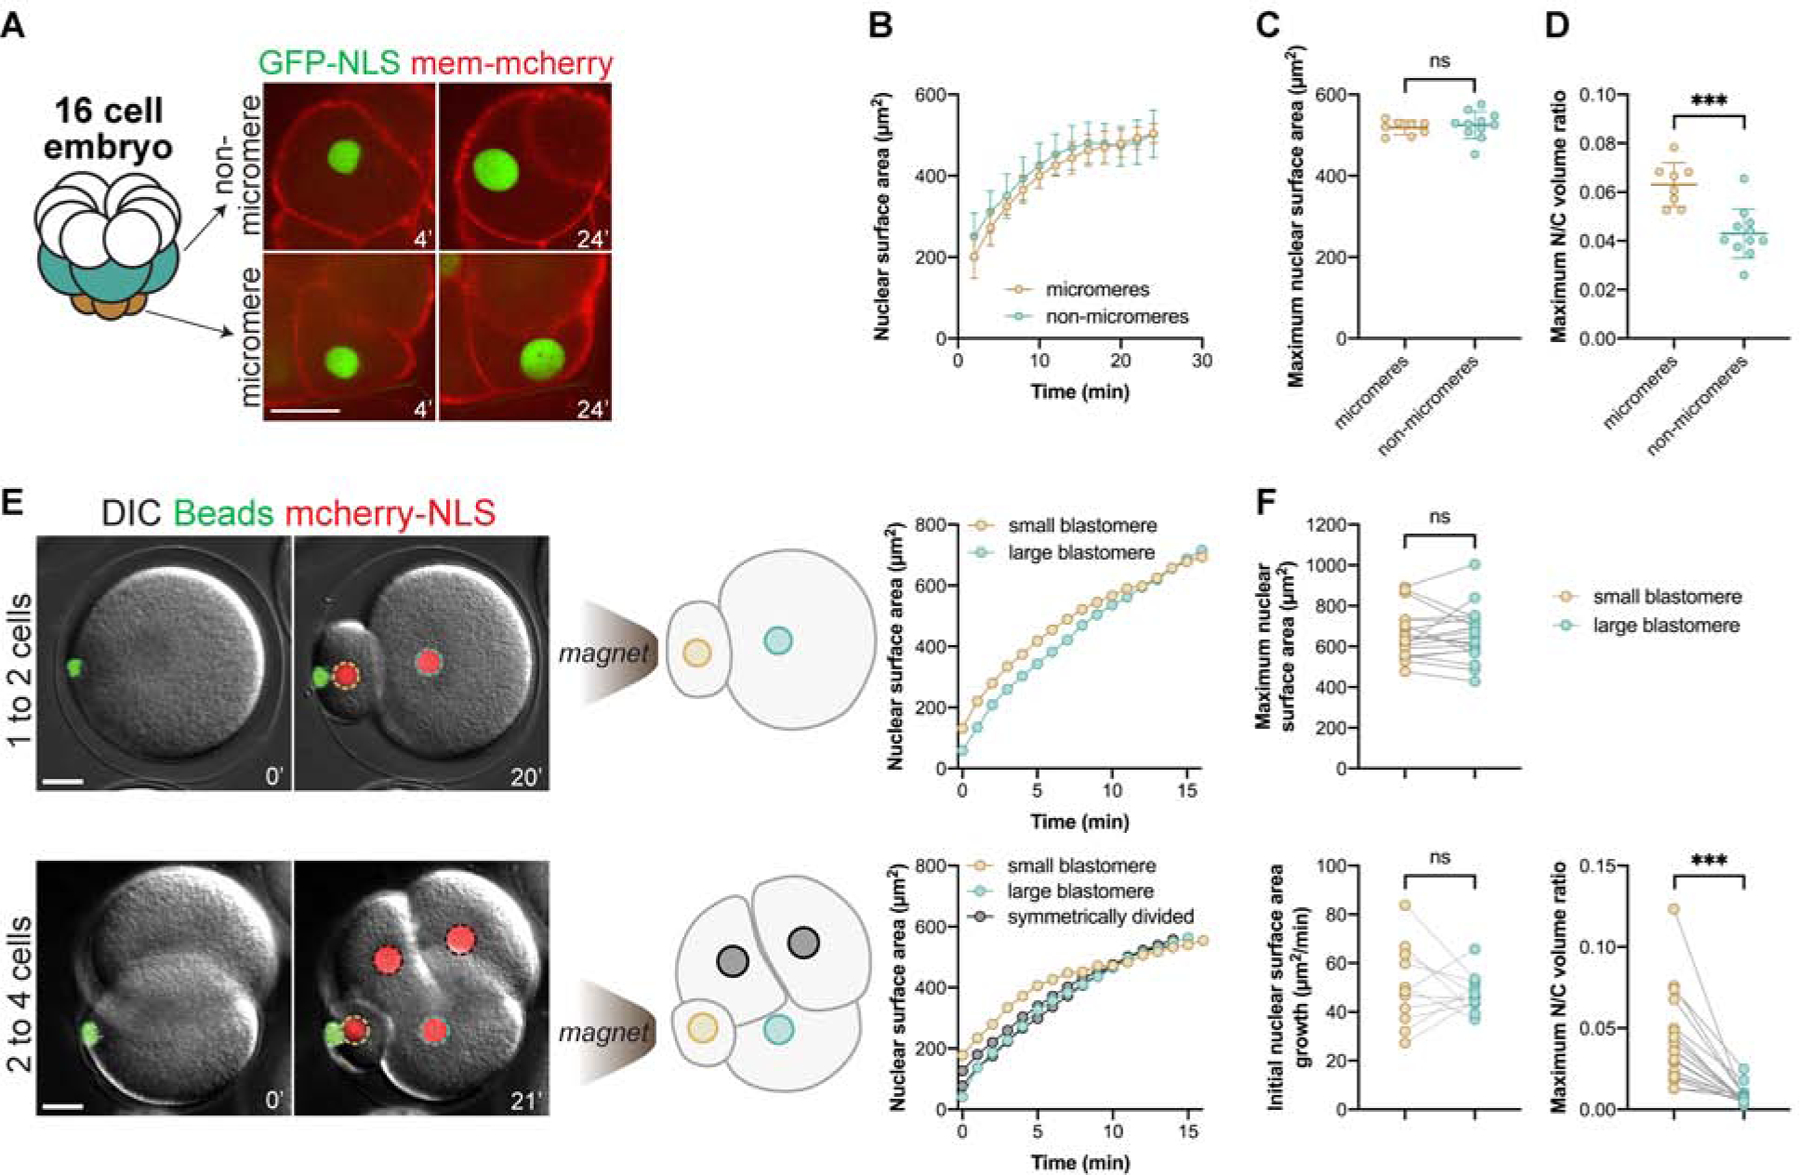
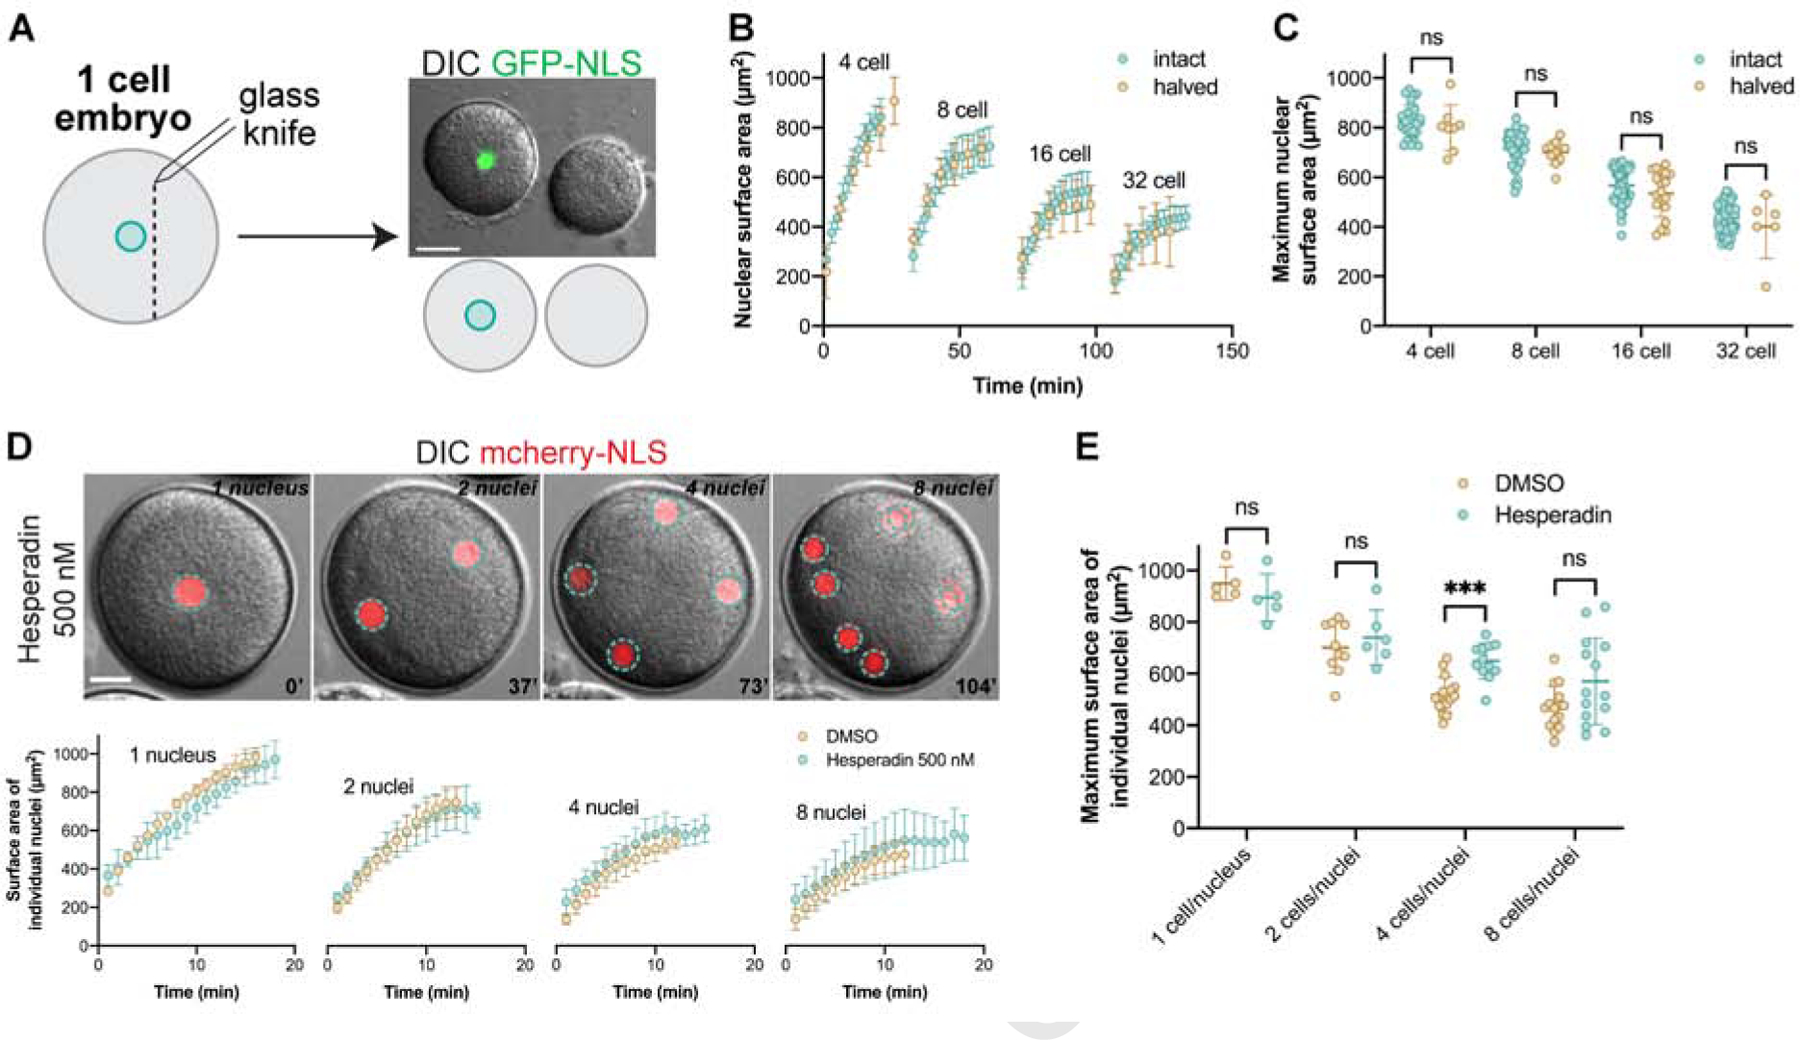
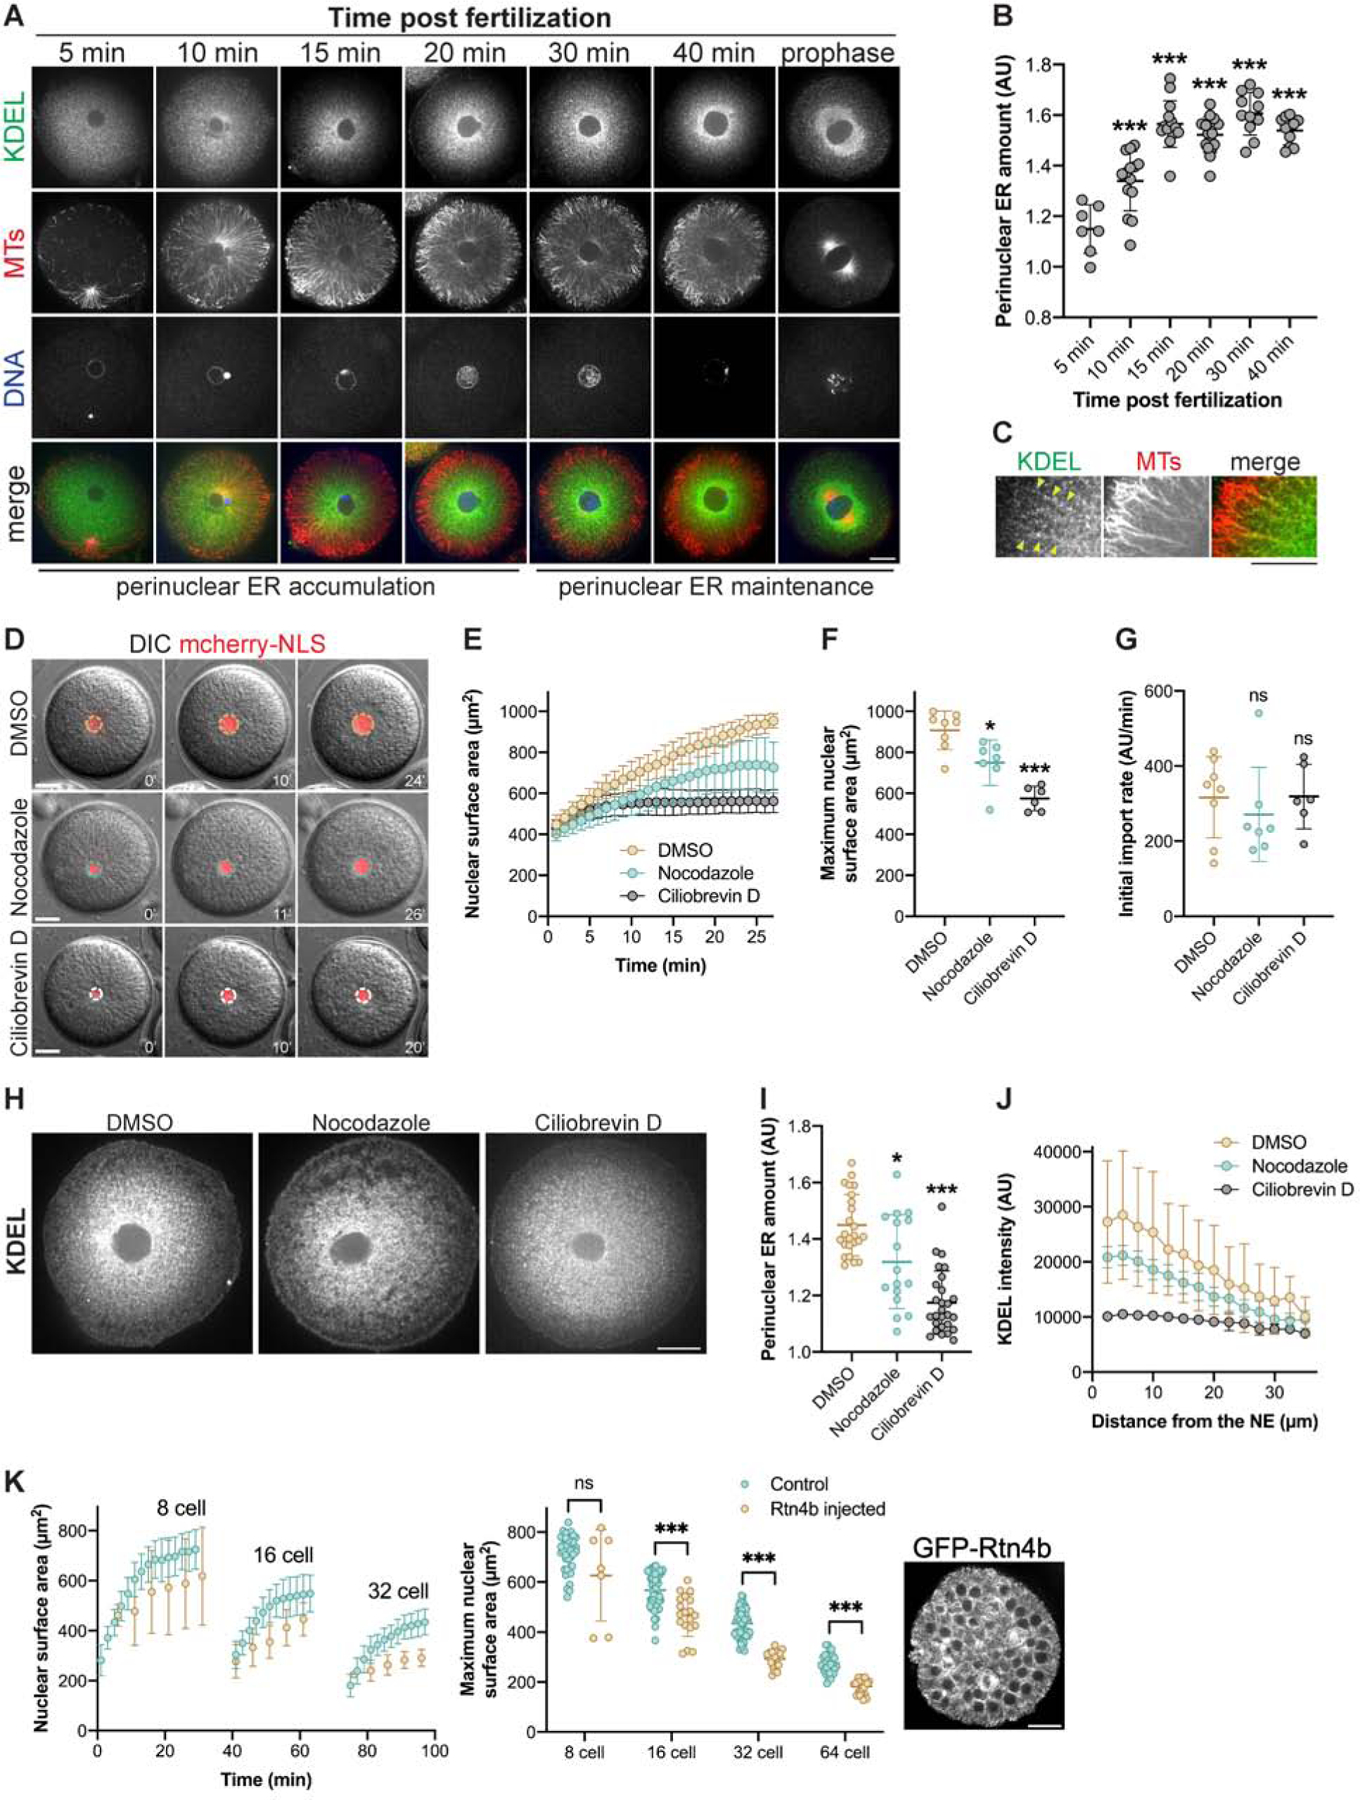
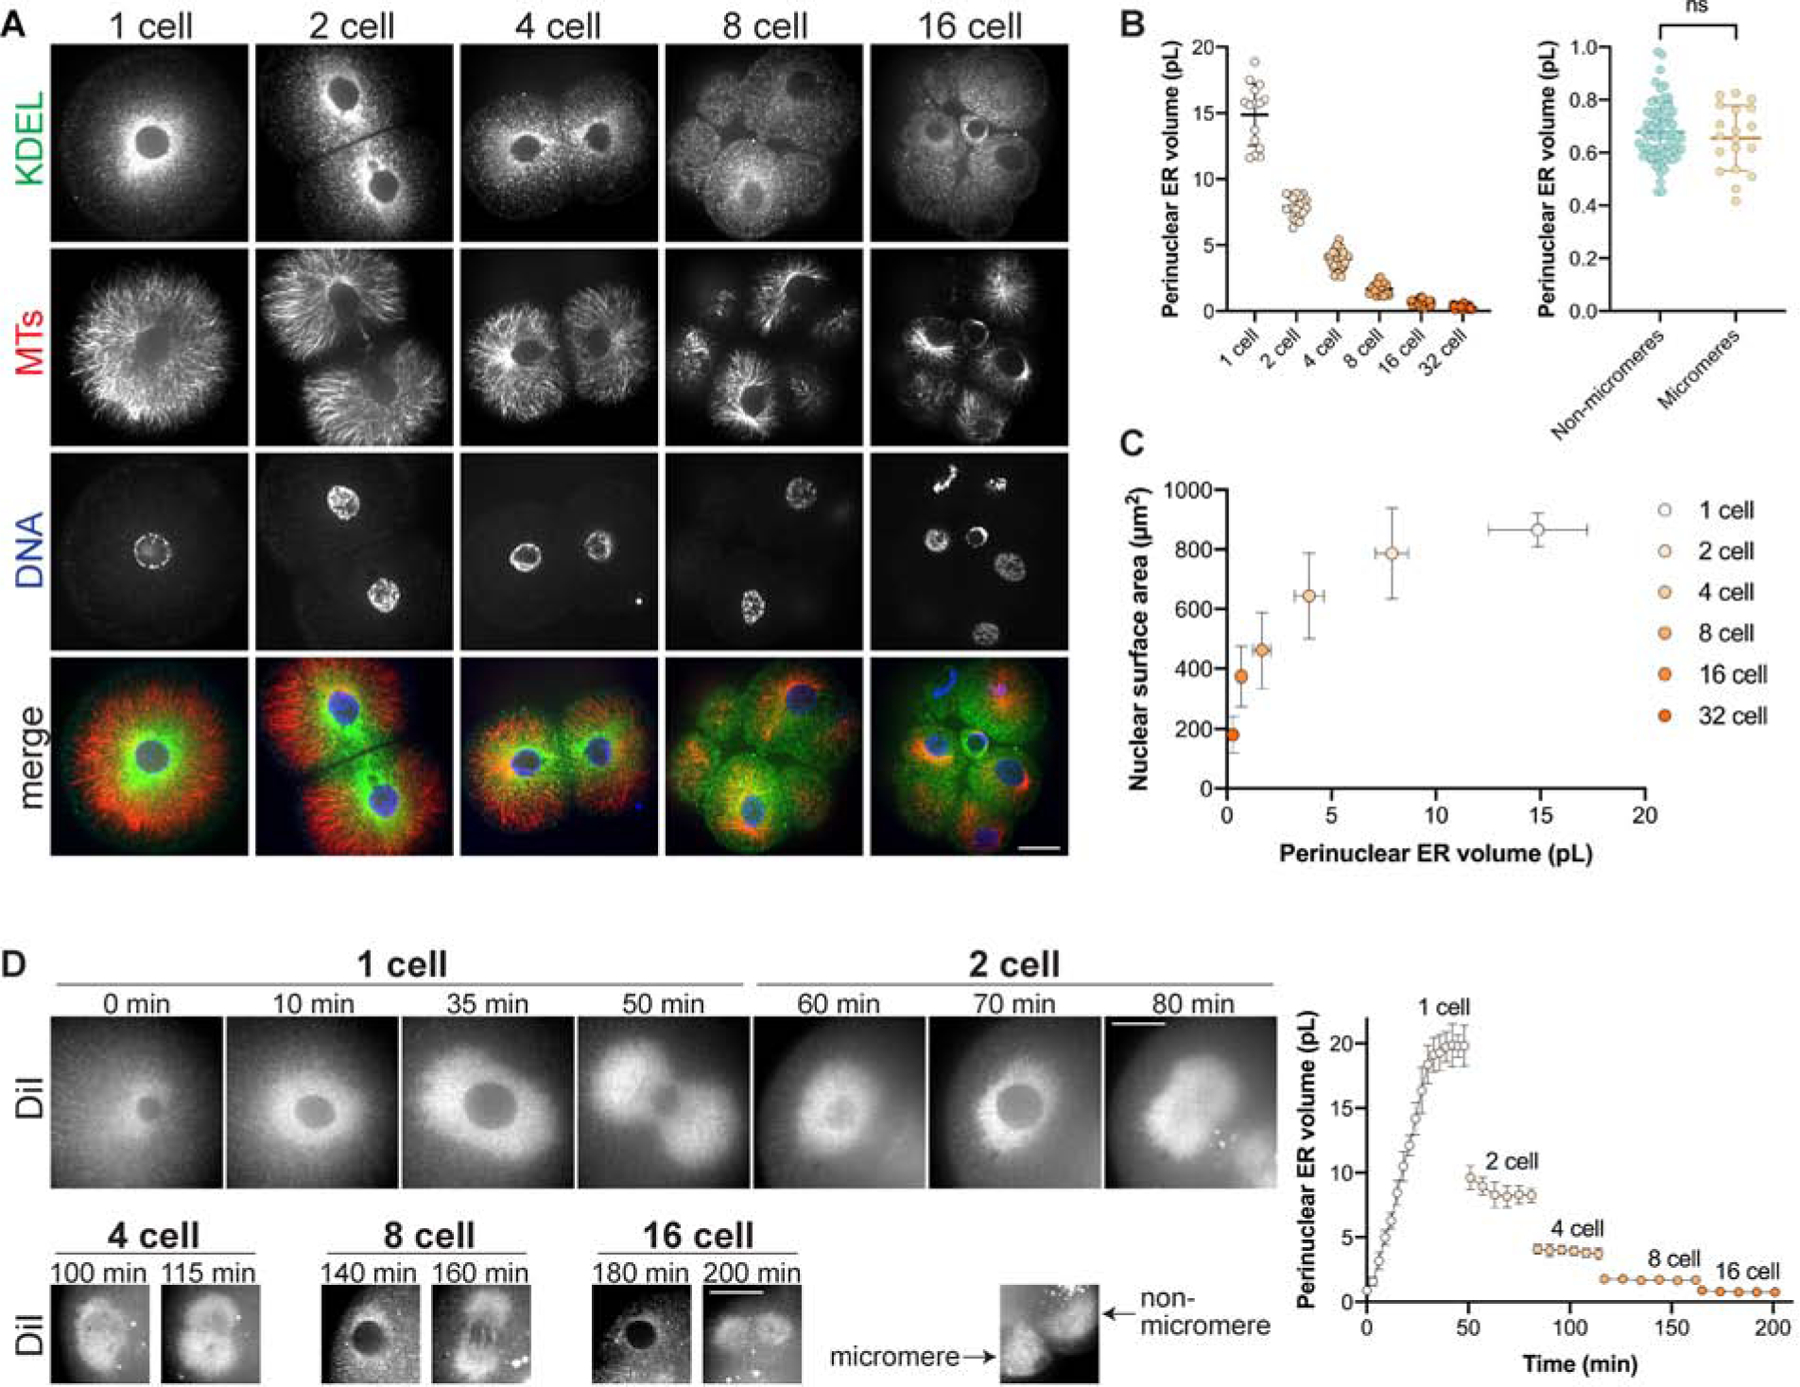
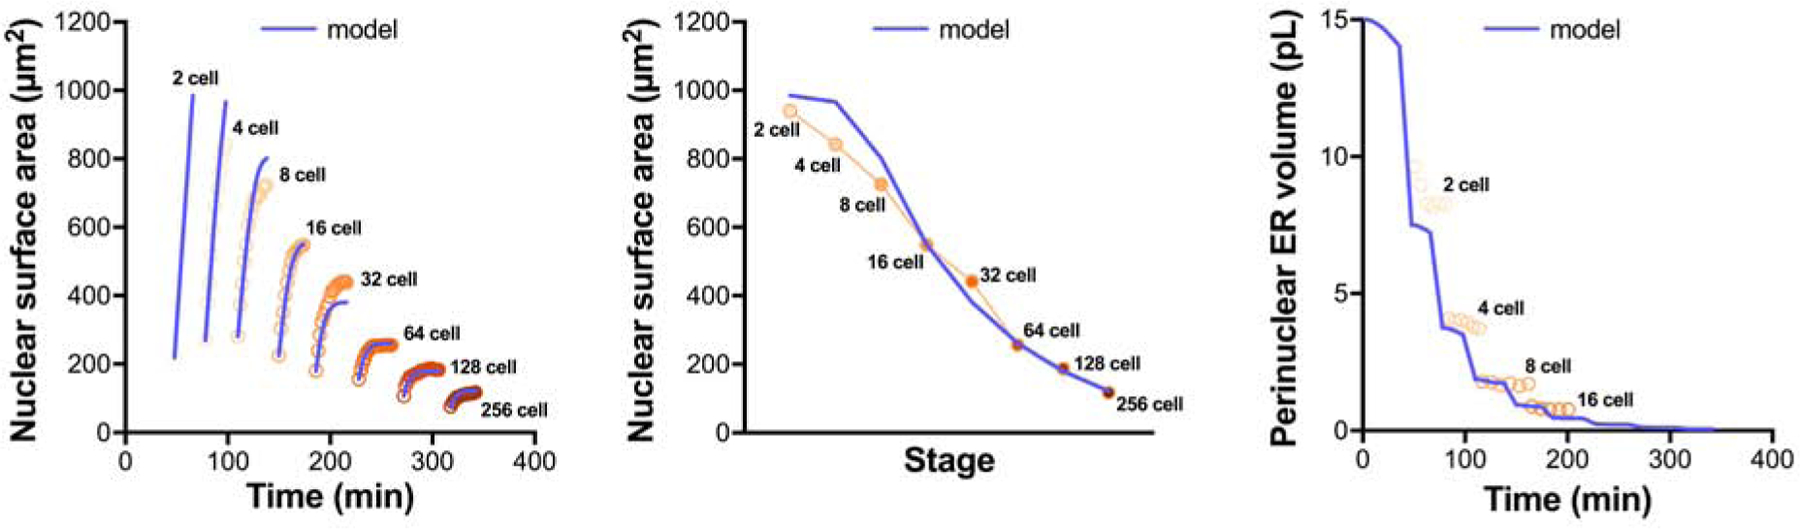
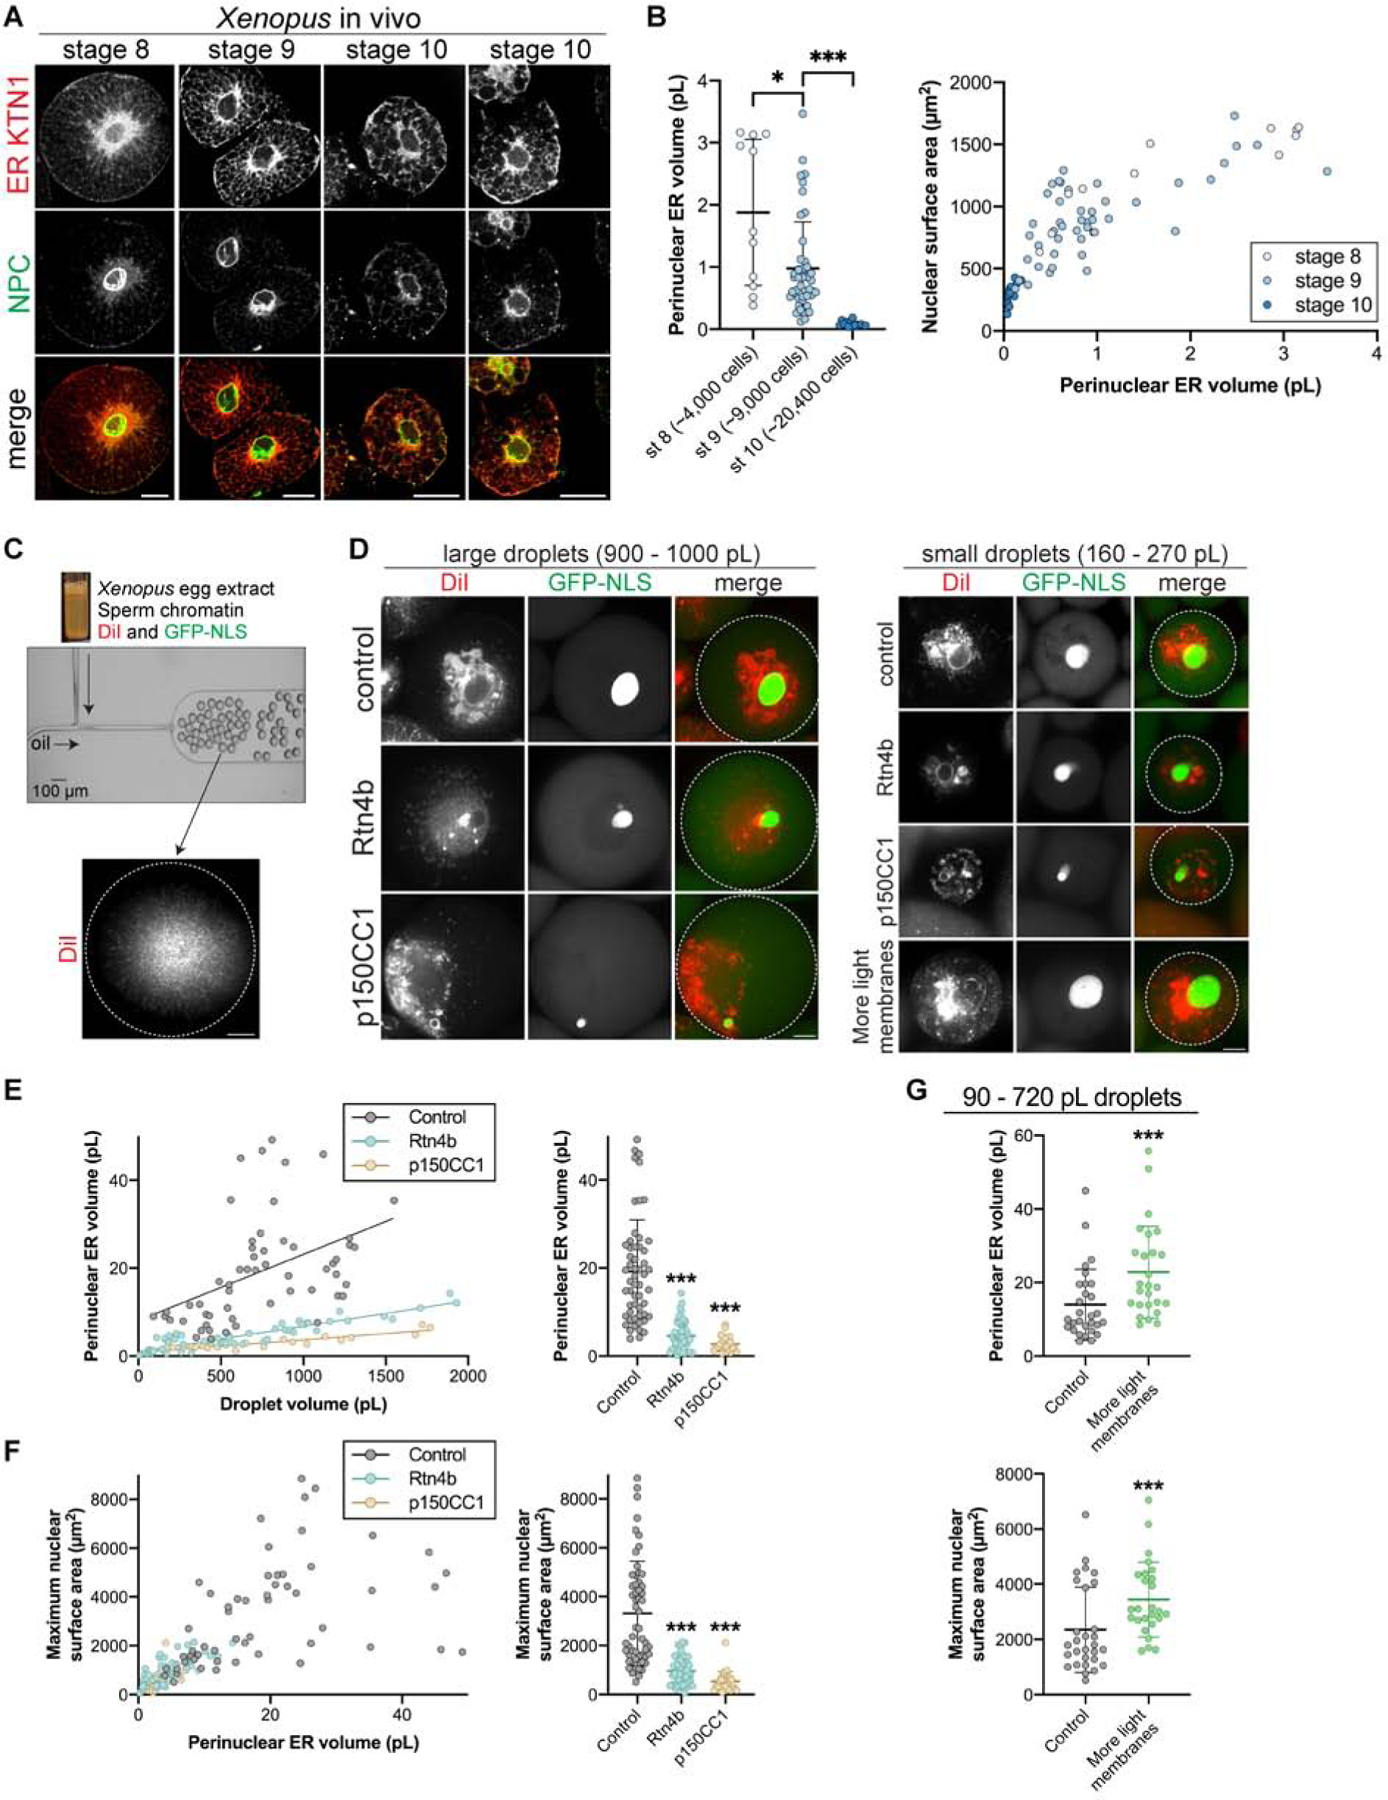
Nuclear size plays pivotal roles in gene expression, embryo development, and disease. A central hypothesis in organisms ranging from yeast to vertebrates is that nuclear size scales to cell size. This implies that nuclei may reach steady-state sizes set by limiting cytoplasmic pools of size-regulating components. By monitoring nuclear dynamics in early sea urchin embryos, we found that nuclei undergo substantial growth in each interphase, reaching a maximal size prior to mitosis that declined steadily over the course of development. Manipulations of cytoplasmic volume through multiple chemical and physical means ruled out cell size as a major determinant of nuclear size and growth. Rather, our data suggest that the perinuclear endoplasmic reticulum, accumulated through dynein activity, serves as a limiting membrane pool that sets nuclear surface growth rate. Partitioning of this local pool at each cell division modulates nuclear growth kinetics and dictates size scaling throughout early development.

Keywords: cell size; embryonic development; nuclear size scaling; nuclear-to-cytoplasmic ratio; nucleus; paracentrotus lividus sea urchins; perinuclear endoplasmic reticulum; xenopus laevis frogs.


Conflict of interest statement

Declaration of Interests The authors declare no competing interests.

Figures

Figure 1.
Figure 1.. Nuclear size scaling in sea urchin embryos.
(A-E) Sea urchin eggs were microinjected with GST-GFP-NLS protein prior to fertilization. In some cases, eggs were co-microinjected with mRNA encoding membrane-mCherry and H2B-RFP. Confocal imaging was performed at 1- or 2-minute intervals. Cumulative data from 12 different embryos are shown. Nucleus number: n=9 (1-cell), n=15 (2-cell), n=29 (4-cell), n=41 (8-cell), n=54 (16-cell), n=58 (32-cell), n=34 (64-cell), n=18 (128-cell), n=29 (256-cell). (A) Representative maximum intensity z-projections from a time lapse are shown. The male and female pronuclei are indicated in the first image. The inset from 8–33 minutes shows nuclear growth in the 1-cell embryo at 2-minute intervals. NEB refers to nuclear envelope breakdown. Also see Video 1 and Fig. S1A. (B) Maximum nuclear cross-sectional (CS) areas were measured in the GFP-NLS channel. Because the nuclei are roughly spherical (Fig. S1B), we multiplied CS area by 4 to estimate nuclear surface area. Developmental stages were aligned based on when intranuclear GFP-NLS signal was first visible. (C) Maximum nuclear surface areas are plotted. (D) Individual nuclear and cell volumes are plotted. Nuclear volumes were extrapolated from CS areas (Fig. S1B). Cell volumes were quantified based on membrane-mCherry localized at the plasma membrane (see Fig. S1C). Note that cell volumes were measured for all developmental stages except for 2- and 4- cell embryos where blastomere volumes were calculated as ½ or ¼ of the 1-cell volume, respectively. (E) Initial nuclear growth rates were calculated based on the first 3–5 time points of each nuclear growth curve. (F-G) Embryos were microinjected with GST-mCherry-NLS protein and were treated with 50 μM roscovitine or an equal volume of DMSO at the 1-cell, 2-cell, or 4-cell stage. Nuclear surface areas were extrapolated from CS areas at one-minute intervals. Note that compared to (A-E), here wide-field imaging was performed with fewer z-planes so size measurements should not be compared between these sets of panels. Control: n=5 (1-cell), n=6 (2-cell), n=7 (4-cell). Roscovitine: n=12 (1-cell), n=10 (2-cell), n=4 (4-cell). Also see Fig. S1H. Error bars represent SD. Scale bars: 20 μm. See also Figures S1, S3, and Videos 1–3.
Figure 2.
Figure 2.. Cell size and nuclear growth are uncoupled in natural and artificial asymmetric cell divisions.
(A-D) 16-cell stage embryos were analyzed from the experiments described in Fig. 1A–E. Cumulative data from three different embryos are shown: n=8 micromeres, n=11 non-micromeres. Also see Video 4. (A) Representative macromere and micromere. (B-D) Nuclear growth curves, maximum nuclear surface areas, and maximum N/C volume ratios are plotted for micromeres and non-micromeres. (E-F) Sea urchin embryos were microinjected with GST-mCherry-NLS protein and magnetic beads. An external magnet was used to induce asymmetric divisions at the first or second cleavage. Also see Video 5. Nuclear surface areas extrapolated from CS areas were quantified at 1-minute intervals based on wide-field imaging. Maximum nuclear surface areas (n=20 small and 20 large blastomeres), initial nuclear growth rates (n=11 small and 11 large blastomeres), N/C volume ratios (n=19 small and 19 large blastomeres). Wide-field imaging was performed with a limited number of z-planes so these size measurements should not be compared to data obtained from confocal imaging. Error bars represent SD. ***, p<0.005; ns, not significant. Scale bars: 20 μm. See also Figures S2–S3 and Videos 4–5.
Figure 3:
Figure 3:. Nuclear growth is unaffected upon increasing the nuclear-tocytoplasmic ratio.
(A-C) Sea urchin eggs were microinjected as described in Figure 1, fertilized, bisected with a glass pipet ~30 min post-fertilization, and imaged by confocal microscopy at five-minute intervals. Cell volumes in halved embryos were on average 58±8% of intact controls. Nuclear growth curves and maximum nuclear surface areas are plotted for halved and intact embryos based on confocal imaging. Developmental stages were aligned based on when intranuclear GFP-NLS signal was first visible. Intact embryo data are the same shown in Fig. 1B–C. Cumulative data from two different halved embryos are shown: n=8 (4-cell), n=11 (8-cell), n=18 (16-cell), n=6 (32-cell). Maximum N/C volume ratios in halved embryos were on average 1.7±0.5 fold greater than in intact controls. (D-E) One-cell embryos were microinjected with GST-mCherry-NLS protein and were treated with 500 nM hesperadin or an equal volume of DMSO. Nuclear surface areas extrapolated from CS areas were quantified for individual nuclei at one-minute intervals based on wide-field imaging. Nuclear growth curves and maximum nuclear surface areas for individual nuclei are plotted. DMSO: n=5 (1-cell), n=10 (2-cell), n=16 (4-cell), n=15 (8-cell). Hesperadin: n=5 (1-nucleus), n=6 (2-nuclei), n=12 (4-nuclei), n=14 (8-nuclei). Wide-field imaging was performed with a limited number of z-planes so these size measurements should not be compared to data obtained from confocal imaging. In hesperadin-treated embryos, we sometimes noted nuclear fusion. Error bars represent SD. ***, p<0.005; ns, not significant. Scale bars: 20 μm. See also Figures S2–S3 and Videos 6
Figure 4.
Figure 4.. Disrupting the amount of perinuclear ER reduces nuclear growth.
(A-C) One-cell sea urchin embryos were fixed at different times after fertilization and immunostained with anti-KDEL and anti-tubulin antibodies. (A) Representative images. (B) To quantify perinuclear ER amount, the mean KDEL intensity within a concentric ring measuring 15 μm from the NE was divided by the mean KDEL intensity of the whole embryo excluding the nucleus. n=7 (5 min), n=14 (10 min), n=14 (15 min), n=16 (20 min), n=11 (30 min), n=10 (40 min). (C) Co-localization of MTs and ER membrane. The arrowheads mark KDEL puncta on MTs. (D-G) One-cell sea urchin embryos microinjected with GST-mCherry-NLS were treated after aster centration with 20 μM nocodazole to depolymerize microtubules (n=7), 50 μM ciliobrevin D to inhibit dynein (n=6), or DMSO (n=8) as a control. (D) Representative images. (E) Nuclear sizes were quantified at one-minute intervals starting with the first appearance of intranuclear mCherry-NLS signal. Wide-field imaging was performed with a limited number of z-planes so these size measurements should not be compared to data obtained from confocal imaging. (F) Maximum nuclear surface areas. (G) Initial nuclear import rates. See Fig. S3 and Methods for details on how import rates were calculated. (H-J) Twenty minutes after fertilization, embryos were treated with 20 μM nocodazole, 50 μM ciliobrevin D, or DMSO as a control. Embryos were fixed 10 minutes later and immunostained with an anti-KDEL antibody. Also see Fig. S4B. (H) Representative images. Note that these KDEL images are the same shown in Fig. S4B for 10 minutes after drug addition. (I) Perinuclear ER amount was quantified as in (B) for 16–27 nuclei per condition. (J) To measure the KDEL distribution relative to the NE, KDEL intensity was quantified within concentric rings expanding away from the NE (see Methods) for 14–15 nuclei per condition. (K) Sea urchin eggs were microinjected with GST-mCherry-NLS protein and mRNA encoding GFP-Rtn4b prior to fertilization. A representative blastula stage embryo is shown to the right. Time lapse confocal imaging was performed at 5-minute intervals for two different GFP-Rtn4b microinjected embryos: n=7 (8-cell), n=19 (16-cell), n=20 (32-cell), n=26 (64-cell). Nuclear growth curves and maximum nuclear surface areas are plotted. Control data are the same shown in Figure 1B–C. Note that protein expressed from microinjected mRNA only begins to accumulate around the 4-cell stage. Error bars represent SD. ***, p<0.005; *, p<0.05; ns, not significant. Scale bars: 20 μm. See also Figure S4.
Figure 5:
Figure 5:. Perinuclear ER volume halves during sequential embryonic divisions.
(A-C) Sea urchin embryos at different developmental stages were fixed and immunostained with anti-KDEL and anti-tubulin antibodies. (A) Representative images are shown. (B) Perinuclear ER volume was quantified from confocal z-stacks (see Fig. S4C and Methods). Cumulative data are shown for fixed KDEL-stained embryos and for live embryos microinjected with mRNA encoding mCherry-KDEL (see Fig. S4D). n=15 cells (1-cell), n=20 cells from 10 embryos (2-cell), n=35 cells from 9 embryos (4-cell), n=23 cells from 3 embryos (8-cell), n=103 cells from 12 embryos (16-cell), n=34 cells from 6 embryos (32-cell), n=63 cells (non-micromeres), n=19 cells (micromeres). (C) Nuclear surface areas were measured for the same cells described in (B). Average nuclear surface areas are plotted as a function of average pER volumes for different stages. (D) Embryos stained with DiI were imaged by time-lapse confocal microscopy. Perinuclear ER volume was quantified from confocal z-stacks (see Fig. S4C and Methods). Cumulative data from 6 embryos are shown. n=6 (1-cell), n=11 (2-cell), n=14 (4-cell), n=20 (8-cell), n=6 (16-cell). Error bars represent SD. ns, not significant. Scale bars: 20 μm. See also Figure S4 and Video 7.
Figure 6:
Figure 6:. Modeling accurately predicts nuclear growth kinetics and scaling of nuclear and ER sizes during early sea urchin development.
Model predictions are overlaid on experimental data for nuclear growth curves, final nuclear sizes, and pER volumes. The modeling output is based on the parameter values reported in STAR Methods. See also Figure S5.
Figure 7.
Figure 7.. Perinuclear ER volume scales nuclear size in vitro.
(A-B) Blastomeres from different stage Xenopus laevis embryos were dissociated, fixed, and stained with antibodies against perinuclear ER sheet marker KTN1 and the NPC (mAb414). (A) Representative confocal images are shown. (B) Perinuclear ER volume was quantified from confocal z-stacks (see Fig. S4C and Methods). Nuclear surface area was extrapolated from CS area. Cumulative data are shown from three different batches of embryos. n=11 (stage 8), n=46 (stage 9), n=14 (stage 10). (C-G) Nucleus and ER formation were induced in fractionated interphase X. laevis egg extract supplemented with membrane dye DiI and GST-GFP-NLS protein. Extract and nuclei were encapsulated in droplets of differing volumes using microfluidic devices. Where indicated, extracts were supplemented with 67 nM recombinant Rtn4b protein, 3.2 μM recombinant p150CC1 dynein inhibitor, or 10% X. laevis light membranes. Confocal z-stacks were acquired after a 3-hour incubation at 16°C. n=55 (control), n=52 (Rtn4b), n=27 (p150CC1), n=26 (more light membrane). (C) The experimental approach. The image of the microfluidic device was adapted with permission from (Hazel, et al., 2013). (D) Representative images of different sized droplets. Imaging of the droplet periphery verified that Rtn4b addition induced a more tubulated cortical ER (data not shown). The droplet boundary is outlined in white in the merged images. (E) Perinuclear ER volume was quantified from DiI images for different size droplets (see Fig. S4C and Methods). Previous studies have established that DiI stains ER membranes in Xenopus extract (Dreier and Rapoport, 2000). Correlation coefficients: 0.60 for control (p<0.0001), 0.87 for Rtn4b (p<0.0001), 0.90 for p150CC1 (p<0.0001). (F) Nuclear CS area was quantified from GFP-NLS images for different size droplets and extrapolated to surface area (see Methods). For individual droplets, nuclear surface area was plotted as a function of the pER volume measured in (E). Correlation coefficient 0.88 for all data (p<0.0001). (G) Perinuclear ER volume and nuclear surface area were quantified as in (E) and (F). Focusing on smaller droplets, a subset of the control data (90–710 pL droplets) is shown in comparison to the “more light membranes” data (110–720 pL droplets). Error bars represent SD. ***, p<0.005; *, p<0.05. Scale bars: 20 μm. See also Figure S6.

Comment in

References

    1. Abrams EW, Zhang H, Marlow FL, Kapp L, Lu S, and Mullins MC (2012). Dynamic assembly of brambleberry mediates nuclear envelope fusion during early development. Cell 150, 521–32. - PMC - PubMed
    1. Anderson DJ, and Hetzer MW (2007). Nuclear envelope formation by chromatin-mediated reorganization of the endoplasmic reticulum. Nat Cell Biol 9, 1160–6. - PubMed
    1. Anderson DJ, and Hetzer MW (2008). Reshaping of the endoplasmic reticulum limits the rate for nuclear envelope formation. J Cell Biol 182, 911–24. - PMC - PubMed
    1. Argiros H, Henson L, Holguin C, Foe V, and Shuster CB (2012). Centralspindlin and chromosomal passenger complex behavior during normal and Rappaport furrow specification in echinoderm embryos. Cytoskeleton (Hoboken) 69, 840–53. - PMC - PubMed
    1. Brownlee C, and Heald R (2019). Importin alpha Partitioning to the Plasma Membrane Regulates Intracellular Scaling. Cell 176, 805–815 e8. - PMC - PubMed

Publication types