. 2020 Jul 2;79(1):30-42.e4.
doi: 10.1016/j.molcel.2020.05.007. Epub 2020 May 29.

Acetyl-CoA Derived from Hepatic Peroxisomal β-Oxidation Inhibits Autophagy and Promotes Steatosis via mTORC1 Activation

Affiliations

Acetyl-CoA Derived from Hepatic Peroxisomal β-Oxidation Inhibits Autophagy and Promotes Steatosis via mTORC1 Activation

Anyuan He et al. Mol Cell. .

Abstract

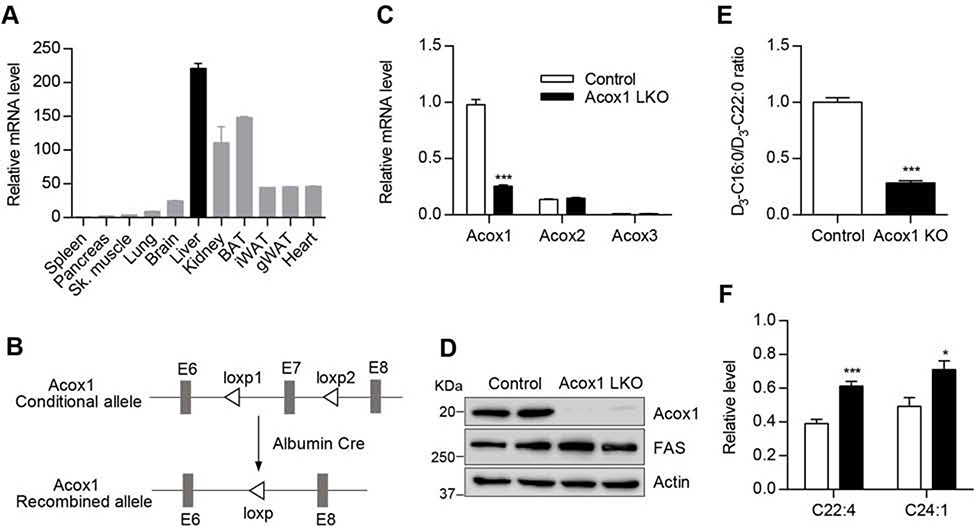
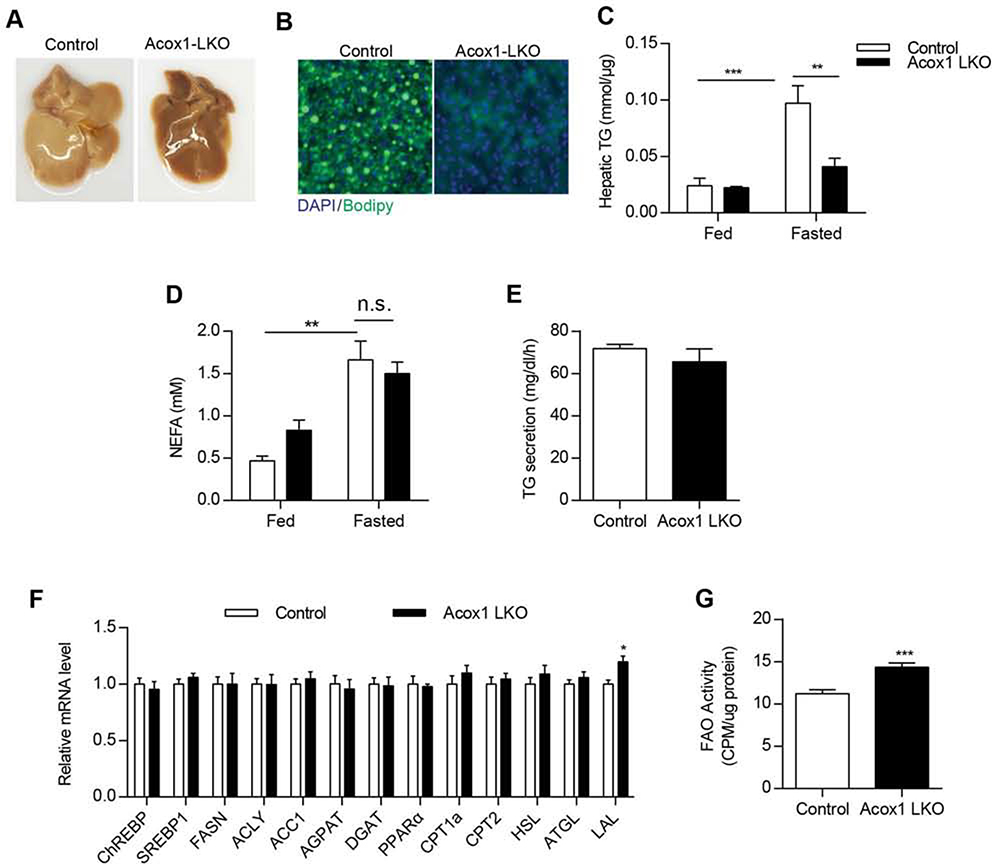
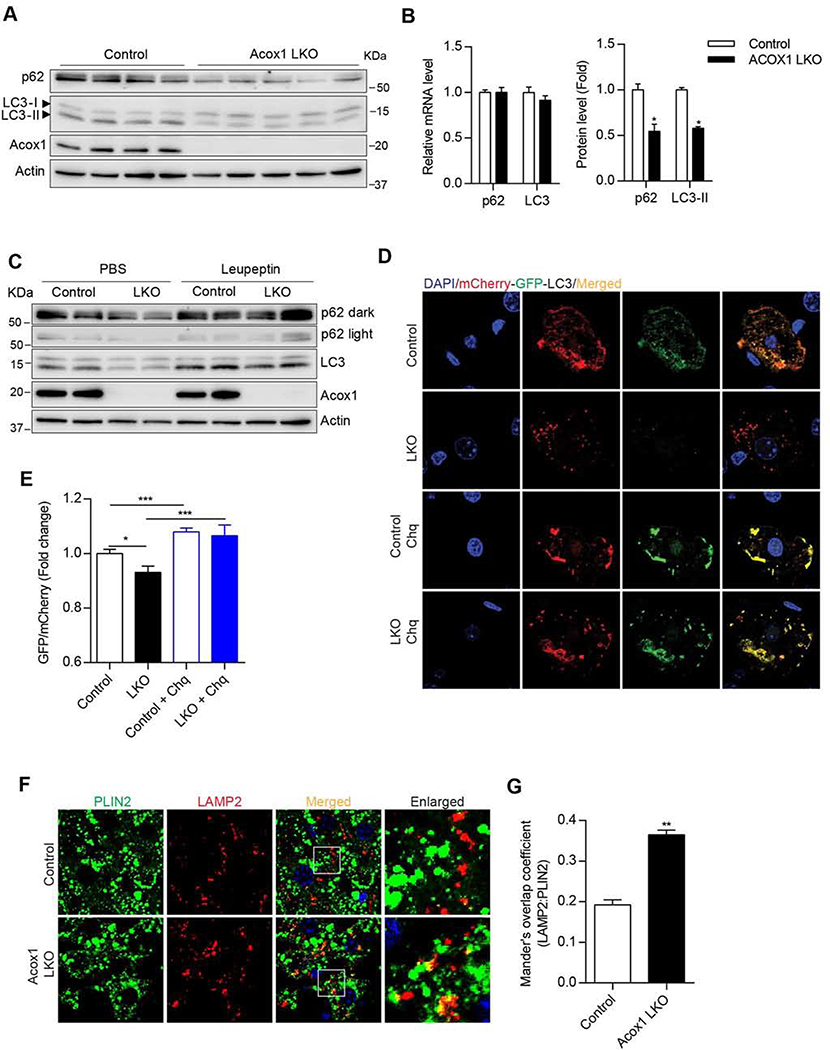
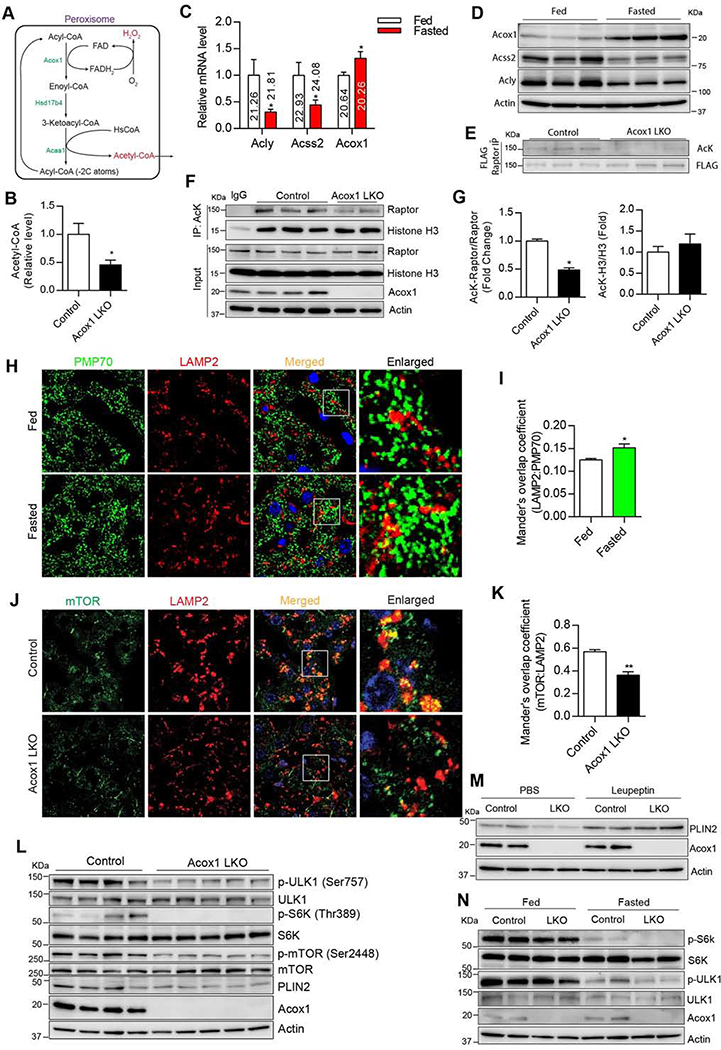
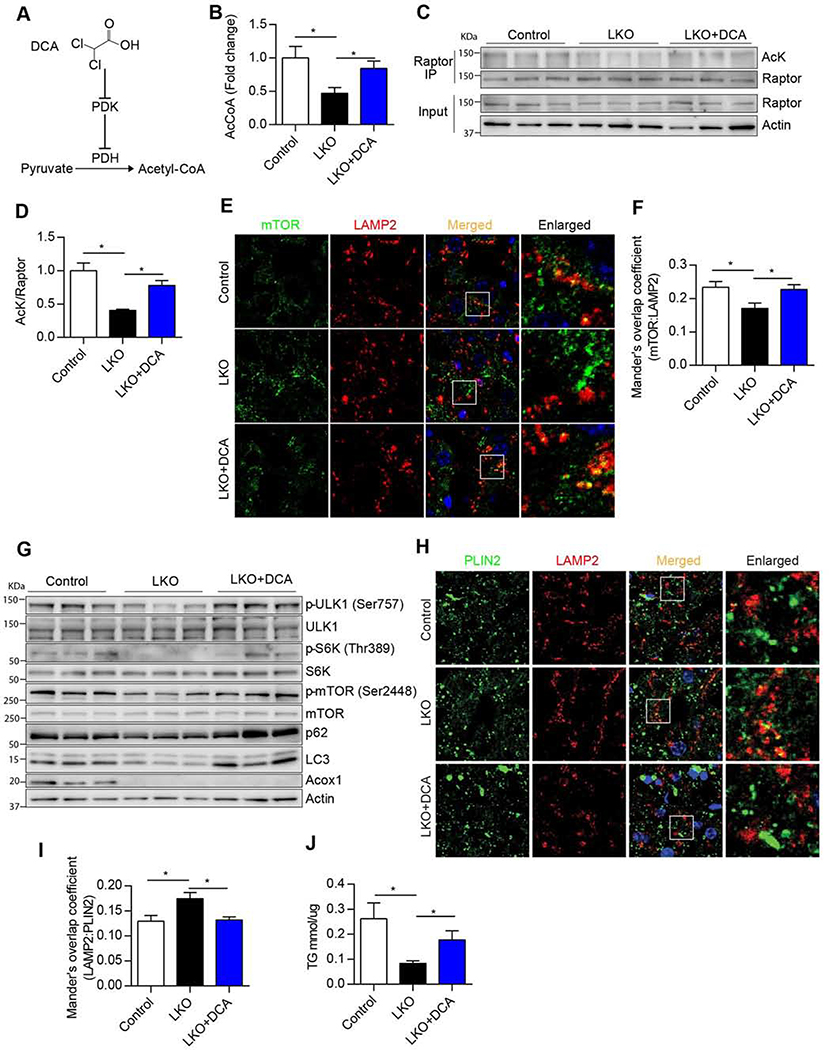
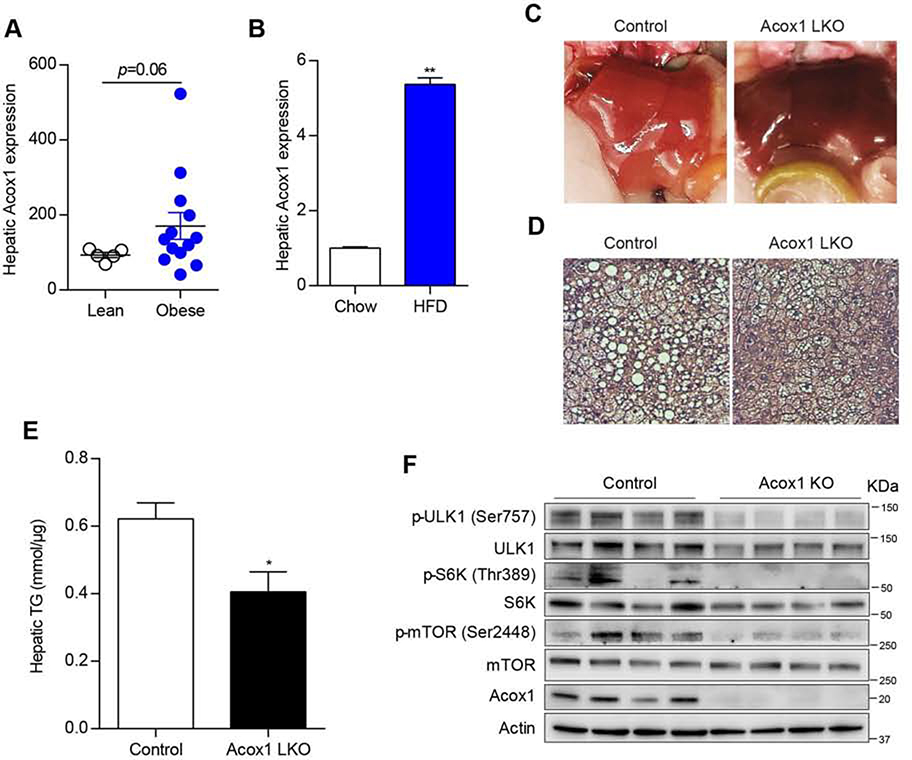
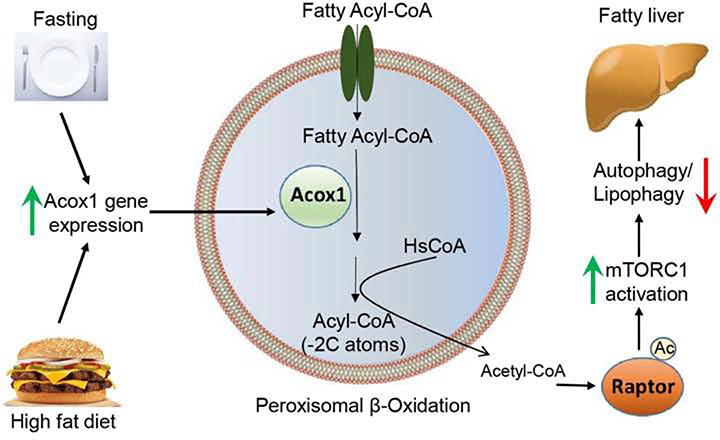
Autophagy is activated by prolonged fasting but cannot overcome the ensuing hepatic lipid overload, resulting in fatty liver. Here, we describe a peroxisome-lysosome metabolic link that restricts autophagic degradation of lipids. Acyl-CoA oxidase 1 (Acox1), the enzyme that catalyzes the first step in peroxisomal β-oxidation, is enriched in liver and further increases with fasting or high-fat diet (HFD). Liver-specific Acox1 knockout (Acox1-LKO) protected mice against hepatic steatosis caused by starvation or HFD due to induction of autophagic degradation of lipid droplets. Hepatic Acox1 deficiency markedly lowered total cytosolic acetyl-CoA levels, which led to decreased Raptor acetylation and reduced lysosomal localization of mTOR, resulting in impaired activation of mTORC1, a central regulator of autophagy. Dichloroacetic acid treatment elevated acetyl-CoA levels, restored mTORC1 activation, inhibited autophagy, and increased hepatic triglycerides in Acox1-LKO mice. These results identify peroxisome-derived acetyl-CoA as a key metabolic regulator of autophagy that controls hepatic lipid homeostasis.

Keywords: Acox1; Autophagy; Lipid metabolism; NAFLD; Raptor; fatty acid oxidation; lipophagy; mTOR; peroxisomes.


Conflict of interest statement

Declaration of interests The authors declare no competing interests.

Figures

Figure 1.
Figure 1.. Generation of mice with liver-specific knockout of Acox1.
A) Acox1 mRNA expression level was measured by quantitative real time PCR in various tissues from wild type C57 mice (n=2). B) Acox1 floxed mice were crossed with albumin-Cre mice to generate Acox1 liver specific knockout mouse. C) Quantitative real time PCR analysis of Acox1, Acox2 and Acox3 expression in the liver of control and Acox1-LKO mice; n = 5–7 per group, ***p < 0.001 (unpaired t-test). D) Western blot analysis of Acox1 knockout in the liver. E) Control and Acox1-KO hepatocytes were incubated with D3-C22:0, whose catabolism to D3-C16:0 was measured by mass spectrometry. FAO was expressed as ratio of D3-C16:0 to D3-C22:0; n = 4, ***p < 0.001 (unpaired t-test). F) Levels of VLCFA in the livers of Acox1-LKO and control mice; n = 6–8 per group), *p < 0.05; ***p < 0.00l (unpaired t-test). Data represent mean ± SEM. See also Figure S1.
Figure 2.
Figure 2.. Acox1-LKO mice are protected from starvation-induced fatty liver.
A) Gross images of livers from 8–10 weeks old control and Acox1-LKO female mice that were fasted for 24 hours. B) Liver frozen sections from control and Acox1-LKO mice fasted for 24 hours were stained with Bodipy (Green) and DAPI (Blue). C) Liver homogenate from control or Acox1-LKO mice fed or fasted for 24 hours were used for triglyceride content measurement; n = 6–10, **p<0.0l, **p<0.00l (unpaired t-test). D) Non-esterified fatty acid levels measured in serum from control and Acox1-LKO female mice that were fed or fasted for 24 hours; n = 6, **p < 0.01 (unpaired t-test). E) Rate of triglyceride secretion calculated from the slope of the increase in plasma triglycerides after P-407 treatment in fasted female mice (n=7–10/group). F) Hepatic gene expression analysis in Acox1-LKO and control mice; n = 6–7, *p < 0.05 (unpaired t-test). G) Mitochondria fatty acid oxidation activity was measured by using l4C-labeled palmitate; n = 6, ***p < 0.001 (unpaired t-test). Data represent mean ± SEM. See also Figure S2.
Figure 3.
Figure 3.. Acox1-LKO mice exhibit activation of autophagy/lipophagy in the liver.
A) Western blot analysis of autophagy markers p62 and LC3 for 8-l0 weeks old female mice fasted for 4 hours. B) Protein levels, but not the mRNA levels, of p62 and LC3 were decreased in the Acox1-LKO liver; n = 4–7, *p < 0.05 (unpaired t-test). C) Western blot analysis of autophagic flux in control and Acox1-LKO mice treated with leupeptin for four hours without diet. D-E) Assessment of autophagy flux using lentiviral mCherry-GFP dual tandem-tagged LC3 in the presence or absence of chloroquine (Chq) in the livers of Acox1-LKO and control mice. Images are representative of at least three independent experiments; n = 12, *p < 0.05, ***p < 0.001 (unpaired t-test). F-G) Colocalization between lipid droplet (PLIN2) and lysosome (LAMP2) was increased in Acox1-LKO liver as compared to the control liver of mice fasted for three hours. Images are representative of at least three independent experiments; n = 10, **p < 0.01 (unpaired t-test). Data represent mean ± SEM. See also Figure S3.
Figure 4
Figure 4. Hepatic Acox1 inactivation decreases acetyl-CoA levels, resulting in impaired mTORC1 activation.
A) Peroxisomal β-oxidation pathway. B) Acetyl-CoA measurement in the livers of 8–10 weeks old control and Acox1-LKO female mice that were fasted overnight; n = 6–7, *p < 0.05 (unpaired t-test). C) Hepatic gene expression analysis of ACLY, ACSS2 and Acox1 in wild-type C57 mice that were subjected to a 24 hour fasting. Ct values are shown on histograms; n = 6, *p < 0.05 (unpaired t-test). D) Western blot analysis of Acox1, ACSS2 and ACLY expression in the livers of fed and fasted mice (n=3/group). E) FLAG-Raptor plasmid was delivered to mouse liver by hydrodynamic tail vein injection, followed by anti-FLAG immunoprecipitation and immunoblotting using anti-acetylated lysine (AcK) and FLAG antibodies (n=3/group). F-G) Lysine acetylation of endogenous Raptor and histone H3 was analyzed in livers of fasted Acox1-LKO and control mice by immunoprecipitation using an anti-AcK antibody, followed by Western blot analysis using anti-Raptor and H3 antibodies; n=3, *p < 0.05 (unpaired t-test). H-I) Immunofluorescence analysis using antibodies against PMP70 and LAMP2 suggesting that fasting promotes contact between peroxisomes and lysosomes in liver of mice fasted for 4 hours. n = 11, *p < 0.05 (unpaired t-test). J-K) The localization of mTOR to lysosome was inhibited in Acox1-LKO liver, as assessed by the decreased colocalization between mTOR and LAMP2. Images are representative of at least three independent experiments; n=10, ** p < 0.01 (unpaired t-test). L) mTOR activation was inhibited in the Acox1-LKO liver as shown by the decreased phosphorylation of mTOR (Ser2448), S6K (Thr389) and ULK1 (Ser757); n=4–5/group. M) Acox1 knockout promotes autophagic flux of PLIN2 in liver of mice treated with leupeptin for 4 hours without diet (n=2/condition). N) Effect of Acox1 knockout on phosphorylation of mTOR targets under fed or fasting conditions (n=2/group). Data represent mean ± SEM. See also Figure S4.
Figure 5.
Figure 5.. Increasing acetyl-CoA levels restores mTORC1 activation, inhibits autophagy and elevates triglyceride levels in Acox1-LKO mice.
A) Schematic illustrating the role of dichloroacetic acid (DCA) in acetyl-CoA production through pyruvate dehydrogenase (PDH) activation. B) Liver acetyl-CoA levels in 8–10 weeks old female mice i.p. treated with 250 mg/kg DCA or vehicle for 3 consecutive days; n = 5–7, *p < 0.05 (unpaired t-test). C-D) Endogenous Raptor was immunoprecipitated from liver homogenates using an anti-Raptor antibody, followed by Western blot analysis using antibodies against acetylated-lysine (AcK), Raptor or actin; n = 3, *p < 0.05 (unpaired t-test). E-F) DCA restores lysosomal localization of mTOR in Acox1-LKO liver. n = 13–16, *p < 0.05 (unpaired t-test). G) Western blot analysis of mTORC1 activation and autophagy inhibition in the livers of mice treated with or without DCA as indicated (n=3/group). H-I) DCA inhibits lysosomal localization of PLIN2 in Acox1-LKO liver; n=12, *p < 0.05 (unpaired t-test). J) Liver TG content in female mice treated with or without DCA; n = 8, *p <0.05 (unpaired t-test). Data represent mean ± SEM. See also Figure S5.
Figure 6.
Figure 6.. Acox1-LKO mice are protected from HFD-induced fatty liver.
A) Liver gene expression of Acox1 in obese humans undergoing gastric bypass surgery or lean controls undergoing elective cholecystectomy. The data were extracted from GEO database (Reference ID: 71078077). n = 5–13 (unpaired t-test). B) Hepatic Acox1 gene expression in 8–10 weeks old wild-type C57 male mice fed normal chow diet or a HFD for 4 months; n = 5–7, **p < 0.01 (unpaired t-test). C) Gross liver images in HFD-fed mice. D) H&E staining of liver sections from HFD-fed male mice. E) Hepatic triglyceride content in HFD-fed mice; n = 6–7, *p < 0.05 (unpaired t-test). F) Western blot analysis of mTORC1 activation in HFD-fed Acox1-LKO and control male mice (n=4/group). Data represent mean ± SEM.
Figure 7.
Figure 7.
A model depicting proposed molecular mechanism through which peroxisomal β-oxidation regulates mTORC1 activation to inhibit lipophagy.

References

    1. Carrer A, Parris JL, Trefely S, Henry RA, Montgomery DC, Torres A, Viola JM, Kuo YM, Blair IA, Meier JL, et al. (2017). Impact of a High-fat Diet on Tissue Acyl-CoA and Histone Acetylation Levels. J Biol Chem 292, 3312–3322. - PMC - PubMed
    1. Chu BB, Liao YC, Qi W, Xie C, Du X, Wang J, Yang H, Miao HH, Li BL, and Song BL (2015). Cholesterol transport through lysosome-peroxisome membrane contacts. Cell 161, 291–306. - PubMed
    1. Cingolani F, and Czaja MJ (2016). Regulation and Functions of Autophagic Lipolysis. Trends Endocrinol Metab 27, 696–705. - PMC - PubMed
    1. Cui W, Sathyanarayan A, Lopresti M, Aghajan M, Chen C, and Mashek DG (2020). Lipophagy-derived fatty acids undergo extracellular efflux via lysosomal exocytosis. Autophagy, 1–16. - PMC - PubMed
    1. DeBosch BJ, Heitmeier MR, Mayer AL, Higgins CB, Crowley JR, Kraft TE, Chi M, Newberry EP, Chen Z, Finck BN, et al. (2016). Trehalose inhibits solute carrier 2A (SLC2A) proteins to induce autophagy and prevent hepatic steatosis. Sci Signal 9, ra21. - PMC - PubMed

Publication types

MeSH terms

LinkOut - more resources