

Mechanism of baricitinib supports artificial intelligence-predicted testing in COVID-19 patients
- PMID: 32473600
- PMCID: PMC7300657
- DOI: 10.15252/emmm.202012697
Mechanism of baricitinib supports artificial intelligence-predicted testing in COVID-19 patients
Abstract
Baricitinib is an oral Janus kinase (JAK)1/JAK2 inhibitor approved for the treatment of rheumatoid arthritis (RA) that was independently predicted, using artificial intelligence (AI) algorithms, to be useful for COVID-19 infection via proposed anti-cytokine effects and as an inhibitor of host cell viral propagation. We evaluated the in vitro pharmacology of baricitinib across relevant leukocyte subpopulations coupled to its in vivo pharmacokinetics and showed it inhibited signaling of cytokines implicated in COVID-19 infection. We validated the AI-predicted biochemical inhibitory effects of baricitinib on human numb-associated kinase (hNAK) members measuring nanomolar affinities for AAK1, BIKE, and GAK. Inhibition of NAKs led to reduced viral infectivity with baricitinib using human primary liver spheroids. These effects occurred at exposure levels seen clinically. In a case series of patients with bilateral COVID-19 pneumonia, baricitinib treatment was associated with clinical and radiologic recovery, a rapid decline in SARS-CoV-2 viral load, inflammatory markers, and IL-6 levels. Collectively, these data support further evaluation of the anti-cytokine and anti-viral activity of baricitinib and support its assessment in randomized trials in hospitalized COVID-19 patients.
Keywords: COVID-19; anti-cytokine; anti-viral; baricitinib; case series.
© 2020 Eli Lilly and Company Published under the terms of the CC BY 4.0 license.
Conflict of interest statement
JS is editor‐in‐chief of Oncogene. JS has sat on a number of scientific advisory boards, including BenevolentAI, and consults with Lansdowne partners and Vitruvian, and since these findings in patients, consults with Eli Lilly and Company; he sits on the Board of Directors for BB Biotech Healthcare Trust. VML is the founder, CEO, and shareholder of HepaPredict AB. In addition, VML discloses consultancy work for EnginZyme AB. VM, AM, SO, MC, and GC report no conflicts of interest. PJR is an employee of BenevolentAI. VK, SdB, JART, BJN, REH, GR, NLB, DES, AN, and AC are employees and shareholders of Eli Lilly and Company.
Figures
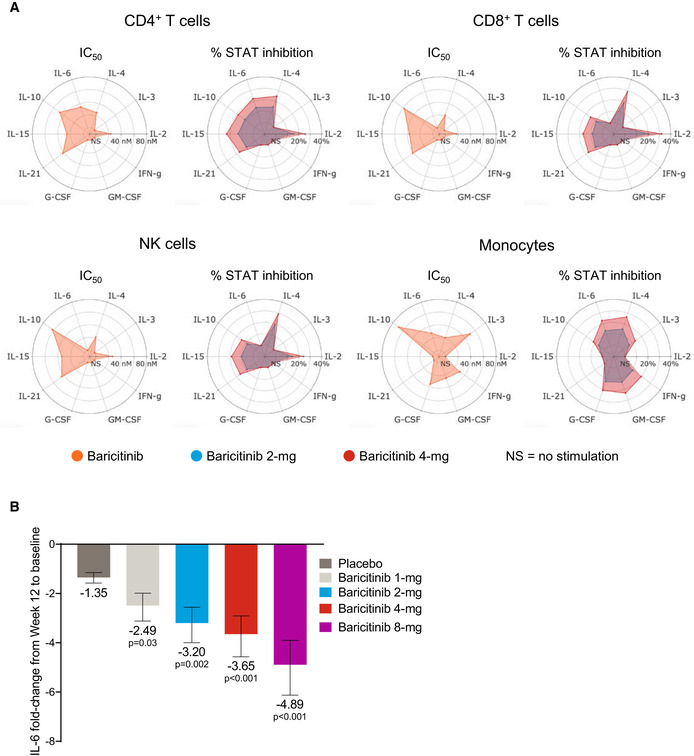
- A
IC50 values for baricitinib (orange) in cytokine‐stimulated human CD4+ T cells, CD8+ T cells, NK cells, and monocytes are shown for IL‐2/pSTAT5, IL‐4/pSTAT6, IL‐3/pSTAT5, IL‐6/pSTAT3, IL‐10/pSTAT3, IL‐15/pSTAT5, IL‐21/pSTAT3, G‐CSF/pSTAT3, GM‐CSF/pSTAT5, and IFN‐γ/pSTAT1. Average daily percent STAT inhibition was calculated using in vitro concentration–response curves and published human exposure data. Cytokine treatments that did not result in sufficient pSTAT stimulation are denoted as “NS” in the radar plots.
- B
Fold change ± standard error in baseline IL‐6 plasma levels at week 12 from RA patients treated with placebo (n = 47), and baricitinib 1 mg (n = 23), 2 mg (n = 24), 4 mg (n = 23), and 8 mg (n = 23) in the phase 2b randomized, placebo‐controlled study NCT01469013. P values are for comparisons of baricitinib 1, 2, 4, and 8 mg change from baseline compared with the placebo change from baseline. Treatment effects were estimated using a mixed‐effects repeated‐measures model (SAS Proc Mixed) using log10‐transformed IL‐6 levels with an unstructured covariance matrix.
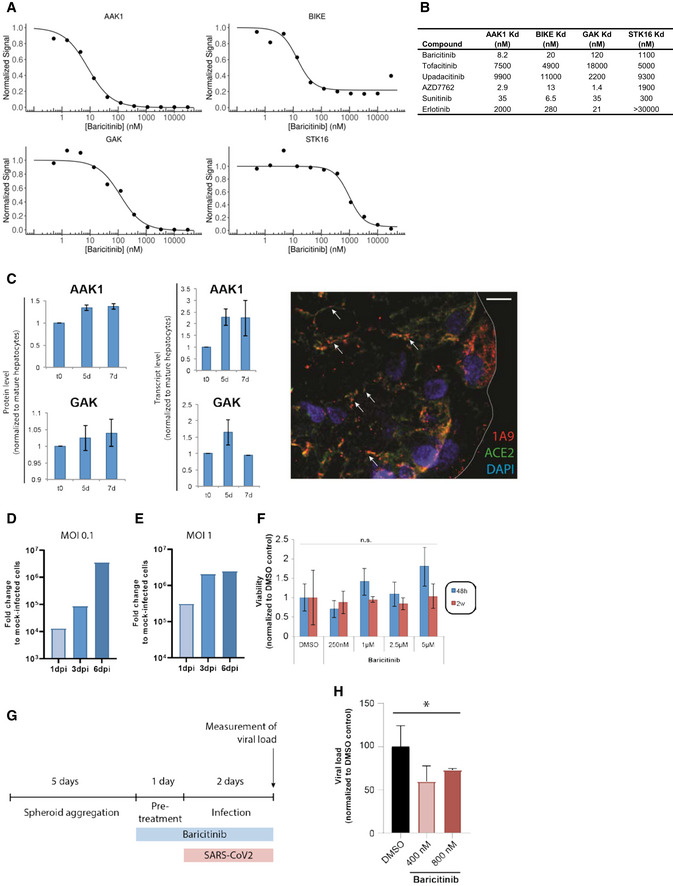
- A, B
Binding affinities in equilibrium affinity constant (Kd) are shown for baricitinib (A and B), tofacitinib, upadacitinib, AZD7762 (positive control), and broad‐spectrum tyrosine kinase inhibitors sunitinib and erlotinib (B). Kd values were estimated from an 11‐point concentration–response curve with fixed top parameters and a four‐parameter logistic model (n = 3).
- C
Protein and mRNA expression of relevant numb‐associated kinases in primary human liver organoids (n = 3) (P < 0.05). The immunofluorescence shows the juxtaposition of 1A9 (detecting spike protein from the SARS‐CoV‐2) in red and ACE2 in green along with the spheroid nuclei in blue as a DAPI stain (n = 1). Colocalization of spike and ACE2 is depicted with an arrow.
- D, E
Time course of days (one, three, and six days) post‐infection (dpi) using liver spheroids and SARS‐CoV‐2 at 0.1 and 1.0 multiplicity of infection (MOI) (n = 1).
- F
Viability of spheroids was quantified by measuring intracellular ATP concentrations. Note that no significant (n.s.; Student's t‐test) decrease in cell viability was observed for any concentration tested (n = 10).
- G
Schematic showing the timeline for the experiment shown in panel H.
- H
Viral load in infected (MOI 0.1) spheroids as measured by qPCR after treatment with 400 and 800 nM of baricitinib 48 h after infection (*P < 0.05; Student's t‐test). Data are mean ± standard error of mean (n = 3).
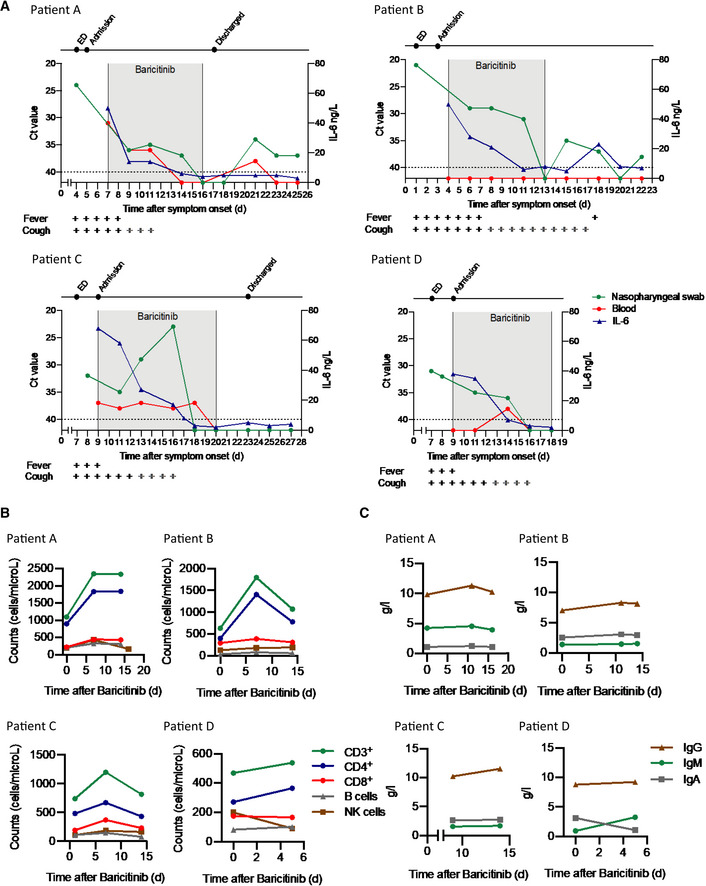
- A
Detection of SARS‐CoV‐2 in nasopharyngeal swabs and peripheral blood using the GeneFinder™ COVID‐19 Plus RealAmp Kit assay (ELITechGroup S.p.A., Turin, Italy). Three viral target genes, RdRp, N, and E, together with the housekeeping gene GAPDH, were simultaneously amplified. Here, the most sensitive target gene, N, is shown. Samples with Ct values > 40 were defined as negative. A dashed horizontal line indicates the cutoff. IL‐6 values are shown in the same graph. Time of baricitinib treatment is highlighted (Patients A, B, and D for 10 days, Patient C for 12 days) with total time of evaluation on the x‐axis. Fever and cough symptoms are indicated. The bars in gray indicate that cough has improved but has not resolved.
- B
Levels of CD3+, CD4+, CD8+, B cells (CD19+), and NK cells (CD3−, CD16+, CD56+) were determined using the AQUIOS CL Flow Cytometry System (Beckman Coulter).
- C
Total serum IgG, IgA, and IgM levels are shown for all patients.
- A
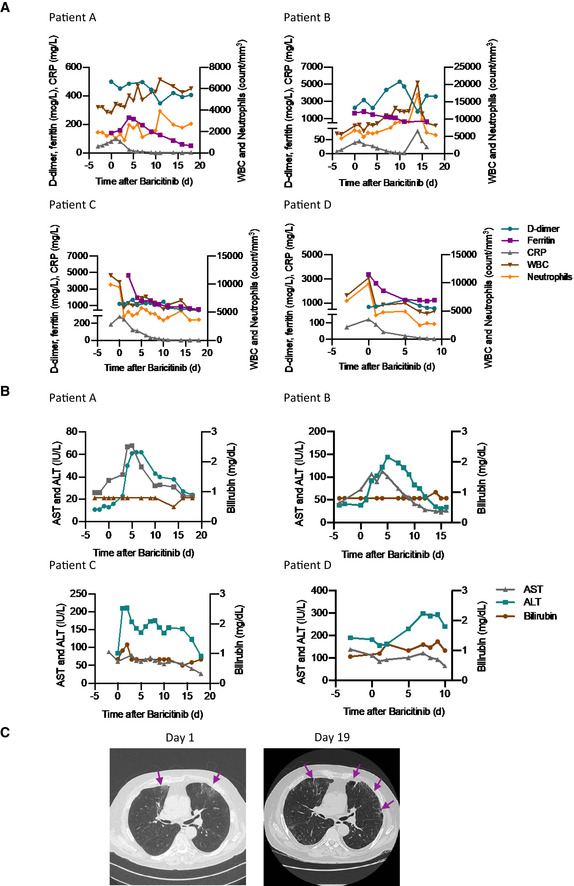
Levels of D‐dimer, CRP, ferritin, white blood cells, and neutrophils are shown for all patients.
- B
Levels of aspartate aminotransferase, alanine aminotransferase, and bilirubin are shown for all patients.
- C
Chest CT scan for Patient C on day 1 and day 19 from symptom onset showing clinical improvement over time. Day 1 CT scan shows ground‐glass opacity (arrows) sub‐pleurally in the lower lobes bilaterally (early stage one according to Pan et al, 2020). Day 19 CT scan shows that consolidation was gradually absorbed with evident residual fibrosis and emphysema bubbles (arrows) in the site of the early lesions (absorption stage 4 according to Pan et al, 2020).
Comment in
-
Can artificial intelligence identify effective COVID-19 therapies?EMBO Mol Med. 2020 Aug 7;12(8):e12817. doi: 10.15252/emmm.202012817. Epub 2020 Jul 7. EMBO Mol Med. 2020. PMID: 32569446 Free PMC article.
References
-
- Bell CC, Lauschke VM, Vorrink SU, Palmgren H, Duffin R, Andersson TB, Ingelman‐Sundberg M (2017) Transcriptional, functional, and mechanistic comparisons of stem cell‐derived hepatocytes, HepaRG cells, and three‐dimensional human hepatocyte spheroids as predictive in vitro systems for drug‐induced liver injury. Drug Metab Dispos 45: 419–429 - PMC - PubMed
-
- Cameron MJ, Ran L, Xu L, Danesh A, Bermejo‐Martin JF, Cameron CM, Muller MP, Gold WL, Richardson SE, Poutanen SM et al (2007) Interferon‐mediated immunopathological events are associated with atypical innate and adaptive immune responses in patients with severe acute respiratory syndrome. J Virol 81: 8692–8706 - PMC - PubMed
Publication types
MeSH terms
Substances
Grants and funding
LinkOut - more resources
Full Text Sources
Research Materials
Miscellaneous
