

Potential dual functional roles of the Y-linked RBMY in hepatocarcinogenesis
- PMID: 32473614
- PMCID: PMC7419034
- DOI: 10.1111/cas.14506
Potential dual functional roles of the Y-linked RBMY in hepatocarcinogenesis
Abstract
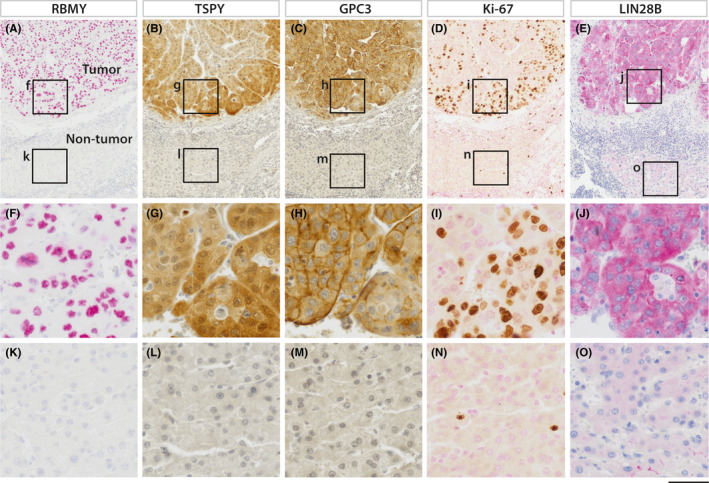
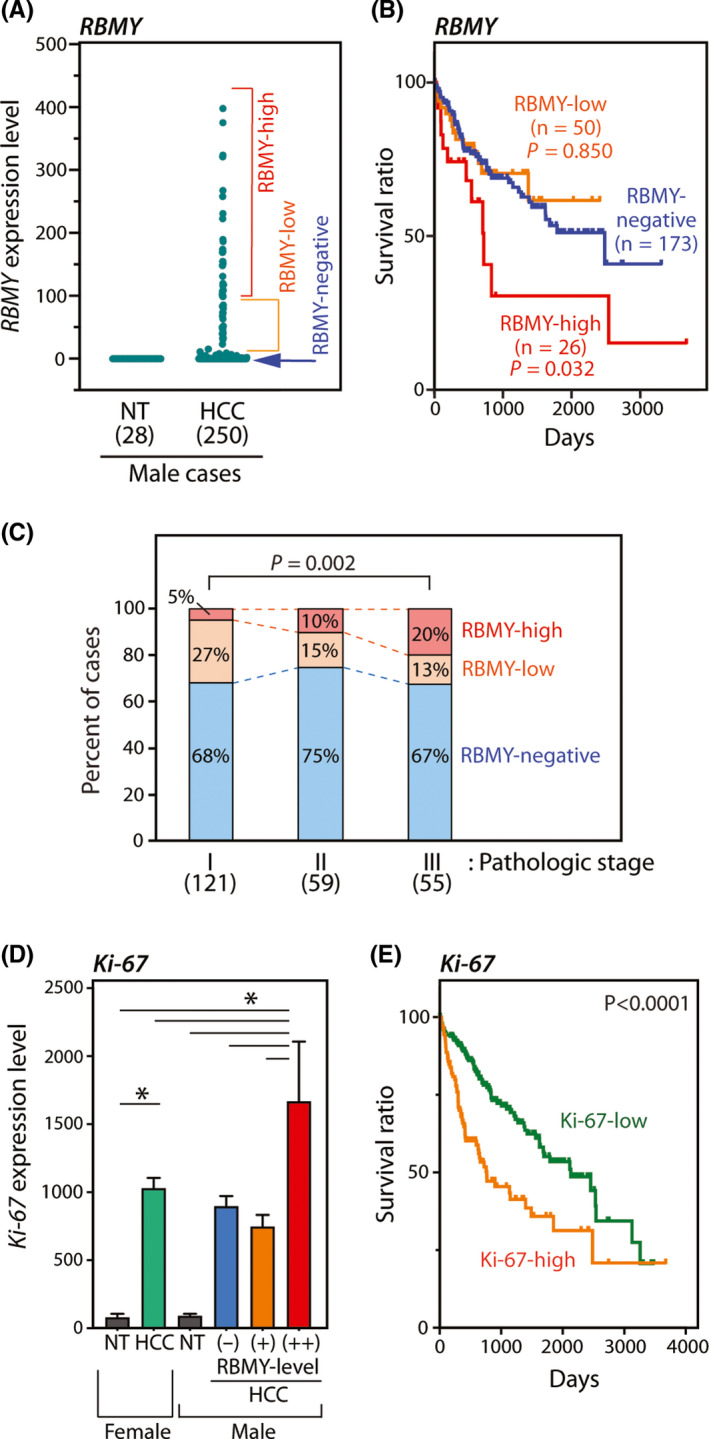
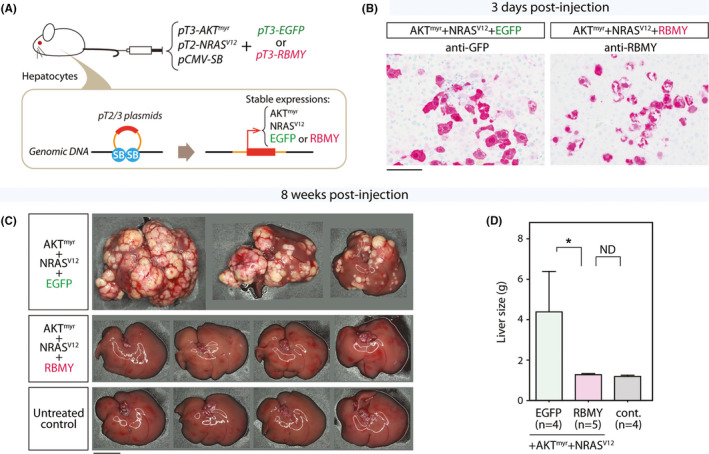
Hepatocellular carcinoma (HCC) is a highly heterogeneous liver cancer with significant male biases in incidence, disease progression, and outcomes. Previous studies have suggested that genes on the Y chromosome could be expressed and exert various male-specific functions in the oncogenic processes. In particular, the RNA-binding motif on the Y chromosome (RBMY) gene is frequently activated in HCC and postulated to promote hepatic oncogenesis in patients and animal models. In the present study, immunohistochemical analyses of HCC specimens and data mining of The Cancer Genome Atlas (TCGA) database revealed that high-level RBMY expression is associated with poor prognosis and survival of the patients, suggesting that RBMY could possess oncogenic properties in HCC. To examine the immediate effect(s) of the RBMY overexpression in liver cancer cells, cell proliferation was analyzed on HuH-7 and HepG2 cells. The results unexpectedly showed that RBMY overexpression inhibited cell proliferation in both cell lines as its immediate effect, which led to vast cell death in HuH-7 cells. Transcriptome analysis showed that genes involved in various cell proliferative pathways, such as the RAS/RAF/MAP and PIP3/AKT signaling pathways, were downregulated by RBMY overexpression in HuH-7 cells. Furthermore, in vivo analyses in a mouse liver cancer model using hydrodynamic tail vein injection of constitutively active AKT and RAS oncogenes showed that RBMY abolished HCC development. These findings support the notion that Y-linked RBMY could serve dual tumor-suppressing and tumor-promoting functions, depending on the spatiotemporal and magnitude of its expression during oncogenic processes, thereby contributing to sexual dimorphisms in liver cancer.
Keywords: RBMY; TCGA dataset; Y chromosome; hepatocellular carcinoma; transcriptome analysis.
© 2020 The Authors. Cancer Science published by John Wiley & Sons Australia, Ltd on behalf of Japanese Cancer Association.
Conflict of interest statement
The authors have no conflict of interest.
Figures


Similar articles
-
Male germ cell-specific RNA binding protein RBMY: a new oncogene explaining male predominance in liver cancer.PLoS One. 2011;6(11):e26948. doi: 10.1371/journal.pone.0026948. Epub 2011 Nov 4. PLoS One. 2011. PMID: 22073224 Free PMC article.
-
RBMY, a novel inhibitor of glycogen synthase kinase 3β, increases tumor stemness and predicts poor prognosis of hepatocellular carcinoma.Hepatology. 2015 Nov;62(5):1480-96. doi: 10.1002/hep.27996. Epub 2015 Aug 25. Hepatology. 2015. PMID: 26185016
-
PIM1-Induced Cytoplasmic Expression of RBMY Mediates Hepatocellular Carcinoma Metastasis.Cell Mol Gastroenterol Hepatol. 2023;15(1):121-152. doi: 10.1016/j.jcmgh.2022.09.014. Epub 2022 Oct 1. Cell Mol Gastroenterol Hepatol. 2023. PMID: 36191855 Free PMC article.
-
Role of DLC1 tumor suppressor gene and MYC oncogene in pathogenesis of human hepatocellular carcinoma: potential prospects for combined targeted therapeutics (review).Int J Oncol. 2012 Aug;41(2):393-406. doi: 10.3892/ijo.2012.1474. Epub 2012 May 10. Int J Oncol. 2012. PMID: 22580498 Free PMC article. Review.
-
Exploring RNA binding proteins in hepatocellular carcinoma: insights into mechanisms and therapeutic potential.J Exp Clin Cancer Res. 2025 Apr 24;44(1):130. doi: 10.1186/s13046-025-03395-7. J Exp Clin Cancer Res. 2025. PMID: 40275278 Free PMC article. Review.
Cited by
-
Molecular basis of sex differences in cancer: Perspective from Asia.iScience. 2023 Jun 12;26(7):107101. doi: 10.1016/j.isci.2023.107101. eCollection 2023 Jul 21. iScience. 2023. PMID: 37404373 Free PMC article. Review.
-
Development and validation of a 5K low-density SNP chip for Hainan cattle.BMC Genomics. 2024 Sep 18;25(1):873. doi: 10.1186/s12864-024-10753-w. BMC Genomics. 2024. PMID: 39294563 Free PMC article.
-
Androgen receptor variant 7 exacerbates hepatocarcinogenesis in a c-MYC-driven mouse HCC model.Oncogenesis. 2023 Feb 6;12(1):4. doi: 10.1038/s41389-023-00449-3. Oncogenesis. 2023. PMID: 36746917 Free PMC article.
-
The RNA-Binding Motif Protein Family in Cancer: Friend or Foe?Front Oncol. 2021 Nov 4;11:757135. doi: 10.3389/fonc.2021.757135. eCollection 2021. Front Oncol. 2021. PMID: 34804951 Free PMC article. Review.
-
The LncRNA DUXAP10 Could Function as a Promising Oncogene in Human Cancer.Front Cell Dev Biol. 2022 Feb 3;10:832388. doi: 10.3389/fcell.2022.832388. eCollection 2022. Front Cell Dev Biol. 2022. PMID: 35186937 Free PMC article. Review.
References
-
- Global Burden of Disease Cancer, Collaboration . Global, Regional, and National Cancer Incidence, Mortality, Years of Life Lost, Years Lived With Disability, and Disability‐Adjusted Life‐Years for 29 Cancer Groups, 1990 to 2016: a systematic analysis for the global burden of disease study. JAMA Oncol. 2018;4:1553‐1568. - PMC - PubMed
-
- Bray F, Ferlay J, Soerjomataram I, Siegel RL, Torre LA, Jemal A. Global cancer statistics 2018: GLOBOCAN estimates of incidence and mortality worldwide for 36 cancers in 185 countries. CA Cancer J Clin. 2018;68:394‐424. - PubMed
-
- World Cancer Research Fund International . Liver cancer statistics. 2019; https://www.wcrf.org/dietandcancer/cancer‐trends/liver‐cancer‐statistics
-
- El‐Serag HB, Rudolph KL. Hepatocellular carcinoma: epidemiology and molecular carcinogenesis. Gastroenterology. 2007;132:2557‐2576. - PubMed
MeSH terms
Substances
Grants and funding
LinkOut - more resources
Full Text Sources
Medical
Molecular Biology Databases
Research Materials
Miscellaneous
