. 2020 Jul 13;38(1):60-78.e12.
doi: 10.1016/j.ccell.2020.05.001. Epub 2020 May 30.

MYC Drives Temporal Evolution of Small Cell Lung Cancer Subtypes by Reprogramming Neuroendocrine Fate

Affiliations

MYC Drives Temporal Evolution of Small Cell Lung Cancer Subtypes by Reprogramming Neuroendocrine Fate

Abbie S Ireland et al. Cancer Cell. .

Abstract

Small cell lung cancer (SCLC) is a neuroendocrine tumor treated clinically as a single disease with poor outcomes. Distinct SCLC molecular subtypes have been defined based on expression of ASCL1, NEUROD1, POU2F3, or YAP1. Here, we use mouse and human models with a time-series single-cell transcriptome analysis to reveal that MYC drives dynamic evolution of SCLC subtypes. In neuroendocrine cells, MYC activates Notch to dedifferentiate tumor cells, promoting a temporal shift in SCLC from ASCL1+ to NEUROD1+ to YAP1+ states. MYC alternatively promotes POU2F3+ tumors from a distinct cell type. Human SCLC exhibits intratumoral subtype heterogeneity, suggesting that this dynamic evolution occurs in patient tumors. These findings suggest that genetics, cell of origin, and tumor cell plasticity determine SCLC subtype.

Keywords: ASCL1; MYC; NEUROD1; NOTCH; SCLC; YAP1; mouse models; neuroendocrine; plasticity; tumor evolution.


Conflict of interest statement

Declaration of Interests T.G.O. has pending patent applications related to subtype stratification of SCLC: US16/335368, JP2019522392, and EP2017865057.

Figures

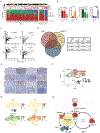
Figure 1.
Figure 1.. MYC drives multiple SCLC molecular subtypes in vivo
(A) Representative immunohistochemistry (IHC) for NE markers in early-stage (in situ) or invasive tumors in indicated GEMMs infected with Ad-Cgrp-Cre. (B) IHC quantification from panel A. (C) Representative IHC for non-NE markers in in situ or invasive tumors in indicated GEMMs infected with Ad-Cgrp-Cre. (D) IHC quantification from panel C. (E) Representative IHC for POU2F3 in in situ or invasive tumors in indicated GEMMs infected with cell-type-specific Cre viruses. Positive control (+) is adult mouse skin. IHC quantification in right panel. (F) Percent RPM tumors per animal that are POU2F3+ by IHC following cell-type-specific Cre viral infection. Indicated p values relative to Cmv. (G) Left panel: Percent of POU2F3+ (P) tumors expressing subtype markers analyzed by IHC from serial sections (n = 27 total tumors). Right panel: Average percentage of positive cells for each marker within individual POU2F3+ tumors. (H) Representative IHC from serial sections of POU2F3+ tumors analyzed for SCLC subtype markers. Left color label indicates classification as in panel G. Data from n = 6-9 mice per genotype, except Ccsp- and Spc-Cre mice are n = 5. Number of tumors scored by manual H-Score method is indicated within bar graphs. Scale bars, 25 μm. Mean +/− standard error of the mean (SEM), Student’s two-tailed unpaired t test, * p < 0.045, ** p < 0.009, *** p = 0.002, **** p < 0.0001, ns = not significant. See also Figure S1.
Figure 2.
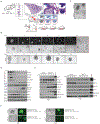
Figure 2.. MYC drives SCLC subtype evolution in vitro
(A) Schematic of early RPM tumor cell isolation and culture. From left to right: whole slide H&E with bottom lung lobe (dashed box) provided in higher magnification inset (scale bar, 500 μm), with successive magnification of airway lesions (scale bar, 100 μm) with in situ tumors (red and blue boxes) labeled in right top panels (scale bars, 10 μm). IHC of serial sections of the same tumors (scale bars, 10 μm). Lungs were dissociated and single cell suspensions placed in culture. (B) Representative brightfield images of tumor cells in culture at indicated days following plating. Scale bars, 200 (top row), 100 (middle and bottom rows) and 50 (red inset) μm. Representative of > 60 independent assays for RPM cells and 5 assays for RPR2 cells. (C) Representative brightfield images of human classic (H1092) and variant (H82) cell lines. Scale bar, 100 μm. (D) Representative immunoblot on specified days following culture of early stage RPM tumor cells. Representative of n = 5 independent assays. Bands normalized to HSP90 values, with fold-change relative to Day 5 (red and black graphs) or Day 24 (blue graphs) and averaged across 3-5 experiments. (E) Representative immunoblot on specified days following puromycin selection from H889 (left) or H1963 (right) cells infected with vector control or MYCT58A constructs. MYC-expressing human SCLC cells (GLC1) are used for positive controls (MYC+). (F) Representative brightfield and GFP fluorescent images of H889 (left) and H1963 (right) human SCLC cells infected with retroviral control or MycT58A-Ires-Gfp viruses. Scale bars, 100 μm, except H889 MycT58A is 50 μm. Average circularity, roundness and cluster size indicated +/− SEM. Student’s unpaired two-tailed t test for MYC vs vector control, **** p < 0.0001, ** p < 0.009. HSP90 serves as loading control. See also Figure S2.
Figure 3.
Figure 3.. Human SCLC subtypes correspond with MYC-driven evolution
(A) Log2-fold change of indicated NE (relative to the last time point) and non-NE pathway genes (relative to the first time point) from bulk RNA-seq of primary RPM tumor cells at specific days in culture. Dashed lines in Notch signaling panel indicate genes predicted to be Notch-inhibitory. (B) GSEA of 50-gene NE and non-NE gene signature from (Zhang et al., 2018) applied to early (day 3-7) vs late (day 14-21) time points of RPM transition. (C) Log2 expression of SCLC-subtype defining transcription factor genes at indicated time points from bulk RNA-seq data of RPM transition. (D) GSEA for human SCLC-ASCL1 (SCLC-A), SCLC-NEUROD1 (SCLC-N) and SCLC-YAP1 (SCLC-Y) gene signatures applied to bulk RNA-seq data grouped in day increments. See also Figure S3 and Table S1.
Figure 4.
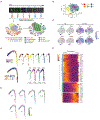
Figure 4.. MYC-driven SCLC subtypes progress along a single evolutionary trajectory
(A) Schematic of primary RPM tumor cell transition analyzed by scRNA-seq with tumor cell populations colored by day, and number of cells analyzed per time point in the legend (bottom left). Predicted cell types based on gene expression labeled on the same cells by number in the bottom right panel. (B) Following removal of non-tumor and low-quality cells, RPM tumor cells labeled by day in tSNE space using Monocle 2. (C) Expression of individual NE and non-NE marker genes in tSNE space from cells in panel B. (D) Pseudotime trajectory by Monocle 2 from early to late time points of primary RPM transition and 4 RPM-Cas9 tumors from Ad-Cgrp-Cre-infected mice. Faceted pseudotime plots indicated on top right and bottom right panels. Dashed insets in RPM tumors highlight percent of cells in late-stages of progression; total post-QC number of tumor cells indicated below RPM1-4 labels. (E) Expression of indicated genes projected onto pseudotime space as in panel D. (F) Heatmap of top-500 differentially expressed genes over pseudotime from the primary RPM tumor cell transition and 4 RPM tumors. See also Figure S4 and Table S2.
Figure 5.
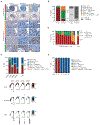
Figure 5.. MYC-driven murine tumors exhibit intratumoral SCLC subtype heterogeneity
(A) Representative IHC from in situ (n = 38) or invasive (n = 59) RPM tumors analyzed in serial sections. Left color panel indicates subtype classification matching panel B. Scale bar, 25 μm. (B) IHC quantification from serial sections in panel A where individual tumors have detection of 1 or more than 1 (> 1) subtypes. (C) CIBERSORT analyses of bulk RNA-seq data from RPM tumors with average (Avg) percent similarity to gene expression signatures of RPM transition cells in culture. (D) Top panel: Percentage of cells per tumor expressing subtype-defining genes with average (Avg) across tumors. Bottom panel: Individual RPM 1-4 trajectories with localization of positive cells in pseudotime. Percentage of total tumor cells expressing indicated genes shown below trajectories. (E) Percentage of cells expressing subtype-defining genes in the RPM transition experiment from Figure 4D.
Figure 6.
Figure 6.. MYC activates Notch signaling during NE reprogramming
(A) Heatmap of top 30 (or fewer, if < 30 significant) differentially-expressed genes for each time point of RPM transition using Seurat. (B) ENRICHR analysis of top differentially-expressed genes (0.25 log-fold change) in RPM tumor cell transition compared by day as color-coded in the bottom legend. (C) 50-gene NE score from (Zhang et al., 2018) applied to RPM tumor cell transition in tSNE (left) as in Figure 4B and in pseudotime space (right) as in Figure 4D. (D) Violin plots of NE-score from panel C applied to every cell of the RPM transition time points and individual RPM tumors. Student’s two-tailed unpaired t test, **** p < 2.22e-16. (E) Violin plots of MYC ChIP score applied to every cell of the RPM transition time points and individual RPM tumors. Student’s two-tailed unpaired t test, **** p < 2.22e-16, *** p < 0.0004, ** p < 0.002, ns = not significant. (F) ChIP-seq analysis of MYC (red) and H3K27Ac (blue) genomic binding at indicated gene loci from n = 3-4 independent RPM tumor samples. Blue rectangles below plots indicate gene exons with directionality of gene (->) near gene name. Black up-arrows indicate canonical E-Box 5‘-CACGTG-3’ or non-canonical ‘5-CANNTG-3’; motifs (“E-box motif”) selected in the vicinity of observed MYC binding. (G) Gene expression from (George et al., 2015) analyzed according to MYC status (n = 59 MYC-low and n = 11 MYC-high tumors). Mean +/− SEM, Student’s two-tailed unpaired t test, **** p < 0.0001, *** p < 0.0007, * p < 0.03, ns = not significant. For box plots, median and interquartile range are shown (lower bar is 25th percentile, upper bar is 75th percentile, and end points indicate minimum and maximum values). See also Figure S5 and Table S3.
Figure 7.
Figure 7.. Notch activation is required for MYC-driven tumor evolution
(A) Representative brightfield images of primary RPM tumor cells cultured in DMSO or 10 μM DAPT treated every three days and visualized at indicated days. Red box on each row indicates the day that variant morphology was first observed. Scale bar, 100 μm. n = 4 biological experiments. (B) Immunoblot from cells in panel A. HSP90 serves as loading control. Bar graphs on left represent fold change in expression, summed across all timepoints where protein was detected, relative to HSP90. Error bars represent mean +/− SEM for n = 4 biological replicates. Student’s two-tailed unpaired t test, ** p < 0.004, * p < 0.03, ns = not significant. (C) Representative microCT (mCT) imaging from vehicle control (corn oil) (n = 6) and 20 mg/kg DAPT-treated (n = 8) RPM mice. Lung tumors pseudocolored in yellow and heart outlined in red. Quantification of microCT imaging data for total tumor burden (% lung tumor volume/total lung volume) in graph on right at indicated days. Mean +/− SEM, Student’s two-tailed unpaired t test, ** p < 0.004, * p < 0.03, ns = not significant. (D) Representative H&E from vehicle control (n = 7) or DAPT-treated (n = 6) RPM mice at Day 10 following treatment. Scale bar, 2,000 μm. Quantification of average tumor burden (% tumor area/total lung area) in right panel with box plots where each dot represents one animal, Student’s two-tailed unpaired t test, ** p < 0.009. (E) Representative H&E and IHC in vehicle control (n = 7) or DAPT-treated (n = 6) RPM mice at Day 10 following treatment. Scale bars, 20 μm. (F) Digital IHC quantification from lung tumor tissue (% positive tumor cells) in panel E where each dot represents a tumor. Student’s two-tailed unpaired t test, **** p < 0.0001, ** p < 0.03, ns = not significant. (G) Left panel: MYC expression in normalized transcripts per million (TPM) + 1 grouped by NOTCH status with MYC-high samples in blue; RNA-seq data from n = 70 human tumors (George et al., 2015) and n = 48 human cell lines (CCLE), excluding POU2F3+ samples. Right panel: NE score applied to the same samples. “Non-damaging” indicates missense or in-frame deletions, and “damaging” indicates frame-shift deletions, nonsense, or splice variant mutations. Mean +/− SEM, Student’s two-tailed unpaired t test with Welch’s correction, * p < 0.01, ns = not significant. (H) NE score applied to RNA-seq data from n = 70 human tumors (George et al., 2015) and n = 98 human cell lines (SCLC_CellMiner), excluding POU2F3+ samples; Student’s two-tailed unpaired t test with Welch’s correction, *** p value = 0.0009. Contingency table analyzed by Fisher’s exact test. (I) GSEA comparing hSCLCs with NOTCH WT or silent (“WT”) vs “damaging” mutations from samples in panel G. Normalized enrichment scores (NES) indicated. For box plots, median and interquartile range is shown (lower bar is 25th percentile, upper bar is 75th percentile, and end points indicate minimum and maximum values). See also Figure S6 and Table S4.
Figure 8.
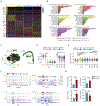
Figure 8.. Human SCLC exhibits intratumoral molecular subtype heterogeneity
(A) CIBERSORT analysis of RPM transition signatures in 70 human SCLC tumors (George et al., 2015) (black ID) and 48 human SCLC cell lines from CCLE (red ID), excluding POU2F3+ samples, grouped according to SCLC molecular subtype. Gene expression values for indicated MYC family member or Notch-related genes overlaid above the stacked bar graphs. Predicted NOTCH-status marked by top color bar. (B) Percent of RPM time-point signatures (Y-axis) within hSCLC molecular subtypes derived from panel A. Mean +/− SEM, Student’s two-tailed unpaired t test, **** p < 0.0001, ** p < 0.007, * p < 0.02, ns = not significant. (C) Correlation of indicated genes (Y-axis) with percent late (Day 19-21) signature determined by CIBERSORT within the human ASCL1+ subset only, with Pearson correlation p values indicated. (D) Venn diagram of human SCLC tissue IHC results with deidentified HCI-patient# for positive samples for ASCL1 (red circle), NEUROD1 (yellow circle) or YAP1 (blue circle) (n = 21 total). Samples in bold text harbor at least some cells with MYC+ IHC (HCI-12, −20, −14). Table on the right summarizes % of samples with indicated number of subtypes present at any frequency organized by MYC expression. * indicates tissue from limited stage as opposed to extensive stage. (E) Representative IHC in indicated patient biopsies. Serial sections were stained, but multiple tumor regions are shown to illustrate tumor heterogeneity. Scale bar, 20 μm. (F) tSNE unbiased clustering of tumor cell populations derived from chemotherapy-relapsed human SCLC liver biopsy analyzed by scRNA-seq. Number of post-QC tumor cells indicated. (G) Relative expression of indicated genes in tSNE as in panel F. (H) We propose a hypothetical model whereby NOTCH-deficient SCLC tumors are locked in an NEstem-like (ASCL1+) state (right circle) similar to Ouadah et al., 2019. In contrast, MYC reprograms NOTCH-WT tumors to non-NE SCLC fates that proceed either from NEUROD1 to YAP1 (left circle, top dashed line), or directly from ASCL1 to YAP1 (left circle, bottom dashed line). See also Figure S7.

Comment in

References

    1. Angerer P, Haghverdi L, Buttner M, Theis FJ, Marr C, and Buettner F (2016). destiny: diffusion maps for large-scale single-cell data in R. Bioinformatics 32, 1241–1243. - PubMed
    1. Augert A, Eastwood E, Ibrahim AH, Wu N, Grunblatt E, Basom R, Liggitt D, Eaton KD, Martins R, Poirier JT et al. (2019). Targeting NOTCH activation in small cell lung cancer through LSD1 inhibition. Sci Signal 12. - PMC - PubMed
    1. Borromeo MD, Savage TK, Kollipara RK, He M, Augustyn A, Osborne JK, Girard L, Minna JD, Gazdar AF, Cobb MH, and Johnson JE (2016). ASCL1 and NEUROD1 Reveal Heterogeneity in Pulmonary Neuroendocrine Tumors and Regulate Distinct Genetic Programs. Cell Rep 16, 1259–1272. - PMC - PubMed
    1. Bragelmann J, Bohm S, Guthrie MR, Mollaoglu G, Oliver TG, and Sos ML (2017). Family matters: How MYC family oncogenes impact small cell lung cancer. Cell Cycle 16, 1489–1498. - PMC - PubMed
    1. Butler A, Hoffman P, Smibert P, Papalexi E, and Satija R (2018). Integrating single-cell transcriptomic data across different conditions, technologies, and species. Nat Biotechnol 36, 411–420. - PMC - PubMed

Publication types

MeSH terms