

Prevalence, incidence and mortality of type 1 and type 2 diabetes in Denmark 1996-2016
- PMID: 32475839
- PMCID: PMC7265004
- DOI: 10.1136/bmjdrc-2019-001071
Prevalence, incidence and mortality of type 1 and type 2 diabetes in Denmark 1996-2016
Abstract
Introduction: The objective of this study was to give an overview of prevalence, incidence and mortality of type 1 (T1D) and type 2 diabetes (T2D) in Denmark, and their temporal trends.
Research design and methods: We constructed a diabetes register from existing population-based healthcare registers, including a classification of patients as T1D or T2D, with coverage from 1996 to 2016. Using complete population records for Denmark, we derived prevalence, incidence, mortality and standardized mortality ratio (SMR).
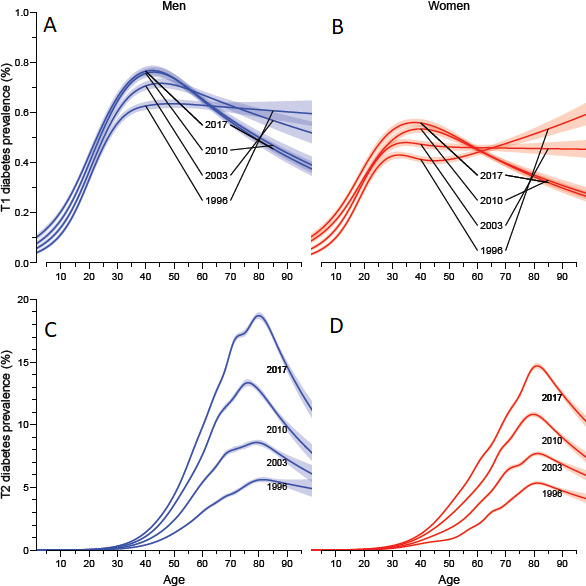
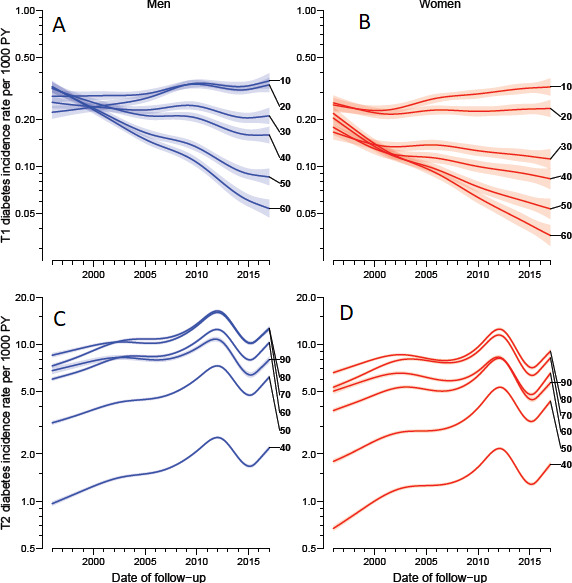
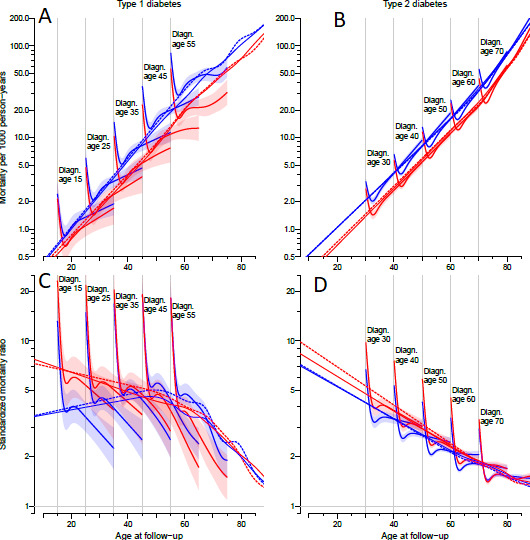
Results: The overall prevalence of diabetes at 2016 was 0.5% for T1D and 4.4% for T2D, with annual increases since 1996 of 0.5% for T1D and 5.5% for T2D. Incidence rates of T1D decreased by 3.5% per year, with increase for persons under 25 years of age and a decrease for older persons. T2D incidence increased 2.5% per year until 2011, decreased until 2014 and increased after that, similar in all ages. The annual decrease in mortality was 0.3% for T1D and 2.9% for T2D. The mortality rate ratio between T1D and T2D was 1.9 for men and 1.6 for women. SMR decreased annually 2% for T1D and 0.5% for T2D.
Conclusions: Incidence and prevalence of diabetes is increasing, but mortality among patients with diabetes in Denmark is decreasing faster than the mortality among persons without diabetes. T1D carries a 70% higher mortality than T2D.
Keywords: epidemiology; incidence; mortality; registries.
© Author(s) (or their employer(s)) 2020. Re-use permitted under CC BY-NC. No commercial re-use. See rights and permissions. Published by BMJ.
Conflict of interest statement
Competing interests: BC and MEJ own shares in NovoNordisk. BC has received lecture and consultancy fees from NovoNordisk and LeoPharma. MEJ is PI on a trial sponsored by AstraZeneca, and received research grants from AMGEN AB, AstraZeneca, Sanofi Aventis and Boehringer Ingelheim. PFR has nothing to disclose.
Figures
References
-
- Read SH, McAllister DA, Colhoun HM, et al. . Scottish Diabetes Research Network Epidemiology Group. incident ischaemic stroke and type 2 diabetes: trends in incidence and case fatality in Scotland 2004–2013. Diabet Med 2018;35:99–106. - PubMed
-
- Norhammar A, Bodegård J, Nyström T, et al. . Incidence, prevalence and mortality of type 2 diabetes requiring glucose-lowering treatment, and associated risks of cardiovascular complications: a nationwide study in Sweden, 2006–2013. Diabetologia 2016;59:1692–701. 10.1007/s00125-016-3971-y - DOI - PubMed
Publication types
MeSH terms
LinkOut - more resources
Full Text Sources
Medical