. 2020 Oct;22(10):1682-1693.
doi: 10.1038/s41436-020-0845-y. Epub 2020 Jun 1.

Automated syndrome diagnosis by three-dimensional facial imaging

Affiliations

Automated syndrome diagnosis by three-dimensional facial imaging

Benedikt Hallgrímsson et al. Genet Med. 2020 Oct.

Abstract

Purpose: Deep phenotyping is an emerging trend in precision medicine for genetic disease. The shape of the face is affected in 30-40% of known genetic syndromes. Here, we determine whether syndromes can be diagnosed from 3D images of human faces.

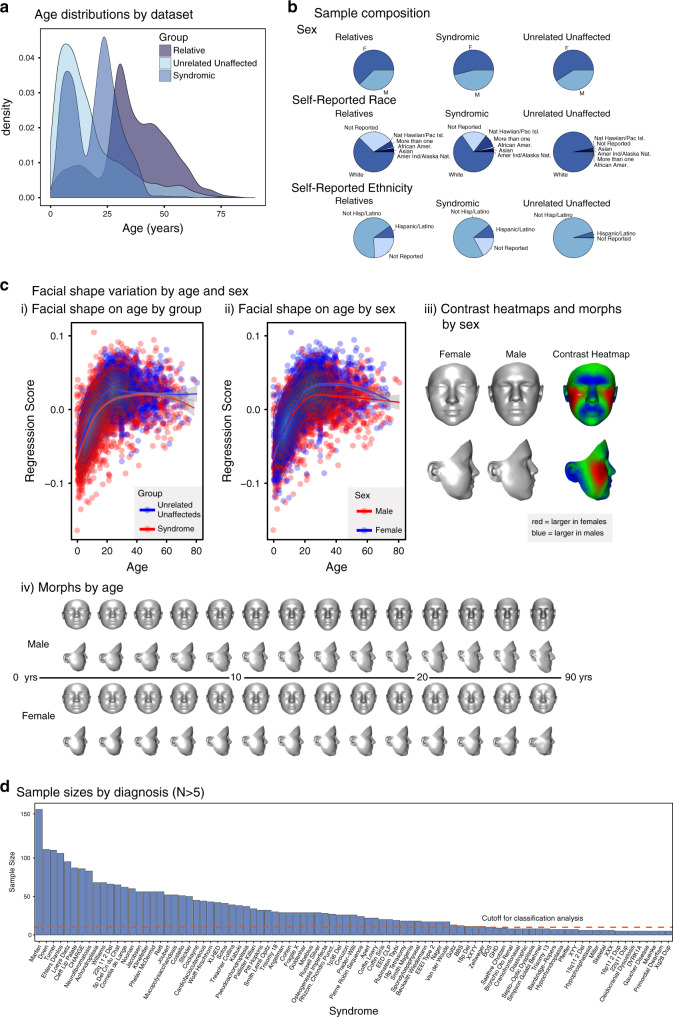
Methods: We analyzed variation in three-dimensional (3D) facial images of 7057 subjects: 3327 with 396 different syndromes, 727 of their relatives, and 3003 unrelated, unaffected subjects. We developed and tested machine learning and parametric approaches to automated syndrome diagnosis using 3D facial images.

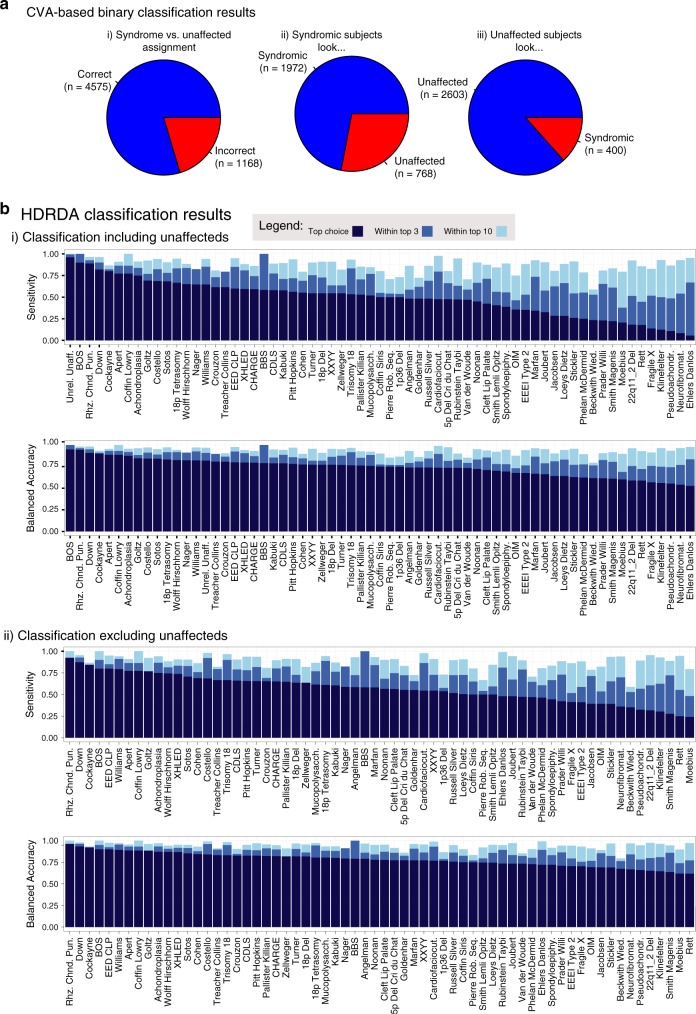
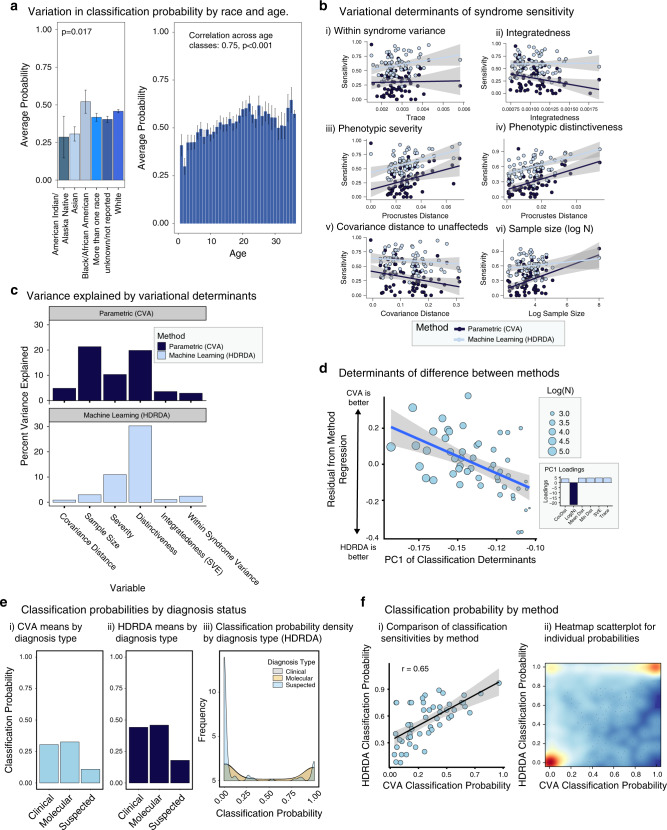
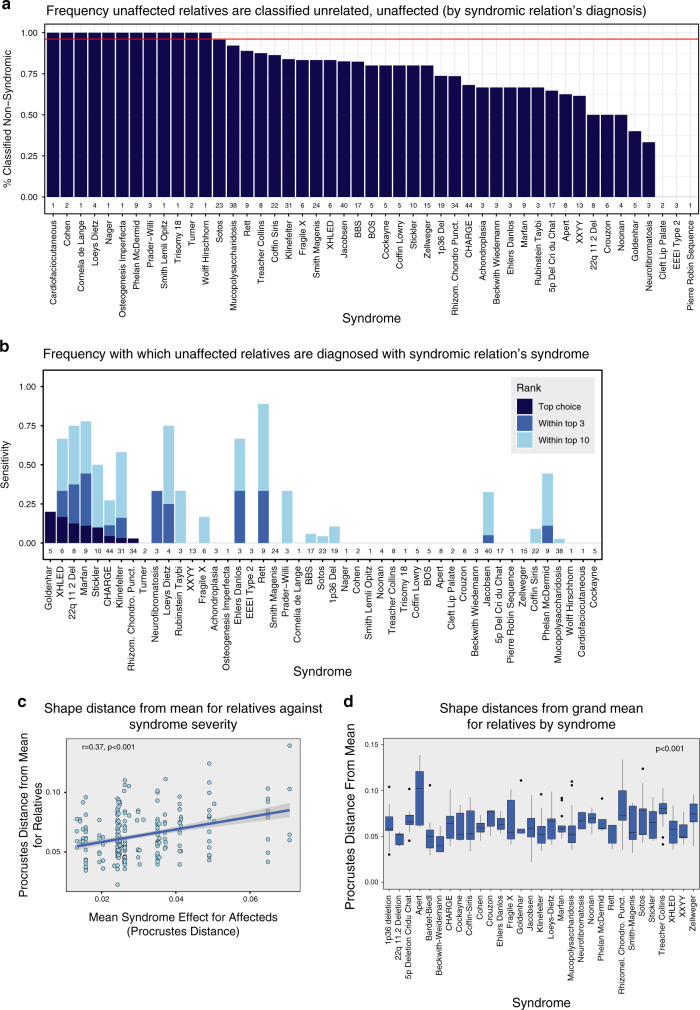
Results: Unrelated, unaffected subjects were correctly classified with 96% accuracy. Considering both syndromic and unrelated, unaffected subjects together, balanced accuracy was 73% and mean sensitivity 49%. Excluding unrelated, unaffected subjects substantially improved both balanced accuracy (78.1%) and sensitivity (56.9%) of syndrome diagnosis. The best predictors of classification accuracy were phenotypic severity and facial distinctiveness of syndromes. Surprisingly, unaffected relatives of syndromic subjects were frequently classified as syndromic, often to the syndrome of their affected relative.

Conclusion: Deep phenotyping by quantitative 3D facial imaging has considerable potential to facilitate syndrome diagnosis. Furthermore, 3D facial imaging of "unaffected" relatives may identify unrecognized cases or may reveal novel examples of semidominant inheritance.

Keywords: deep phenotyping; diagnosis; facial imaging; morphometrics; syndromes.


Conflict of interest statement

The authors declare no conflicts of interest.

Figures

Fig. 1
Fig. 1. Composition of the 3D facial image library.
(a) Age distribution for syndromic; unrelated, unaffected; and unaffected relative subjects. (b) Polynomial age regression score against age plotted by group (syndromic versus unrelated, unaffected) (i) and sex (ii). 3D heatmaps showing regions of facial shape differences between sexes (iii). Shape morphs showing average facial shape changes with age by sex (iv). (c) Sample composition by self-reported sex, ethnicity, and race, as specified in the National Institutes of Health (NIH) reporting guidelines (NOT-OD-15–089). (d) Distribution of sample sizes by syndrome for all syndromes with n > 5. The dotted red line shows the cut-off for inclusion in the classification analysis at n ≥ 10).
Fig. 2
Fig. 2. Principal components analysis (PCA) of the among-syndrome means.
Each syndrome is represented by the average facial shape for that syndrome after regressing shape on polynomial age and sex. (a) Plots show the facial shape changes associated with each PC, scaled to 5 times the standard deviation of PC scores. (b) Heatmaps showing the regions of the face that vary most along each PC (red = larger, blue = smaller). (c) Vectormaps for syndromes that define the extremes of the PCA for the syndromic means. These are similar but not identical to the heatmaps in (b) because a syndromic mean can differ from the grand mean along multiple PCs. Both heatmaps and vectormaps are based on the distances between average meshes, registered in Procrustes space.
Fig. 3
Fig. 3. Syndrome classification.
(a) Sensitivities for a two-group classification, syndromic versus unrelated, unaffected: (i) overall sensitivity; (ii) sensitivity for the syndromic subjects; (iii) sensitivity for unrelated, unaffected subjects. (b) Sensitivity and balanced accuracy (high-dimensional regularized discriminant analysis [HDRDA]). Top-1, -3, and -10 sensitivity and balanced accuracy by syndrome for the full classification sample that included both syndromic subjects and unrelated, unaffected subjects (i) and the syndrome-only classification sample (ii). Balanced classification accuracy by syndrome. Red lines depict grand mean top-1, -3, and -10 sensitivities and balanced accuracies.
Fig. 4
Fig. 4. Determinants of sensitivity (high-dimensional regularized discriminant analysis [HDRDA] and canonical variates analysis [CVA]).
(a) Classification accuracies plotted against potential determinants of classification accuracy. (b) Variation in classification accuracy attributable to potential determinants. (c) PC1 of classification determinants (accounting for 90% of variation) plotted against differences in performance between HDRDA and CVA. (d) Residual of regression for syndrome sensitivities for the two methods plotted against the first PC for the determinants of classification accuracy. (e) Classification probability as a function of diagnosis status. (f) By-syndrome sensitivity comparison for HDRDA and CVA classification.
Fig. 5
Fig. 5. Diagnosis of unaffected relatives.
(a) Sensitivities for unaffected relatives, grouped according to the diagnosis of the syndromic relation. (b) Frequency with which a syndromic subject’s diagnosis is also among the top-10 ranked diagnoses for the unaffected relative. (c) Phenotypic extremeness for relatives against the phenotypic severity of their relative’s syndrome. (d) Varation in phenotypic extremeness of relatives by syndrome.

References

    1. Hart TC, Hart PS. Genetic studies of craniofacial anomalies: clinical implications and applications. Orthod Craniofac Res. 2009;12:212–220. doi: 10.1111/j.1601-6343.2009.01455.x. - DOI - PMC - PubMed
    1. Winter RM, Baraitser M. The London Dysmorphology Database. J Med Genet. 1987;24:509. doi: 10.1136/jmg.24.8.509. - DOI - PMC - PubMed
    1. Hurst ACE. Facial recognition software in clinical dysmorphology. Curr Opin Pediatr. 2018;30:701–706. doi: 10.1097/MOP.0000000000000677. - DOI - PubMed
    1. Douzgou S, Clayton-Smith J, Gardner S, et al. Dysmorphology at a distance: results of a web-based diagnostic service. Eur J Hum Genet. 2014;22:327. doi: 10.1038/ejhg.2013.137. - DOI - PMC - PubMed
    1. Gurovich Y, Hanani Y, Bar O, et al. Identifying facial phenotypes of genetic disorders using deep learning. Nat Med. 2019;25:60–64. doi: 10.1038/s41591-018-0279-0. - DOI - PubMed

Publication types