Observational Study
. 2020 May 21;26(19):2374-2387.
doi: 10.3748/wjg.v26.i19.2374.

Predicting dyslipidemia after liver transplantation: A significant role of recipient metabolic inflammation profile

Affiliations
Observational Study

Predicting dyslipidemia after liver transplantation: A significant role of recipient metabolic inflammation profile

Hai-Tao Huang et al. World J Gastroenterol. .

Abstract

Background: Post-transplant dyslipidemia (PTDL) is a common complication in liver recipients and can cause morbidity and threaten graft function. The crosstalk between metabolic inflammation and dyslipidemia has been recently revealed. However, the role of grafts' and recipients' metabolic status in the development of PTDL has not been evaluated.

Aim: To investigate the association of recipients' metabolic inflammation status with PTDL and construct a predictive model.

Methods: A total of 396 adult patients who received primary liver transplantation between 2015 and 2017 were enrolled. Metabolomics and cytokines were analyzed using recipients' pre-transplant peripheral blood in a training set (n = 72). An integrated prediction model was established according to the clinical risk factors and metabolic inflammation compounds and further verified in a validation set (n = 144).

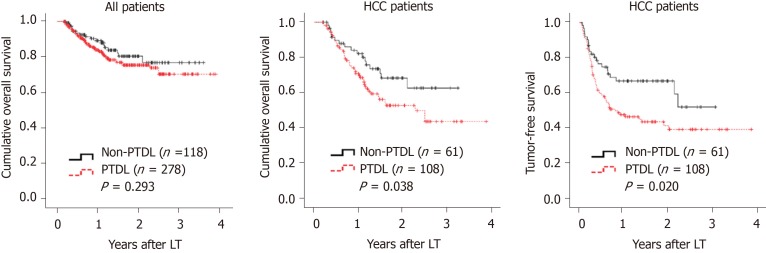
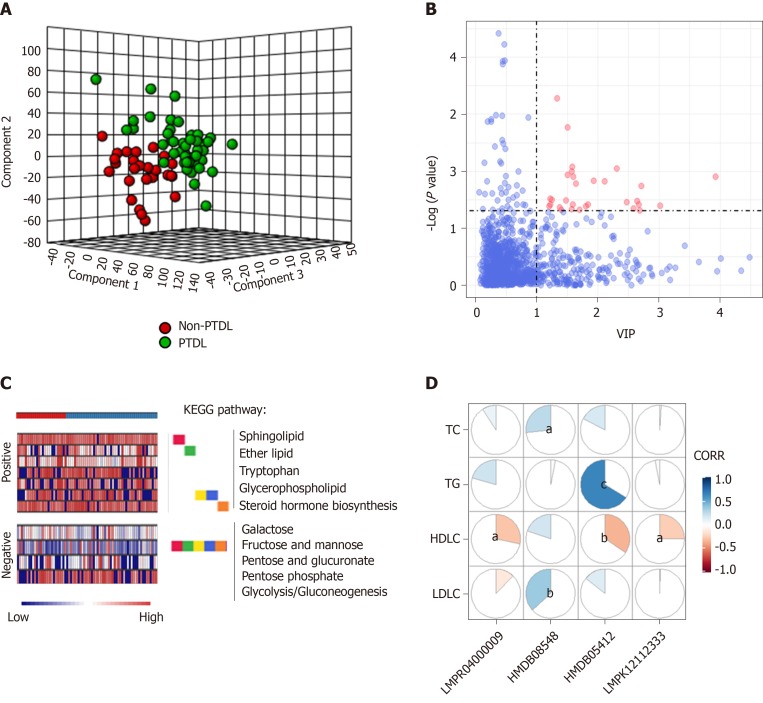
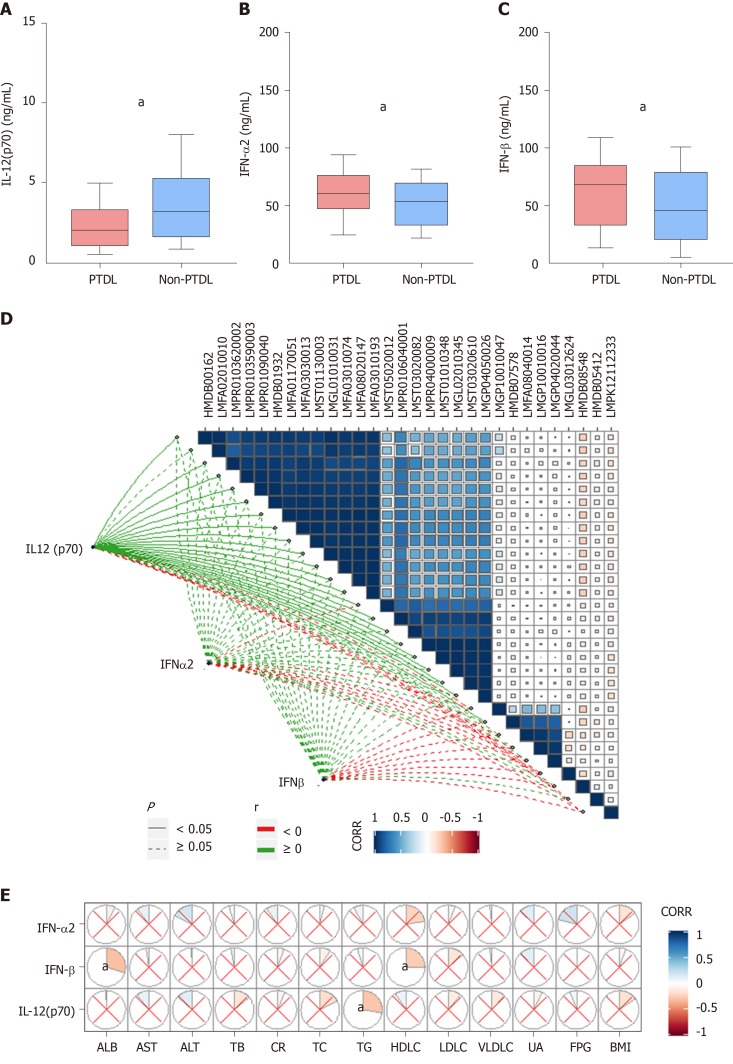
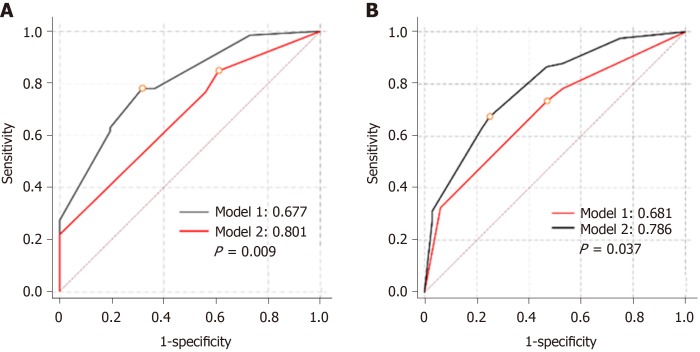
Results: The serum lipid profile took 3 mo to reach homeostasis after liver transplantation. A total of 278 (70.2%) liver recipients developed PTDL during a follow-up period of 1.78 (1.00, 2.97) years. The PTDL group showed a significantly lower tumor-free survival and overall survival than the non-PTDL group in patients with hepatocellular carcinoma (n = 169). The metabolomic analysis showed that metabolic features discriminating between the PTDL and non-PTDL groups were associated with lipid and glucose metabolism-associated pathways. Among metabolites and cytokines differentially expressed between the two groups, interleukin-12 (p70) showed the best diagnostic accuracy and significantly increased the predictive value when it was incorporated into the clinical model in both training and validation sets.

Conclusion: Recipients' pre-transplant serum interleukin-12 (p70) level is associated with the risk of PTDL and has potential clinical value for predicting PTDL.

Keywords: Cytokines; Dyslipidemia; Liver transplantation; Metabolomics; Predictive model.


Conflict of interest statement

Conflict-of-interest statement: The authors declare that there is no conflict of interest to be disclosed.

Figures

Figure 1
Figure 1
Dynamic process of lipid profile after liver transplantation. A: Dynamic changes of total cholesterol, triglyceride, high-density lipoprotein cholesterol, low-density lipoprotein cholesterol, and very low-density lipoprotein cholesterol during 10 d after liver transplantation; B: Dynamic changes of total cholesterol, triglyceride, high-density lipoprotein cholesterol, low-density lipoprotein cholesterol, and very low-density lipoprotein cholesterol during 24 mo after liver transplantation. Data are expressed as the mean ± SD or median (10-90 percentiles). aP < 0.05 vs pre-transplant; bP < 0.05 vs day 1. TC: Total cholesterol; TG: Triglyceride; HDLC: High-density lipoprotein cholesterol; LDLC: Low-density lipoprotein cholesterol; VLDLC: Very low-density lipoprotein cholesterol; LT: Liver transplantation.
Figure 2
Figure 2
Impact of post-transplant dyslipidemia on survival. A: Comparison of overall survival between post-transplant dyslipidemia and non-post-transplant dyslipidemia groups in all patients; B: Comparison of overall survival between post-transplant dyslipidemia and non-post-transplant dyslipidemia groups in hepatocellular carcinoma patients; C: Comparison of tumor-free survival between post-transplant dyslipidemia and non-post-transplant dyslipidemia groups in hepatocellular carcinoma patients. PTDL: Post-transplant dyslipidemia; LT: Liver transplantation; HCC: Hepatocellular carcinoma.
Figure 3
Figure 3
Metabolomic profiles of post-transplant dyslipidemia and non-post-transplant dyslipidemia groups. A: 3-D scores plot between selected components in partial least squares-discriminant analysis; B: Thirty differentially expressed metabolites (scatter plot; variable importance in the projection > 1, P < 0.05) were annotated with red color; C: Concentrated display of the abundant differential features (positive and negative ion modes on the top and bottom, respectively) between non-post-transplant dyslipidemia and post-transplant dyslipidemia groups using Mummichog 2.0; D: Correlation between metabolites and lipid profile in recipients. aP < 0.05; bP < 0.01; cP < 0.001. PTDL: Post-transplant dyslipidemia; VIP: Variable Importance in the Projection; TC: Total cholesterol; TG: Triglycerides; HDLC: High-density lipoprotein cholesterol; LDLC: Low-density lipoprotein cholesterol; CORR: Correlation.
Figure 4
Figure 4
Peripheral cytokine profile of post-transplant dyslipidemia and non-post-transplant dyslipidemia groups. A-C: The interleukin (IL)-12 (p70), IFN-α2, and IFN-β levels were significantly differentially expressed between post-transplant dyslipidemia group and non-post-transplant dyslipidemia group; D: Correlations between differential cytokines and metabolic profiles; E: Correlation between differential cytokines and recipients’ pre-transplant clinical metabolic parameters. aP < 0.05. PTDL: Post-transplant dyslipidemia; ALB: Albumin; AST: Aspartate aminotransferase; ALT: Alanine aminotransferase; TB: Total bilirubin; CR: Creatinine; TC: Total cholesterol; TG: Triglyceride; HDLC: High-density lipoprotein cholesterol; LDLC: Low density lipoprotein cholesterol; VLDLC: Very low-density lipoprotein cholesterol; UA: Uric acid; FBG: Fasting blood glucose; BMI: Body mass index; CORR: Correlation.
Figure 5
Figure 5
Comparison of predictive ability between clinical model (model 1) and integrated model (model 2). A: Areas under the receiver operating characteristic curves of model 1 and model 2 in training set (n = 72); B: Areas under the receiver operating characteristic curves of model 1 and model 2 in validation set (n = 144).

Similar articles

Cited by

References

    1. Chu KKW, Chan SC, Sin SL, Chan ACY, Chok KSH, Cheng IKP, Lo CM. Lipid profiles of donors and recipients of liver transplant: like father like son. Hepatol Int. 2017;11:300–305. - PubMed
    1. Parekh J, Corley DA, Feng S. Diabetes, hypertension and hyperlipidemia: prevalence over time and impact on long-term survival after liver transplantation. Am J Transplant. 2012;12:2181–2187. - PubMed
    1. Yuan J, Bagley J, Iacomini J. Hyperlipidemia Promotes Anti-Donor Th17 Responses That Accelerate Allograft Rejection. Am J Transplant. 2015;15:2336–2345. - PMC - PubMed
    1. Hüsing A, Kabar I, Schmidt HH. Lipids in liver transplant recipients. World J Gastroenterol. 2016;22:3315–3324. - PMC - PubMed
    1. Raees-Jalali G, Eshraghian A, Faghihi A, Roozbeh J, Sagheb MM, Eshraghian H, Behzadi S. Hyperlipidemia after kidney transplantation: long-term graft outcome. Iran J Kidney Dis. 2012;6:49–55. - PubMed

Publication types

MeSH terms