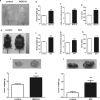
Adipocytes promote tumor progression and induce PD-L1 expression via TNF-α/IL-6 signaling
- PMID: 32477009
- PMCID: PMC7240984
- DOI: 10.1186/s12935-020-01269-w
Adipocytes promote tumor progression and induce PD-L1 expression via TNF-α/IL-6 signaling
Abstract
Background: Obesity confers increased risk for various types of cancer. PD-L1 is a key molecule in tumor immune evasion by inducing T cell exhaustion. The relationship between obesity and PD-L1 is still ambiguous. This study was designed to reveal the development of hepatocellular carcinoma and melanoma in obese mice and to investigate if adipocytes regulate PD-L1 expression and the underlying mechanism.
Methods: Monosodium glutamate-induced obese mice were inoculated with H22 tumor cells and High fat diet (HFD)-induced obese mice were inoculated with B16-F1 mouse melanoma cells. Human hepatoma HepG2 cells and B16-F1 cells were treated with conditional media from 3T3-L1 adipocytes (adi-CM). Neutralized anti-TNF-α and anti-IL-6 antibodies and inhibitor of NF-κB or STAT3 were used to reveal the mechanism of effect of adi-CM.
Results: In obese mice, H22 and B16-F1 tumor tissues grew faster and PD-L1 expression in tumor tissue was increased. Adi-CM up-regulated PD-L1 level in HepG2 and B16-F1 cells in vitro. Differentiated 3T3-L1 adipocytes secreted TNF-α and IL-6, and neutralizing TNF-α and/or IL-6 reduced PD-L1 expression in adi-CM-treated cells. p-NF-κB/NF-κB level was downregulated in HepG2 and B16-F1 cells, and p-STAT3/STAT3 level was also decreased in HepG2 cells. In addition, inhibitor of NF-κB or STAT3 reversed the effect of adi-CM on PD-L1 expression.
Conclusions: TNF-α and IL-6 secreted by adipocytes up-regulates PD-L1 in hepatoma and B16-F1 cells, which may be at least partially involved in the role of obesity in promoting tumor progression.
Keywords: Adipocytes; Hepatocellular carcinoma; IL-6; Melanoma; PD-L1; TNF-α.
© The Author(s) 2020.
Conflict of interest statement
Competing interestsThe authors declare no conflict of interest.
Figures


Similar articles
-
Pentamethylquercetin Inhibits Hepatocellular Carcinoma Progression and Adipocytes-induced PD-L1 Expression via IFN-γ Signaling.Curr Cancer Drug Targets. 2020;20(11):868-874. doi: 10.2174/1568009620999200730184514. Curr Cancer Drug Targets. 2020. PMID: 32748749
-
Inflammatory cytokines IL-17 and TNF-α up-regulate PD-L1 expression in human prostate and colon cancer cells.Immunol Lett. 2017 Apr;184:7-14. doi: 10.1016/j.imlet.2017.02.006. Epub 2017 Feb 14. Immunol Lett. 2017. PMID: 28223102 Free PMC article.
-
Sparstolonin B inhibits lipopolysaccharide-induced inflammation in 3T3-L1 adipocytes.Eur J Pharmacol. 2015 Dec 15;769:79-85. doi: 10.1016/j.ejphar.2015.10.050. Epub 2015 Oct 30. Eur J Pharmacol. 2015. PMID: 26522926
-
Adipocytes affect castration-resistant prostate cancer cells to develop the resistance to cytotoxic action of NK cells with alterations of PD-L1/NKG2D ligand levels in tumor cells.Prostate. 2018 Apr;78(5):353-364. doi: 10.1002/pros.23479. Epub 2018 Jan 12. Prostate. 2018. PMID: 29330929
-
SIRT1 regulates TNF-α-induced expression of CD40 in 3T3-L1 adipocytes via NF-κB pathway.Cytokine. 2012 Nov;60(2):447-55. doi: 10.1016/j.cyto.2012.05.025. Epub 2012 Jun 18. Cytokine. 2012. PMID: 22717288
Cited by
-
Adipocytes impact on gastric cancer progression: Prognostic insights and molecular features.World J Gastrointest Oncol. 2024 Jul 15;16(7):3011-3031. doi: 10.4251/wjgo.v16.i7.3011. World J Gastrointest Oncol. 2024. PMID: 39072151 Free PMC article.
-
USP5 facilitates non-small cell lung cancer progression through stabilization of PD-L1.Cell Death Dis. 2021 Nov 5;12(11):1051. doi: 10.1038/s41419-021-04356-6. Cell Death Dis. 2021. PMID: 34741014 Free PMC article.
-
Adipose Tissue-Derived Extracellular Vesicles and the Tumor Microenvironment: Revisiting the Hallmarks of Cancer.Cancers (Basel). 2021 Jul 2;13(13):3328. doi: 10.3390/cancers13133328. Cancers (Basel). 2021. PMID: 34283044 Free PMC article. Review.
-
Melanoma cells induce dedifferentiation and metabolic changes in adipocytes present in the tumor niche.Cell Mol Biol Lett. 2023 Jul 22;28(1):58. doi: 10.1186/s11658-023-00476-3. Cell Mol Biol Lett. 2023. PMID: 37481560 Free PMC article.
-
Exploratory analysis of radiomic as prognostic biomarkers in 18F-FDG PET/CT scan in uterine cervical cancer.Front Med (Lausanne). 2022 Dec 2;9:1046551. doi: 10.3389/fmed.2022.1046551. eCollection 2022. Front Med (Lausanne). 2022. PMID: 36569127 Free PMC article.
References
-
- Deng T, Lyon CJ, Bergin S, Caligiuri MA, Hsueh WA. Obesity, inflammation, and cancer. Annual Rev Pathol. 2016;11:421–449. - PubMed
-
- Sergentanis TN, Antoniadis AG, Gogas HJ, Antonopoulos CN, Adami HO, Ekbom A, Petridou ET. Obesity and risk of malignant melanoma: a meta-analysis of cohort and case-control studies. Eur J Cancer. 2013;49(3):642–657. - PubMed
-
- McNelis JC, Olefsky JM. Macrophages, immunity, and metabolic disease. Immunity. 2014;41(1):36–48. - PubMed
-
- Fasshauer M, Bluher M. Adipokines in health and disease. Trends Pharmacol Sci. 2015;36(7):461–470. - PubMed
LinkOut - more resources
Full Text Sources
Research Materials
Miscellaneous

