

Compensatory Cross-Modal Plasticity Persists After Sight Restoration
- PMID: 32477041
- PMCID: PMC7235304
- DOI: 10.3389/fnins.2020.00291
Compensatory Cross-Modal Plasticity Persists After Sight Restoration
Abstract
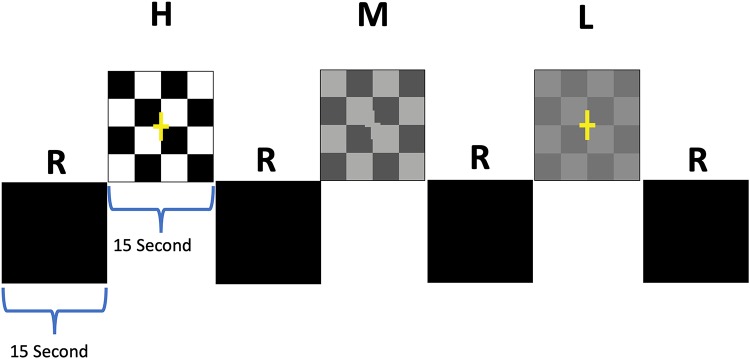
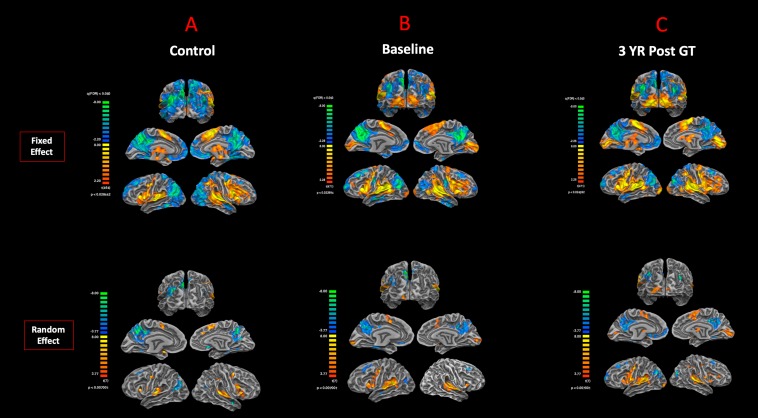
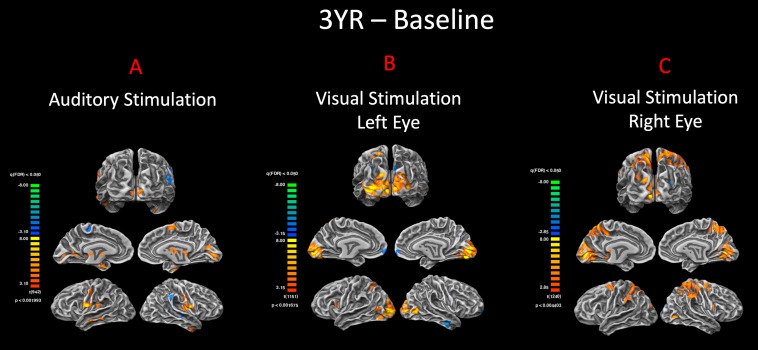
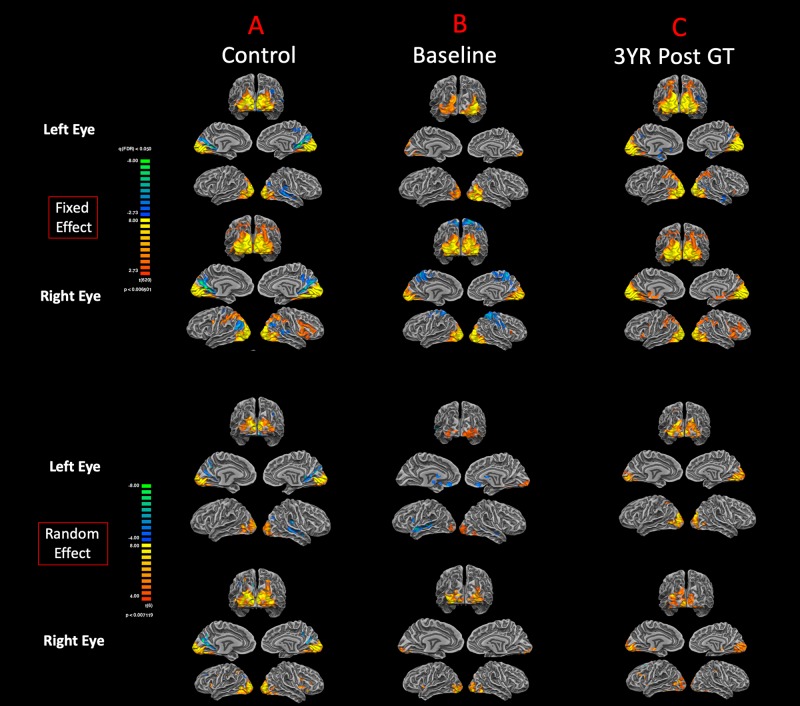
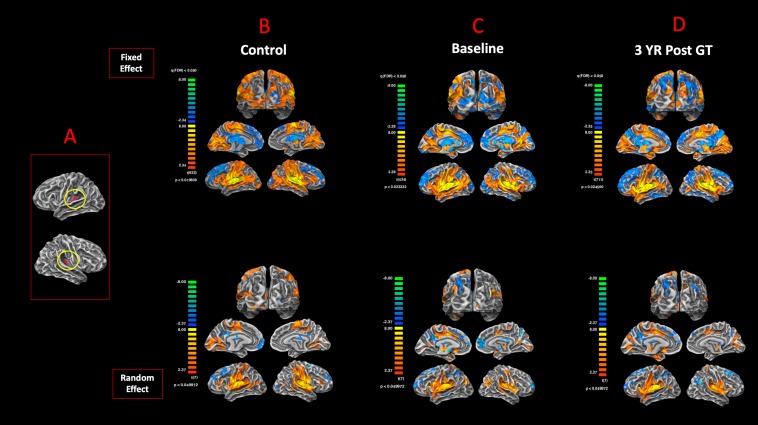
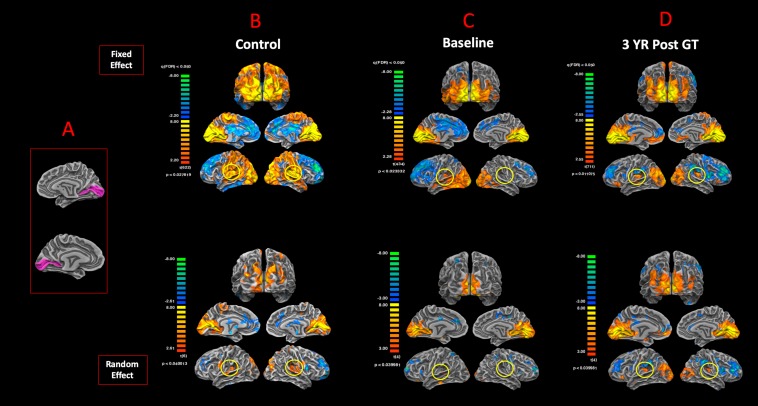
Sensory deprivation prompts extensive structural and functional reorganizations of the cortex resulting in the occupation of space for the lost sense by the intact sensory systems. This process, known as cross-modal plasticity, has been widely studied in individuals with vision or hearing loss. However, little is known on the neuroplastic changes in restoring the deprived sense. Some reports consider the cross-modal functionality maladaptive to the return of the original sense, and others view this as a critical process in maintaining the neurons of the deprived sense active and operational. These controversial views have been challenged in both auditory and vision restoration reports for decades. Recently with the approval of Luxturna as the first retinal gene therapy (GT) drug to reverse blindness, there is a renewed interest for the crucial role of cross-modal plasticity on sight restoration. Employing a battery of task and resting state functional magnetic resonance imaging (rsfMRI), in comparison to a group of sighted controls, we tracked the functional changes in response to auditory and visual stimuli and at rest, in a group of patients with biallelic mutations in the RPE65 gene ("RPE65 patients") before and 3 years after GT. While the sighted controls did not present any evidence for auditory cross-modal plasticity, robust responses to the auditory stimuli were found in occipital cortex of the RPE65 patients overlapping visual responses and significantly elevated 3 years after GT. The rsfMRI results showed significant connectivity between the auditory and visual areas for both groups albeit attenuated in patients at baseline but enhanced 3 years after GT. Taken together, these findings demonstrate that (1) RPE65 patients present with an auditory cross-modal component; (2) visual and non-visual responses of the visual cortex are considerably enhanced after vision restoration; and (3) auditory cross-modal functions did not adversely affect the success of vision restitution. We hypothesize that following GT, to meet the demand for the newly established retinal signals, remaining or dormant visual neurons are revived or unmasked for greater participation. These neurons or a subset of these neurons respond to both the visual and non-visual demands and further strengthen connectivity between the auditory and visual cortices.
Keywords: RPE65 gene; auditory; cross-modal plasticity; functional magnetic resonance imaging; low vision; resting state functional connectivity; sight restoration.
Copyright © 2020 Mowad, Willett, Mahmoudian, Lipin, Heinecke, Maguire, Bennett and Ashtari.
Figures

Similar articles
-
Cross-Modal Plasticity in Higher-Order Auditory Cortex of Congenitally Deaf Cats Does Not Limit Auditory Responsiveness to Cochlear Implants.J Neurosci. 2016 Jun 8;36(23):6175-85. doi: 10.1523/JNEUROSCI.0046-16.2016. J Neurosci. 2016. PMID: 27277796 Free PMC article.
-
Downward cross-modal plasticity in single-sided deafness.Neuroimage. 2019 Aug 15;197:608-617. doi: 10.1016/j.neuroimage.2019.05.031. Epub 2019 May 12. Neuroimage. 2019. PMID: 31091475
-
Motion processing after sight restoration: No competition between visual recovery and auditory compensation.Neuroimage. 2018 Feb 15;167:284-296. doi: 10.1016/j.neuroimage.2017.11.050. Epub 2017 Nov 23. Neuroimage. 2018. PMID: 29175496
-
Cross-modal plasticity for the spatial processing of sounds in visually deprived subjects.Exp Brain Res. 2009 Jan;192(3):343-58. doi: 10.1007/s00221-008-1553-z. Epub 2008 Sep 2. Exp Brain Res. 2009. PMID: 18762928 Review.
-
Compensatory plasticity and cross-modal reorganization following early visual deprivation.Neurosci Biobehav Rev. 2014 Apr;41:36-52. doi: 10.1016/j.neubiorev.2013.08.001. Epub 2013 Aug 15. Neurosci Biobehav Rev. 2014. PMID: 23954750 Review.
Cited by
-
How learning to read Braille in visual and tactile domains reorganizes the sighted brain.Front Neurosci. 2025 Jan 6;18:1297344. doi: 10.3389/fnins.2024.1297344. eCollection 2024. Front Neurosci. 2025. PMID: 39834698 Free PMC article.
-
Structural Differences Across Multiple Visual Cortical Regions in the Absence of Cone Function in Congenital Achromatopsia.Front Neurosci. 2021 Oct 14;15:718958. doi: 10.3389/fnins.2021.718958. eCollection 2021. Front Neurosci. 2021. PMID: 34720857 Free PMC article.
-
The amplitude of low frequency fluctuation and spontaneous brain activity alterations in age-related macular degeneration.Front Med (Lausanne). 2025 Jan 22;11:1507971. doi: 10.3389/fmed.2024.1507971. eCollection 2024. Front Med (Lausanne). 2025. PMID: 39911676 Free PMC article.
-
Sight restoration reverses blindness-induced cross-modal functional connectivity changes between the visual and somatosensory cortex at rest.Front Neurosci. 2022 Sep 23;16:902866. doi: 10.3389/fnins.2022.902866. eCollection 2022. Front Neurosci. 2022. PMID: 36213743 Free PMC article.
-
Crossmodal plasticity in hearing loss.Trends Neurosci. 2023 May;46(5):377-393. doi: 10.1016/j.tins.2023.02.004. Epub 2023 Mar 27. Trends Neurosci. 2023. PMID: 36990952 Free PMC article. Review.
References
Grants and funding
LinkOut - more resources
Full Text Sources
Miscellaneous