. 2020 May 14:14:93.
doi: 10.3389/fncel.2020.00093. eCollection 2020.

Lack of Helios During Neural Development Induces Adult Schizophrenia-Like Behaviors Associated With Aberrant Levels of the TRIF-Recruiter Protein WDFY1

Affiliations

Lack of Helios During Neural Development Induces Adult Schizophrenia-Like Behaviors Associated With Aberrant Levels of the TRIF-Recruiter Protein WDFY1

Anna Sancho-Balsells et al. Front Cell Neurosci. .

Erratum in

Abstract

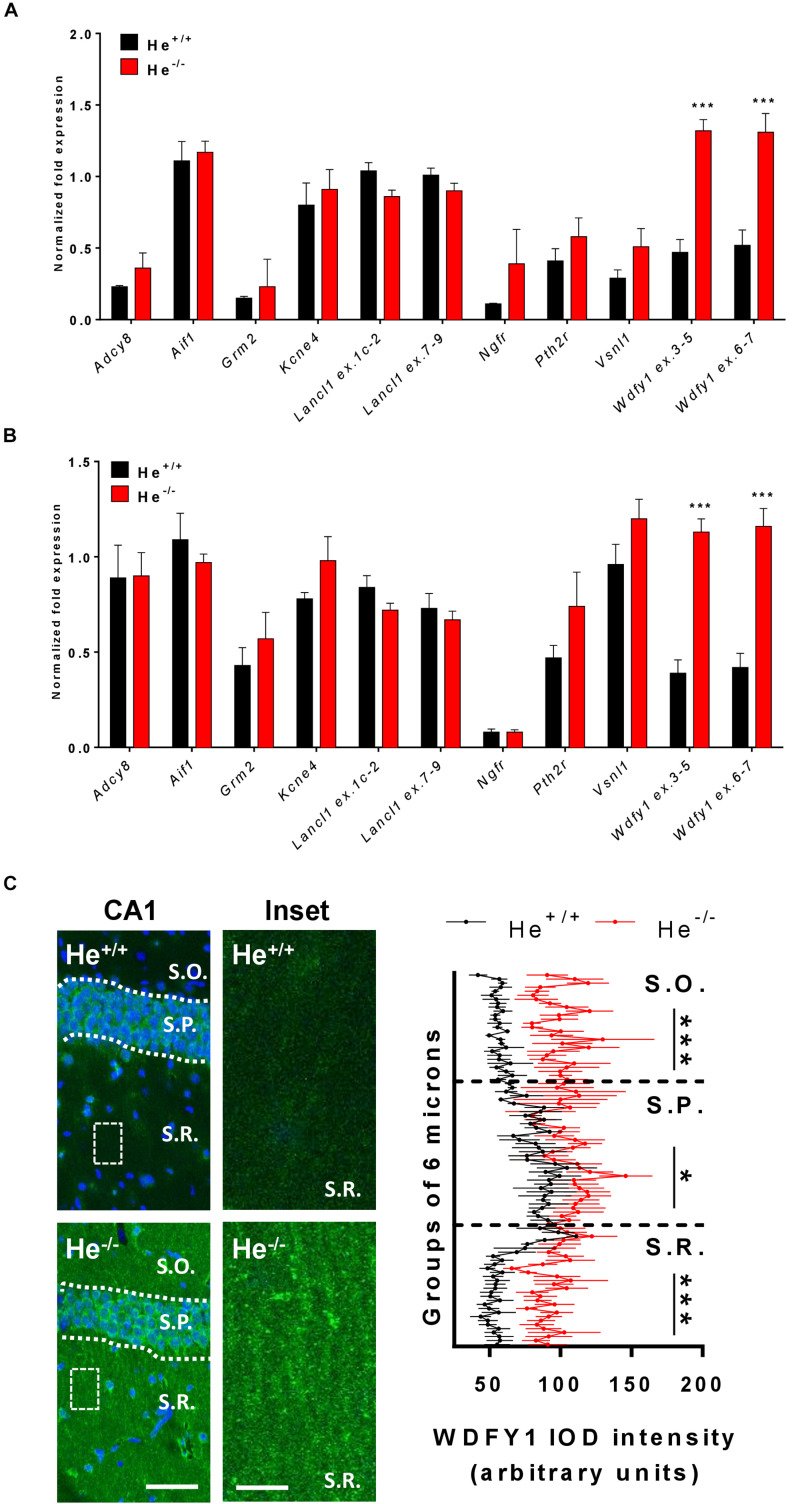
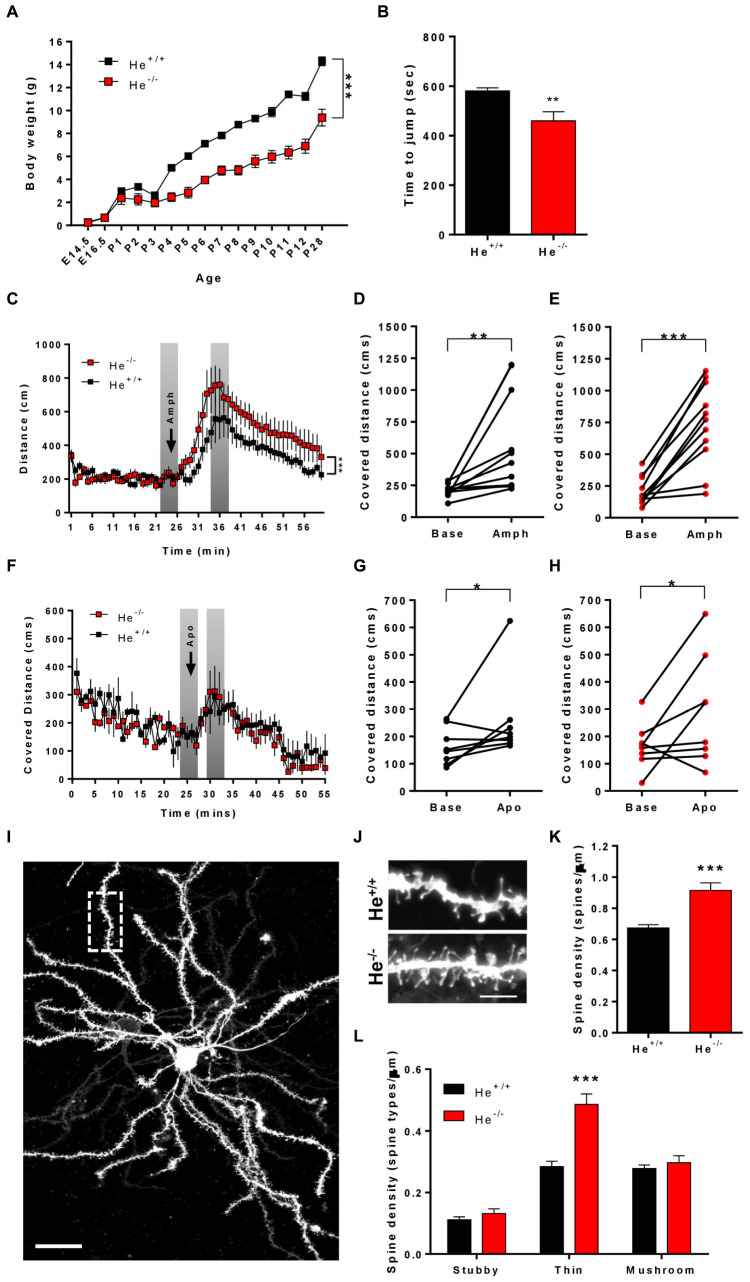
The role of the WDFY1 protein has been studied as a TLR3/4 scaffold/recruiting protein in the immune system and in different oncogenic conditions. However, its function in brain remains poorly understood. We have found that in mice devoid of Helios (He-/- mice), a transcription factor specifically expressed during the development of the immune cells and the central nervous system, there is a permanent and sustained increase of Wdfy1 gene expression in the striatum and hippocampus. Interestingly, we observed that WDFY1 protein levels were also increased in the hippocampus and dorsolateral prefrontal cortex of schizophrenic patients, but not in the hippocampus of Alzheimer's disease patients with an associated psychotic disorder. Accordingly, young He-/- mice displayed several schizophrenic-like behaviors related to dysfunctions in the striatum and hippocampus. These changes were associated with an increase in spine density in medium spiny neurons (MSNs) and with a decrease in the number and size of PSD-95-positive clusters in the stratum radiatum of the CA1. Moreover, these alterations in structural synaptic plasticity were associated with a strong reduction of neuronal NF-κB in the pyramidal layer of the CA1 in He-/- mice. Altogether, our data indicate that alterations involving the molecular axis Helios-WDFY1 in neurons during the development of core brain regions could be relevant for the pathophysiology of neuropsychiatric disorders such as schizophrenia.

Keywords: DISC1; FENS1; cortex; hippocampus; negative symptoms; psychosis; putamen.


Conflict of interest statement

The authors declare that the research was conducted in the absence of any commercial or financial relationships that could be construed as a potential conflict of interest.

Figures

FIGURE 1
FIGURE 1
WDFY1 protein and gene expression in He–/– mice. (A) mRNA levels of Adcy8, Aif1, Grm2, Kcne4, Lancl1 (two different probes: exons 1c-2 and exons 7–9), Ngfr, Pth2r, Vsnl1, and Wdfy1 (two different probes: exons 3–5 and exons 6–7) were determined in striatal samples of 8-week-old He+/+ and He–/– mice (n = 6 He+/+ and 6 He–/–; 3 males and 3 females per genotype). (B) mRNA levels of Adcy8, Aif1, Grm2, Kcne4, Lancl1 (two different probes: exons 1c-2 and exons 7–9), Ngfr, Pth2r, Vsnl1, and Wdfy1 (two different probes: exons 3–5 and exons 6–7) were determined in hippocampal samples of 8-week-old He+/+ and He–/– mice (n = 6/genotype). (C) Double staining for DAPI (blue) and WDFY1 (green) in the hippocampal CA1 of 8-week-old He+/+ and He–/– mice (left). White squares represent inset zones with their magnifications placed at right of each original CA1 image. Quantification (n = 2 He+/+ males and 2 He+/+ females, and 2 He–/– males and 3 He–/– females) of the intensity of the optical density (IOD) in the CA1 is shown separately for stratum oriens (S.O.), stratum pyramidale (S.P.), and stratum radiatum (S.R.). A linear intensity profile analysis as a mean IOD was performed in each image. Points in the X axis indicate mean IOD for each row of pixels. An independent statistical analysis was performed in each CA1 layer. Bars represent mean ± SEM. Data were analyzed by Student’s t-test for each gene in (A,B) and by two-way analysis of variance (ANOVA) in (C). In (A), ***p = 0.000106 and p = 0.0008 for Wdfy1 ex.3–5 and Wdfy1 ex.6–7 respectively when compared with He+/+ mice. In (B), ***p = 1,971446e-005 and p = 0.00018 for Wdfy1 ex.3–5 and Wdfy1 ex.6–7 respectively when compared with He+/+ mice. Scale bar, 70 (left images) and 10 μm (right images).
FIGURE 2
FIGURE 2
WDFY1 protein levels in patients with schizophrenia and in patients with Alzheimer’s disease with or without psychosis. (A) Immunoblotting for WDFY1 and Tubulin as a loading control in the hippocampus of human post-mortem samples from patients with schizophrenia (SCH) and control (CNT) individuals (n = 16 CNT and 32 SCH). Correlation analysis comparing WDFY1 protein levels in schizophrenic patients from (A) with (B) age or (C) post-mortem interval (PMI). (D) Immunoblotting for WDFY1 and Tubulin as a loading control in the dorsolateral prefrontal cortex of human post-mortem samples from patients with schizophrenia and control individuals (n = 10 CNT and 38 SCH). Correlation analysis comparing WDFY1 protein levels in schizophrenic patients from (D) with (E) age or (F) post-mortem interval (PMI). (G) Immunoblotting for WDFY1 and Tubulin as a loading control in the putamen of human post-mortem samples from patients with schizophrenia and control individuals (n = 8 CNT and 53 SCH). (H) Immunoblotting for VSNL1 and Tubulin as a loading control in the hippocampus of human post-mortem samples from patients with schizophrenia and control individuals (n = 16 CNT and 46 SCH). (I) Immunoblotting for WDFY1 and Tubulin as a loading control in the hippocampus of human post-mortem samples from patients with Alzheimer’s disease with (AD +) or without (AD-) associated/diagnosed psychotic symptoms and control (CNT) individuals (n = 8 CNT, 10 AD-, and 10 AD+). Bars represent mean ± SEM. Data were analyzed by Student’s t-test in (A,D,G,H), by Pearson’s correlation coefficient in (B,C,E,F) and by one-way ANOVA in (I) with the Tukey’s test as a post hoc. *p = 0.049, **p = 0.0065 when compared with CNT.
FIGURE 3
FIGURE 3
Characterization of schizophrenia-like phenotypes related to striatal function in He–/– mice. (A) The curve in graph depicts the body weight gain in both genotypes, He–/– and He+/+ mice from embryonic day 14.5 (E14.5) to postnatal day 28 (P28) (n = 3 He+/+ males and 4 He+/+ females, and 4 He–/– males and 4 He–/– females). (B) Time to jump out from the glass cylinder in 8-week-old He–/– and He+/+ mice (n = 4 He+/+ males and 4 He+/+ females, and 3 He–/– males and 4 He–/– females). (C) Locomotor activity in the open field was monitored for 25 min in He–/– and He+/+ mice (n = 6 He+/+ males and 5 He+/+ females, and 5 He–/– males and 6 He–/– females). After these 25 min, all mice received an injection of D-amphetamine sulfate (3 mg/kg) as indicated by the top arrow in the graph and the locomotor activity was subsequently monitored for additional 45 min. The induced locomotor activation in He+/+ (D) and He–/– (E) mice was evaluated by comparing representative covered distances from baseline and from treatment as depicted in gray in (C). (F) Locomotor activity in the open field was monitored for 25 min in He–/– and He+/+ mice (n = 8 He+/+ and 8 He–/–; 4 males an 4 females per genotype). After these 25 min, all mice received an injection of R-(-)-apomorphine (0.5 mg/kg) as indicated by the top arrow in the graph and the locomotor activity was subsequently monitored for additional 45 min. The induced locomotor activation in He+/+ (G) and He–/– (H) mice was evaluated by comparing representative covered distances from baseline and from treatment as depicted in gray in (F). (I) Representative images of a DiI-labeled medium spiny neuron (scale bar = 20 microns) and (J) representative medium spiny neuron dendrites from 8-weeks-old He+/+ and He–/– mice (scale bar = 3 microns). (K) Quantitative analysis showing dendritic spine density per micron of dendritic length from 8-week-old He+/+ and He–/– mice (n = 26 dendrites from 5 He+/+ mice, 2 males and 3 females, and 20 dendrites from 5 He–/– mice, 3 males and 2 females). (L) Density of each type of dendritic spine (stubby, thin, and mushroom) in dendrites of medium spiny neurons from (K) in He–/– and He+/+ mice. Total evaluated spines: 977 from He+/+ mice and 1088 from He–/– mice. Bars represent mean ± SEM. Data were analyzed by unpaired Student’s t-test in (B,K), by paired Student’s t-test in (D,E,G,H) and by two-way ANOVA in (A,C,F,L). **p < 0.01, ***p < 0.001 when compared with He+/+ mice in (A–C,F,K,L). *p < 0.05, **p < 0.01 when compared with baseline data in (D,E,G,H).
FIGURE 4
FIGURE 4
Characterization of schizophrenia-like phenotypes related to hippocampal function in He–/– mice. (A) Latency (in seconds) to reach the maternal area in He+/+ and He–/– mice at postnatal day 10 (left, n = 3 He+/+ males and 6 He+/+ females, and 3 He–/– males and 4 He–/– females) and postnatal day 14 (right, n = 3 He+/+ males and 4 He+/+ females, and 3 He–/– males and 3 He–/– females). (B) Time exploring the mouse (stranger 1) and empty (empty) cages during socialization in the three-chamber sociability test in 8-week-old He+/+ and He–/– mice (n = 6 He+/+ and 6 He–/–; 3 males and 3 females per genotype). (C) Time exploring the known (stranger 1) and the stranger mouse (stranger 2) cages in the social memory and novelty preference evaluation of the three-chamber sociability test in 8-weeks-old He+/+ and He–/– mice. (D) Representative inset (17 × 9 microns) of confocal images immunostained for PSD-95 in CA1 stratum radiatum (63x objective, digital zoom 5). Original area of analysis per field was 65 × 65 microns. For this experiment, 8-week-old He+/+ and He–/– mice (n = 2 He+/+ males and 3 He+/+ females, and 2 He–/– males and 3 He–/– females) were used. Scale bar = 10 microns. Quantification of the number (E) and size (F) of PSD-95-positive puncta per field. Bars represent mean ± SEM. Data were analyses by Student’s t-test in (A,E,F) and by two-way ANOVA with the Bonferroni’s post hoc test in (B,C). *p < 0.05, **p < 0.01 when compared with He+/+ mice in (A,E,F). ***p < 0.001 when compared with “empty” in (B) or “stranger 1” in (C).
FIGURE 5
FIGURE 5
Levels and distribution of DISC1 and NF-κB in the hippocampus of He–/– mice. (A) Immunoblotting for DISC1 and Tubulin as a loading control in the striatum (Str, n = 9/genotype) or hippocampus (Hipp, n = 10–11/genotype) of 8-week-old He+/+ and He–/– mice. Densitometry quantification in the striatal (B) and hippocampal (C) samples of results as in (A). Data were normalized to tubulin for each sample and expressed as percentage of wild type. (D) Representative confocal images of NF-κB immunofluorescence in CA1 (40x objective) of 8-week-old He+/+ and He–/– mice (n = 10 He+/+ and 8 He–/–). Scale bar = 70 microns. (E) Quantification of NF-κB the IOD per layer (total IOD mean per layer). Bars represent mean ± SEM. Data were analyzed by Student’s t-test. ***p < 0.001 when compared with He+/+ mice in (E).
FIGURE 6
FIGURE 6
WDFY1 protein levels in pharmacological models of schizophrenia. (A) Immunoblotting for WDFY1 and Tubulin as a loading control in the striatum (Str) and hippocampus (Hipp) of 10-week-old C57BL/6 mice treated with vehicle or amphetamine (3 mg/kg) or ketamine (30 mg/kg) for 8 days (n = 8 vehicle- (Veh), 10 ketamine- (Keta) and 11 amphetamine-treated (Amph) mice). (B) Densitometry quantification of results as in (A). Data were normalized to tubulin for each sample and expressed as percentage of wild type. (C) Immunoblotting for WDFY1 and Tubulin as a loading control in the striatum (Str), frontal cortex (FCtx) and hippocampus (Hipp) of C57BL/6 mice treated at postnatal day 5 with vehicle or LPS (6 mg/kg) or Poly I:C (6 mg/kg) and samples collected 24 h later (n = 9 vehicle- (Veh), 6 LPS- and 7 Poly I:C-treated mice). (D) Densitometry quantification of results as in (C). Data were normalized to tubulin for each sample and expressed as percentage of wild type. Bars represent mean ± SEM. Data were analyzed by one-way ANOVA and the Tukey’s test as a post hoc test in all panels.

References

    1. Alleva E., Calamandrei G. (1986). Odor-aversion learning and retention span in neonatal mouse pups. Behav. Neural Biol. 46 348–357. 10.1016/S0163-1047(86)90317-1 - DOI - PubMed
    1. Arisi I., D’Onofrio M., Brandi R., Felsani A., Capsoni S., Drovandi G., et al. (2011). Gene expression biomarkers in the brain of a mouse model for Alzheimer’s Disease: mining of microarray data by logic classification and feature selection. J. Alzheimer’s Dis. 24 721–738. 10.3233/JAD-2011-101881 - DOI - PubMed
    1. Baghel M. S., Singh B., Dhuriya Y. K., Shukla R. K., Patro N., Khanna V. K., et al. (2018). Postnatal exposure to poly (I:C) impairs learning and memory through changes in synaptic plasticity gene expression in developing rat brain. Neurobiol. Learn. Mem. 155 379–389. 10.1016/j.nlm.2018.09.005 - DOI - PubMed
    1. Baptista T. (1999). Body weight gain induced by antipsychotic drugs: mechanisms and management. Acta Psychiatr. Scand. 100 3–16. 10.1111/j.1600-0447.1999.tb10908.x - DOI - PubMed
    1. Betke K. M., Wells C. A., Hamm H. E. (2012). GPCR mediated regulation of synaptic transmission. Prog. Neurobiol. 96 304–321. 10.1016/j.pneurobio.2012.01.009 - DOI - PMC - PubMed