

An Innate Color Preference Displayed by Xenopus Tadpoles Is Persistent and Requires the Tegmentum
- PMID: 32477078
- PMCID: PMC7235192
- DOI: 10.3389/fnbeh.2020.00071
An Innate Color Preference Displayed by Xenopus Tadpoles Is Persistent and Requires the Tegmentum
Abstract
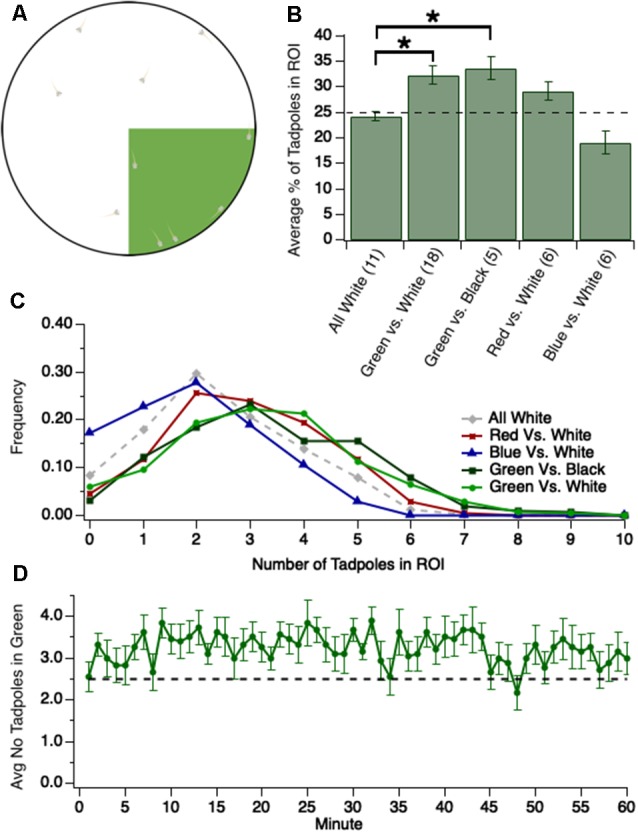
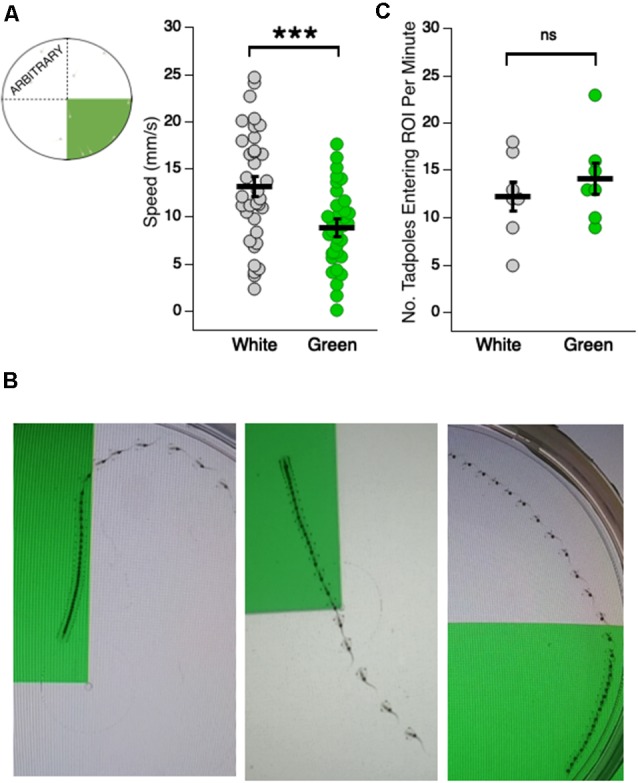
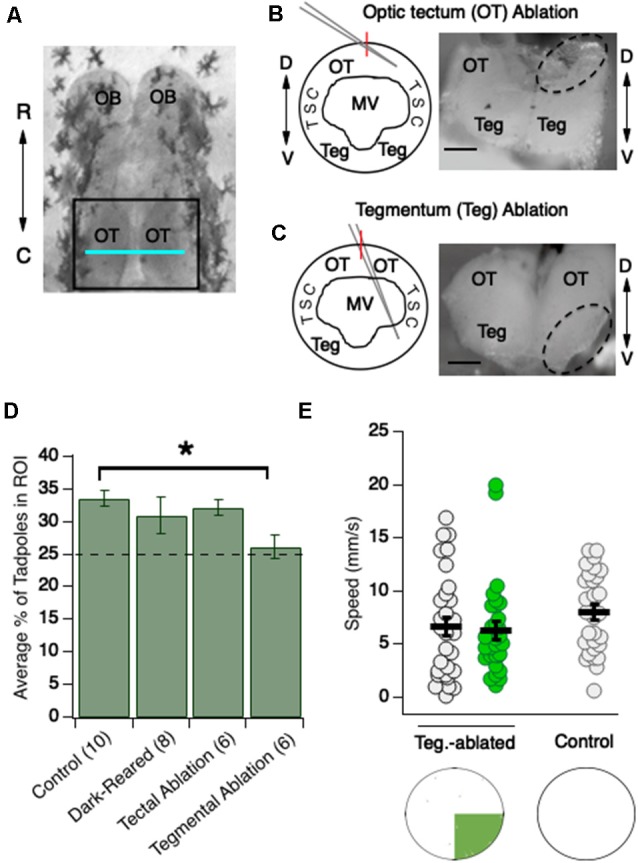
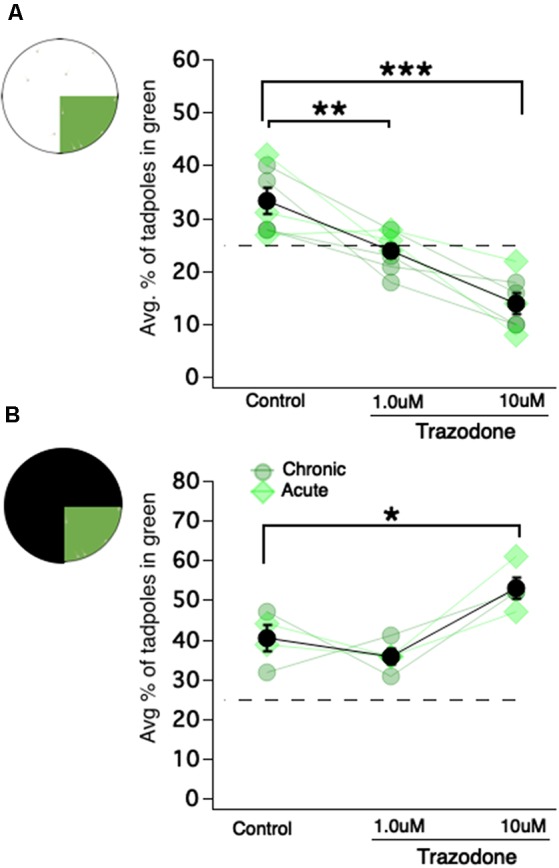
Many animals, especially those that develop externally, are equipped with innate color preferences that promote survival. For example, Xenopus tadpoles are known to phototax most robustly towards mid-spectrum ("green") wavelengths of light while avoiding shorter ("blue") wavelengths. The innate preference to phototax towards green likely promotes survival by guiding the tadpoles to green aquatic plants-their source of both food and safety. Here, we characterize the dynamics and circuitry that give rise to this intriguing hard-wired behavior. Using a novel open-field experimental paradigm we found that free-swimming tadpoles indeed spend most of their time in the green portion of the test dish, whether green is pitted against white (brighter than green) or black (darker than green). This preference was modest yet incredibly persistent over time, which, according to the shell game model of predator-prey interactions, minimizes being found by the predator. Furthermore, we found that this innate preference for the color green was experience-independent, and manifested mainly via profoundly slower swimming speeds while in the green region of the test dish. Ablation experiments showed that, at the circuit level, the color-guided swimming behavior requires the tegmentum, but not the optic tectum (OT). Lastly, we determined that exposing tadpoles to the selective serotonin reuptake inhibitor (SSRI) trazodone switched the tadpoles' preference from color-based to luminance-based, implicating two distinct visual circuits in the tadpole, one that is associated with color-driven behaviors, another associated with luminance-driven behaviors.
Keywords: Xenopus tadpole; behavior; color; innate; swimming speed; tegmentum; trazodone.
Copyright © 2020 Hunt, Bruno and Pratt.
Figures
Similar articles
-
A circadian-dependent preference for light displayed by Xenopus tadpoles is modulated by serotonin.iScience. 2022 Oct 17;25(11):105375. doi: 10.1016/j.isci.2022.105375. eCollection 2022 Nov 18. iScience. 2022. PMID: 36345330 Free PMC article.
-
Preference for background color of the Xenopus laevis tadpole.J Exp Zool. 1996 Dec 1;276(5):335-44. doi: 10.1002/(SICI)1097-010X(19961201)276:5<335::AID-JEZ4>3.0.CO;2-P. J Exp Zool. 1996. PMID: 8972584
-
The constant threat from a non-native predator increases tail muscle and fast-start swimming performance in Xenopus tadpoles.Biol Open. 2017 Nov 15;6(11):1726-1733. doi: 10.1242/bio.029926. Biol Open. 2017. PMID: 29141955 Free PMC article.
-
Early development and function of the Xenopus tadpole retinotectal circuit.Curr Opin Neurobiol. 2016 Dec;41:17-23. doi: 10.1016/j.conb.2016.07.002. Epub 2016 Jul 29. Curr Opin Neurobiol. 2016. PMID: 27475307 Review.
-
Central circuits controlling locomotion in young frog tadpoles.Ann N Y Acad Sci. 1998 Nov 16;860:19-34. doi: 10.1111/j.1749-6632.1998.tb09036.x. Ann N Y Acad Sci. 1998. PMID: 9928299 Review.
Cited by
-
A circadian-dependent preference for light displayed by Xenopus tadpoles is modulated by serotonin.iScience. 2022 Oct 17;25(11):105375. doi: 10.1016/j.isci.2022.105375. eCollection 2022 Nov 18. iScience. 2022. PMID: 36345330 Free PMC article.
-
Serotonin Strengthens a Developing Glutamatergic Synapse through a PI3K-Dependent Mechanism.J Neurosci. 2024 Feb 7;44(6):e1260232023. doi: 10.1523/JNEUROSCI.1260-23.2023. J Neurosci. 2024. PMID: 38169457 Free PMC article.
-
Ocular Necessities: A Neuroethological Perspective on Vertebrate Visual Development.Brain Behav Evol. 2024;99(2):96-108. doi: 10.1159/000536035. Epub 2024 Mar 8. Brain Behav Evol. 2024. PMID: 38447544 Free PMC article. Review.
-
Color Perspectives in Aquatic Explorations: Unveiling Innate Color Preferences and Psychoactive Responses in Freshwater Crayfish.Toxics. 2023 Oct 3;11(10):838. doi: 10.3390/toxics11100838. Toxics. 2023. PMID: 37888689 Free PMC article.
-
Extinction of Innate Floral Preferences in the Generalist Solitary Pollinator Eristalis tenax.J Chem Ecol. 2025 Aug 27;51(5):87. doi: 10.1007/s10886-025-01626-x. J Chem Ecol. 2025. PMID: 40864258 Free PMC article.
References
-
- Benjamini Y., Hochberg Y. (1995). Controlling the false discovery rate: a practical and powerful approach to multiple testing. J. R. Stat. Soci. B 57, 289–300. 10.1111/j.2517-6161.1995.tb02031.x - DOI
LinkOut - more resources
Full Text Sources