

Greater Short-Time Recovery of Peripheral Fatigue After Short- Compared With Long-Duration Time Trial
- PMID: 32477158
- PMCID: PMC7240104
- DOI: 10.3389/fphys.2020.00399
Greater Short-Time Recovery of Peripheral Fatigue After Short- Compared With Long-Duration Time Trial
Abstract
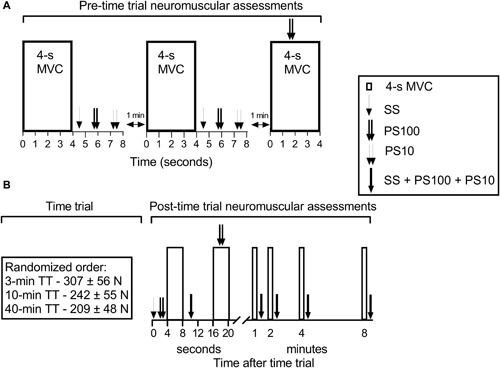
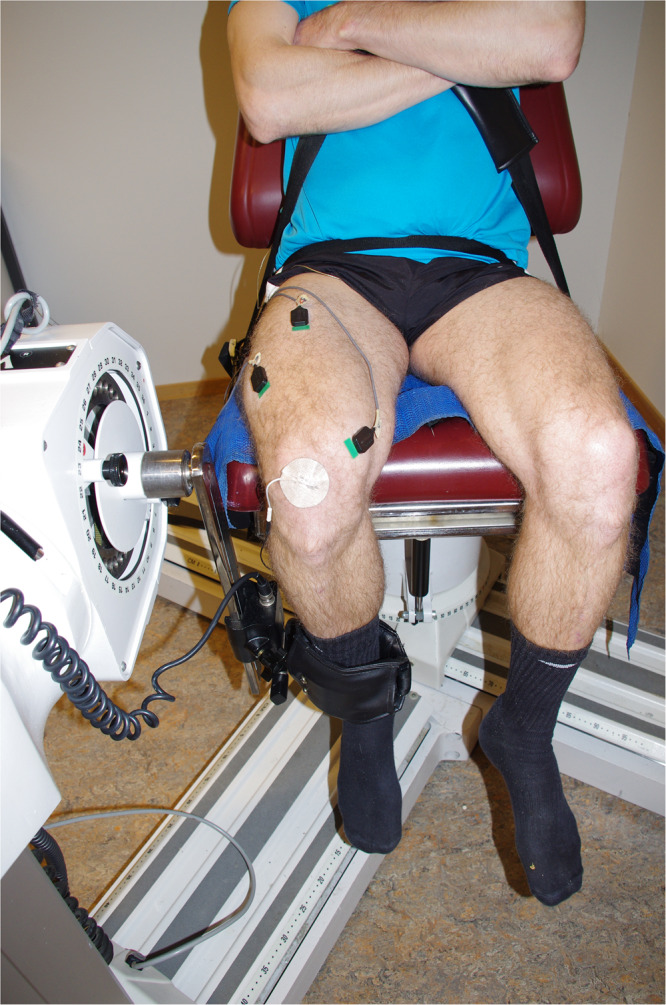
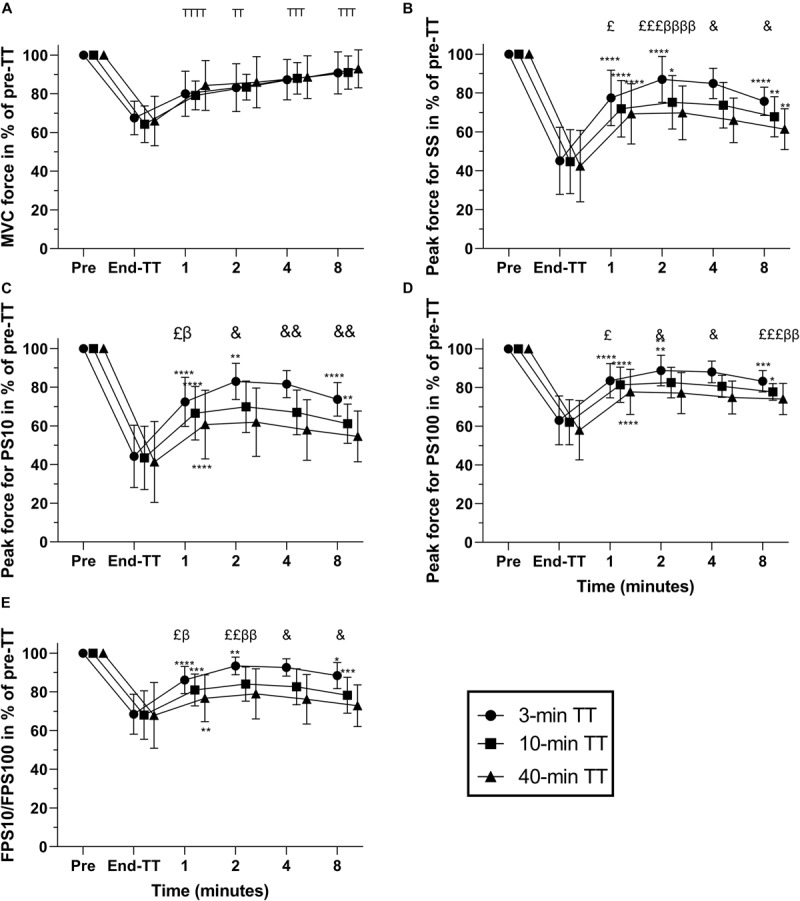
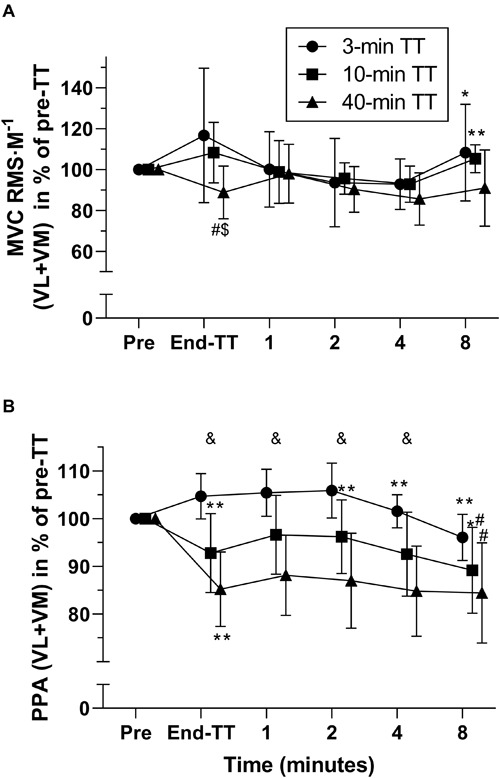
The kinetics of recovery from neuromuscular fatigue resulting from exercise time trials (TTs) of different durations are not well-known. The aim of this study was to determine if TTs of three different durations would result in different short-term recovery in maximal voluntary contraction (MVC) and evoked peak forces. Twelve trained subjects performed repetitive concentric right knee extensions on an isokinetic dynamometer self-paced to last 3, 10, and 40 min (TTs). Neuromuscular function was assessed immediately (<2 s) and 1, 2, 4, and 8 min after completion of each TT using MVCs and electrical stimulation. Electrical stimulations consisted of single stimulus (SS), paired stimuli at 10 Hz (PS10), and paired stimuli at 100 Hz (PS100). Electrically evoked forces including the ratio of low- to high-frequency doublets were similar between trials at exercise cessation but subsequently increased more (P < 0.05) after the 3 min TT compared with either the 10 or 40 min TT when measured at 1 or 2 min of recovery. MVC force was not different between trials. The results demonstrate that recovery of peripheral fatigue including low-frequency fatigue depends on the duration and intensity of the preceding self-paced exercise. These differences in recovery probably indicate differences in the mechanisms of fatigue for these different TTs. Because recovery is faster after a 3 min TT than a 40 min TT, delayed assessment of fatigue will detect a difference in peripheral fatigue between trials that was not present at exercise cessation.
Keywords: electromyography; femoral nerve electrical stimulation; maximal voluntary contraction; motor unit recruitment; peripheral fatigue; recovery; self-paced exercise.
Copyright © 2020 Froyd, Beltrami, Millet, MacIntosh and Noakes.
Figures
Similar articles
-
Central Regulation and Neuromuscular Fatigue during Exercise of Different Durations.Med Sci Sports Exerc. 2016 Jun;48(6):1024-32. doi: 10.1249/MSS.0000000000000867. Med Sci Sports Exerc. 2016. PMID: 26741123
-
No Critical Peripheral Fatigue Threshold during Intermittent Isometric Time to Task Failure Test with the Knee Extensors.Front Physiol. 2016 Dec 19;7:627. doi: 10.3389/fphys.2016.00627. eCollection 2016. Front Physiol. 2016. PMID: 28066260 Free PMC article.
-
Central and peripheral fatigue in male cyclists after 4-, 20-, and 40-km time trials.Med Sci Sports Exerc. 2015 Mar;47(3):537-46. doi: 10.1249/MSS.0000000000000448. Med Sci Sports Exerc. 2015. PMID: 25051388
-
The development of peripheral fatigue and short-term recovery during self-paced high-intensity exercise.J Physiol. 2013 Mar 1;591(5):1339-46. doi: 10.1113/jphysiol.2012.245316. Epub 2012 Dec 10. J Physiol. 2013. PMID: 23230235 Free PMC article.
-
Neuromuscular Fatigue at Task Failure and During Immediate Recovery after Isometric Knee Extension Trials.Sports (Basel). 2018 Nov 28;6(4):156. doi: 10.3390/sports6040156. Sports (Basel). 2018. PMID: 30487392 Free PMC article.
Cited by
-
Neuromechanical Differences between Pronated and Supinated Forearm Positions during Upper-Body Wingate Tests.J Sports Sci Med. 2024 Jun 1;23(2):396-409. doi: 10.52082/jssm.2024.396. eCollection 2024 Jun. J Sports Sci Med. 2024. PMID: 38841629 Free PMC article.
-
Kinesio Taping Increases Peak Torque of Quadriceps Muscle After Arthroscopic Meniscectomy, Double-Blinded RCT.Int J Gen Med. 2024 May 6;17:1897-1908. doi: 10.2147/IJGM.S463753. eCollection 2024. Int J Gen Med. 2024. PMID: 38736667 Free PMC article.
-
Determinants of whole-body maximal aerobic performance in young male and female athletes: The roles of lower extremity muscle size, strength and power.PLoS One. 2022 Jan 12;17(1):e0262507. doi: 10.1371/journal.pone.0262507. eCollection 2022. PLoS One. 2022. PMID: 35020757 Free PMC article.
References
LinkOut - more resources
Full Text Sources