. 2020 May 7:11:843.
doi: 10.3389/fmicb.2020.00843. eCollection 2020.

Global Distribution and Evolution of Mycobacterium bovis Lineages

Affiliations

Global Distribution and Evolution of Mycobacterium bovis Lineages

Cristina Kraemer Zimpel et al. Front Microbiol. .

Abstract

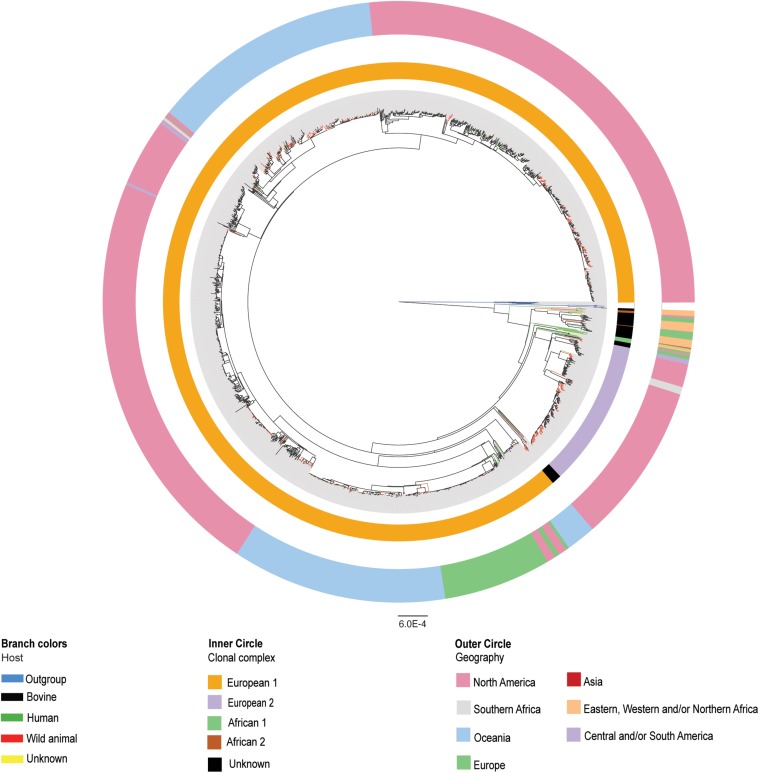
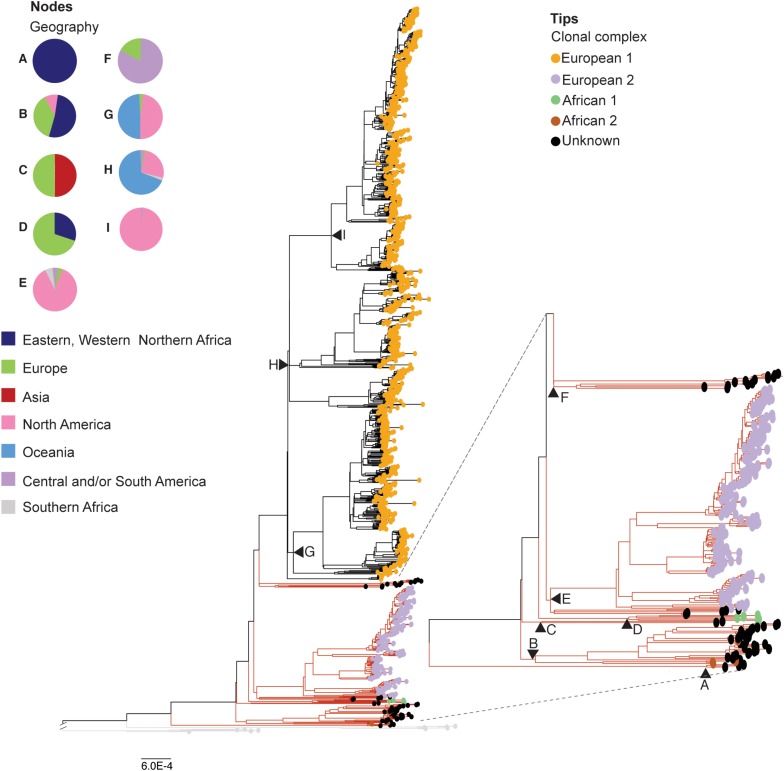
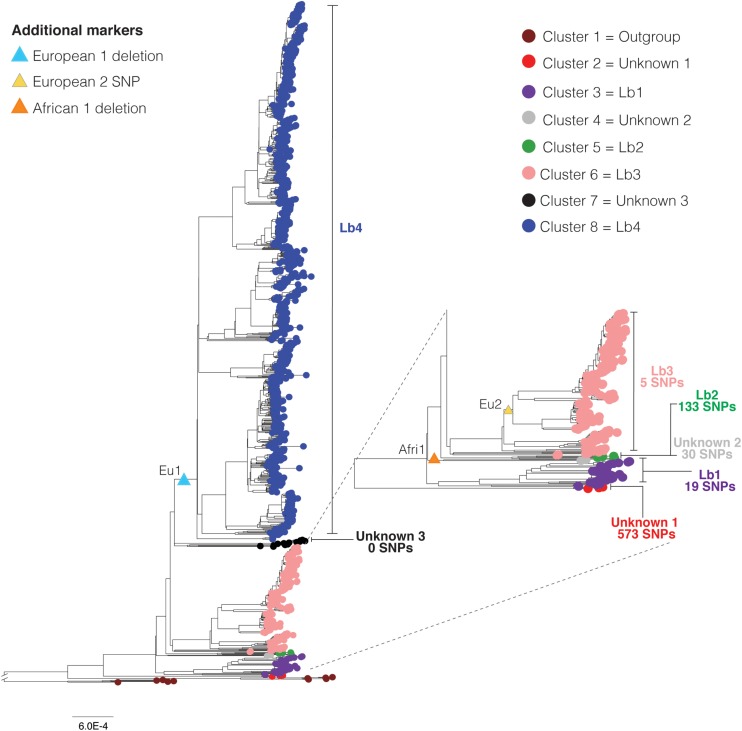
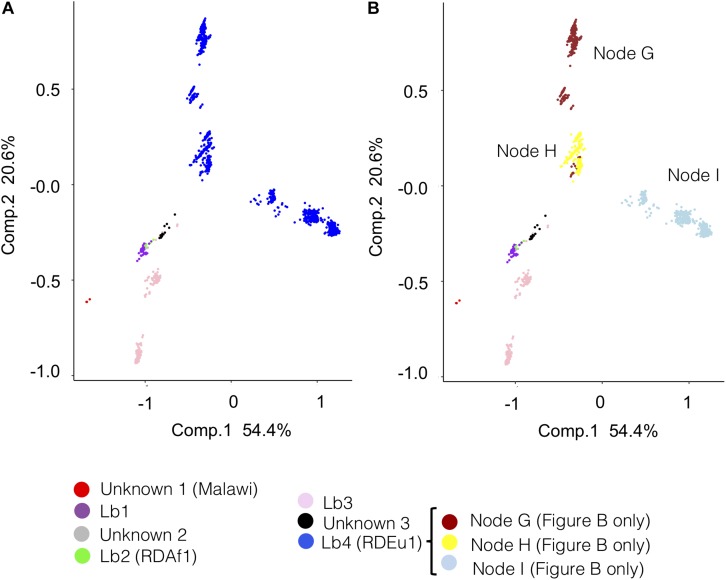
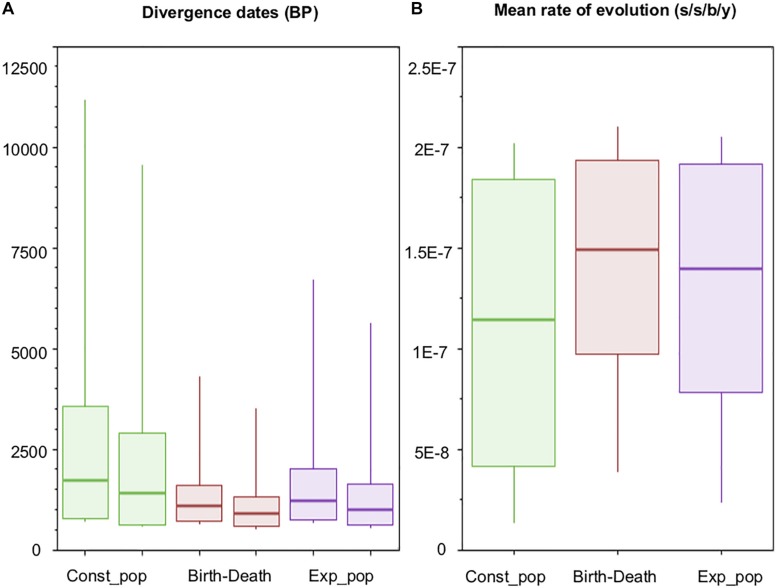
Mycobacterium bovis is the main causative agent of zoonotic tuberculosis in humans and frequently devastates livestock and wildlife worldwide. Previous studies suggested the existence of genetic groups of M. bovis strains based on limited DNA markers (a.k.a. clonal complexes), and the evolution and ecology of this pathogen has been only marginally explored at the global level. We have screened over 2,600 publicly available M. bovis genomes and newly sequenced four wildlife M. bovis strains, gathering 1,969 genomes from 23 countries and at least 24 host species, including humans, to complete a phylogenomic analyses. We propose the existence of four distinct global lineages of M. bovis (Lb1, Lb2, Lb3, and Lb4) underlying the current disease distribution. These lineages are not fully represented by clonal complexes and are dispersed based on geographic location rather than host species. Our data divergence analysis agreed with previous studies reporting independent archeological data of ancient M. bovis (South Siberian infected skeletons at ∼2,000 years before present) and indicates that extant M. bovis originated between 715 and 3,556 years BP, with later emergence in the New World and Oceania, likely influenced by trades among countries.

Keywords: Mycobacterium bovis; bovine tuberculosis (bTB); evolution; genomic; lineage.


Figures

FIGURE 1
FIGURE 1
Phylogenetic reconstruction of the complete dataset of Mycobacterium bovis genomes (n = 1,969). Maximum likelihood phylogenetic tree based on single nucleotide polymorphisms (SNPs) of 1,969 Mycobacterium bovis genomes, using Mycobacterium caprae and Mycobacterium orygis as outgroup. The host species are marked in black branches for bovine, red branches for wild animals, green branches for humans, and yellow branches for unknown host identification. Outgroup members are marked in blue branches. Clonal complexes (inner circle) are marked in orange for European 1 (Eu1), purple for European 2 (Eu2), green for African 1 (Af1), brown for African 2 (Af2), and black for unknown. Geographical origin (outer circle) of M. bovis isolates are marked in pink for North America, gray for Southern Africa, blue for Oceania, purple for Central and/or South America, red for Asia, orange for Eastern, Western and/or Northern Africa, and green for Europe. Phylogenetic tree was generated using IQ-Tree with 1,000 bootstrap replicas and annotated using Iroki (Moore et al., 2019) and Adobe Illustrator. Bootstrap replicas of main nodes are all ≥90% and can be visualized in Supplementary Figure S2. Bar shows substitutions per nucleotide.
FIGURE 2
FIGURE 2
Phylogenetic reconstruction of the reduced dataset of Mycobacterium bovis genomes (n = 1,201). Maximum likelihood phylogenetic tree based on single nucleotide polymorphisms (SNPs) of 1,201 Mycobacterium bovis genomes, using Mycobacterium caprae and Mycobacterium orygis as outgroup. Phylogenetic tree colored based clonal complexes (CC) at the tips. Clonal complexes (circled tips): European 1 (Eu1) in orange, and European 2 (Eu2) in purple, African 1 (Af1) in green, African 2 (Af2) in brown, Unknown CC in black. Black triangles: main nodes A-I, with corresponding geographic origin of M. bovis genomes emerging from each node depicted by the pie charts. Branch lengths of outgroups (in light gray branches) were reduced to improve visualization of the figure. Red branches indicate a subtree that was magnified to improve visualization. Phylogenetic tree was generated using IQ-Tree with 1,000 bootstrap replicas and annotated using Iroki (Moore et al., 2019) and Adobe Illustrator. Bootstrap replicas of discussed nodes are all ≥ 95% and can be visualized in Supplementary Figure S2. Bar shows substitutions per nucleotide.
FIGURE 3
FIGURE 3
Phylogenetic clustering, SNP (single nucleotide polymorphism) markers, and lineages of Mycobacterium bovis. Maximum likelihood phylogenetic tree based on SNPs of 1,201 Mycobacterium bovis genomes (reduced dataset), using Mycobacterium caprae and Mycobacterium orygis as outgroup. Deletions and SNP correspond to the clonal complex markers European 1 (Eu1), European 2 (Eu2) and African 1 (Af1), indicated by triangles. Seven M. bovis clusters (2 through 8) were identified using TreeCluster (Balaban et al., 2019) and they are indicated by colored tips. Cluster 1 corresponds to the outgroup composed of M. orygis and M. caprae genomes. Cluster 1 was reported by TreeCluster as being two separated clusters (one for M. orygis and one for M. caprae genomes). In this figure we colored these clusters as one to facilitate visualization and understanding. Clusters 2–8 correspond to M. bovis genomes. Vertical bars indicate the number of unique SNPs in each cluster. Sixty-eight unique SNPs were also found among M. bovis genomes of the Eu2 clonal complex. The cluster “unknown 3” shares 33 SNPs with clusters 2, 3, 4, 5, and 6. Branch lengths of outgroups were reduced to improve visualization of the figure. Subtree is depicted separately to improve its visualization. Phylogenetic tree was generated using IQ-Tree with 1,000 bootstrap replicas and annotated using Iroki (Moore et al., 2019) and Adobe Illustrator. Bootstrap replicas of discussed nodes are all ≥90% and can be visualized in Supplementary Figure S2. Bar shows substitutions per nucleotide.
FIGURE 4
FIGURE 4
Principal component analysis (PCA) of Mycobacterium bovis lineages according to the reduced dataset (n = 1,201). The PCA graphs were constructed using the SNP (single nucleotide polymorphism) matrix of the 1,201 Mycobacterium bovis genomes. (A) PCA colored according to the proposed M. bovis lineages (Lb1, Lb2, Lb3, and Lb4) and unknown clusters (unknown 1, 2, and 3). (B) PCA colored according to the proposed lineages Lb1, Lb2, and Lb3, unknown clusters (unknown 1, 2, and 3) and clusters of M. bovis genomes emerging from nodes G, H, and I of Lb4 as depicted in the phylogenetic tree in Figure 2. The four inferred M. bovis lineages and unknown clusters are shown in purple – Lb1; green – Lb2; pink – Lb3; blue – Lb4; red – cluster unknown 1 (Malawi); gray – cluster unknown 2; black – cluster unknown 3. PCA analysis in 3 dimensions is shown in Supplementary Figure S5. PCA analyses using full dataset (n = 1,969) are shown in Supplementary Figures S6, S7.
FIGURE 5
FIGURE 5
Dating estimates and molecular rates of evolution. Box-Plots showing (A) 95% highest posterior densities (95% HPDs) of origin and divergence times of Mycobacterium bovis, for each of the three models with relatively better fit (see text for details); and (B) 95% HPDs of the mean rate of evolution across Markov Chain Monte Carlo MCMC generations (parameter ‘meanRate’ in BEAST). s/s/b/y: substitution/site/branch/year.

References

    1. Ayele W. Y., Neill S. D., Zinsstag J., Weiss M. G., Pavlik I. (2004). Bovine tuberculosis: an old disease but a new threat to Africa. Int. J. Tuberc. Lung Dis. 8 924–937. - PubMed
    1. Baele G., Lemey P., Bedford T., Rambaut A., Suchard M. A., Alekseyenko A. V. (2012a). Improving the accuracy of demographic and molecular clock model comparison while accommodating phylogenetic uncertainty research article. Mol. Biol. Evol. 29 2157–2167. 10.1093/molbev/mss084 - DOI - PMC - PubMed
    1. Baele G., Lok W., Li S., Drummond A. J., Suchard M. A., Lemey P. (2012b). Accurate model selection of relaxed molecular clocks in bayesian phylogenetics letter fast track. Mol. Biol. Evol. 30 239–243. 10.1093/molbev/mss243 - DOI - PMC - PubMed
    1. Balaban M., Moshiri N., Mai U., Jia X., Mirarab S. (2019). TreeCluster: clustering biological sequences using phylogenetic trees. PLoS One 14:e0221068. 10.1371/journal.pone.0221068 - DOI - PMC - PubMed
    1. Berg S., Garcia-Pelayo M. C., Müller B., Hailu E., Asiimwe B., Kremer K., et al. (2011). African 2, a clonal complex of Mycobacterium bovis epidemiologically important in East Africa. J. Bacteriol. 193 670–678. 10.1128/JB.00750-10 - DOI - PMC - PubMed

LinkOut - more resources