. 2020 May 14:11:843.
doi: 10.3389/fimmu.2020.00843. eCollection 2020.

Serum Amyloid A1 (SAA1) Revisited: Restricted Leukocyte-Activating Properties of Homogeneous SAA1

Affiliations

Serum Amyloid A1 (SAA1) Revisited: Restricted Leukocyte-Activating Properties of Homogeneous SAA1

Sara Abouelasrar Salama et al. Front Immunol. .

Abstract

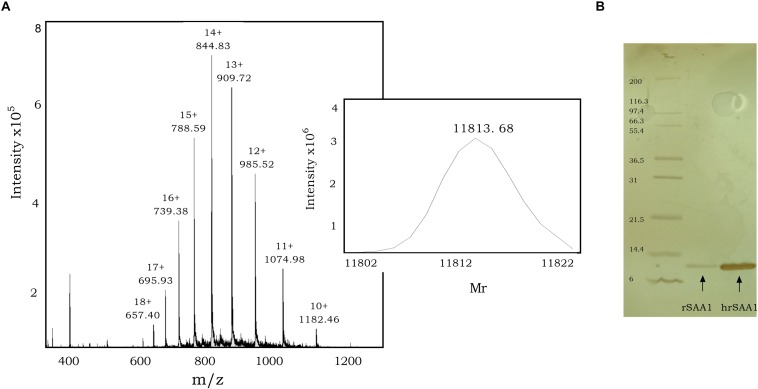
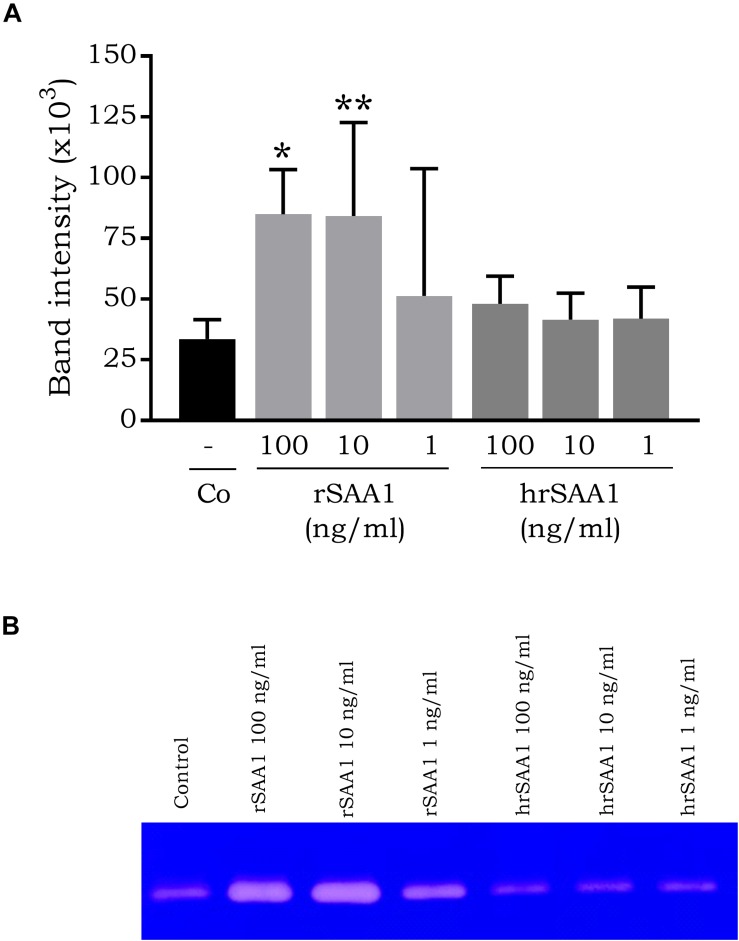
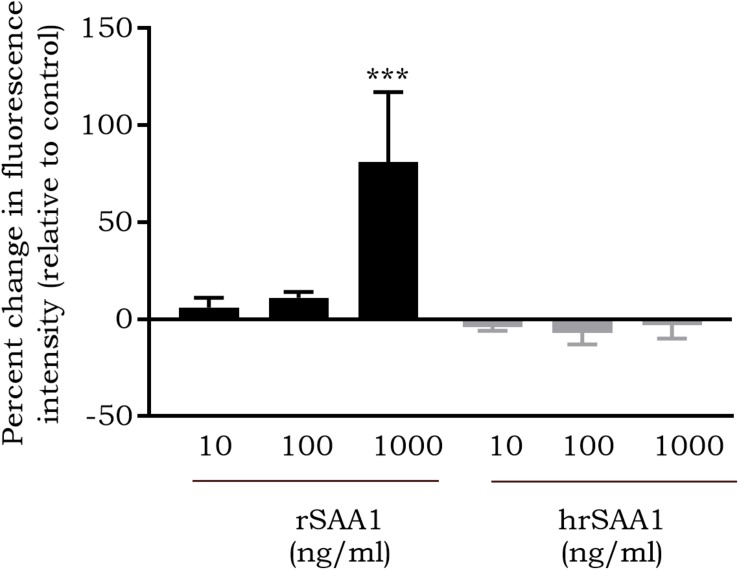
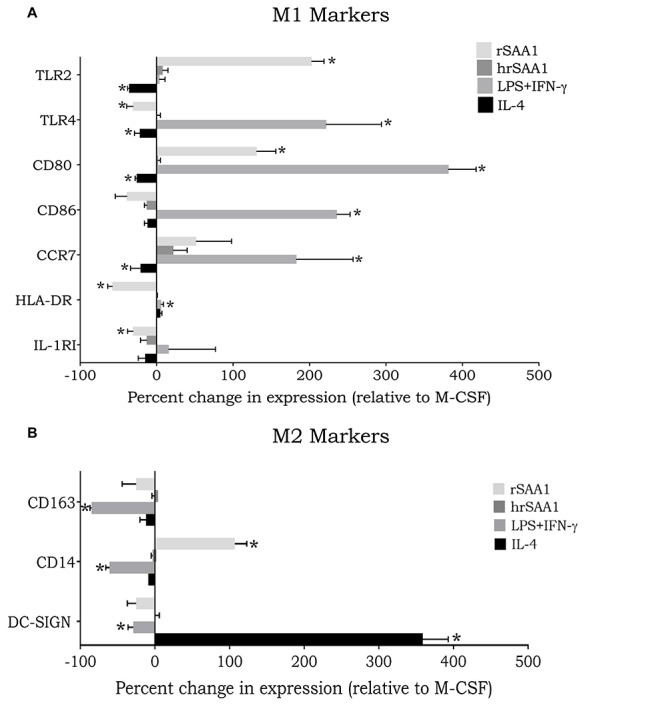
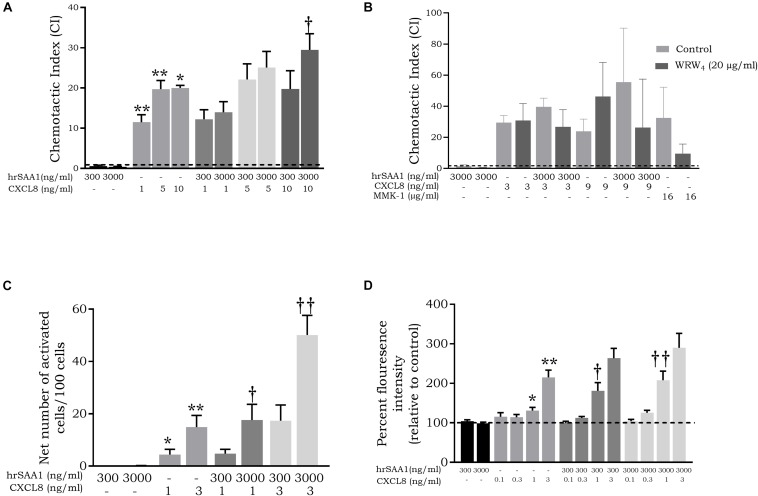
Infection, sterile injury, and chronic inflammation trigger the acute phase response in order to re-establish homeostasis. This response includes production of positive acute phase proteins in the liver, such as members of the serum amyloid A (SAA) family. In humans the major acute phase SAAs comprise a group of closely related variants of SAA1 and SAA2. SAA1 was proven to be chemotactic for several leukocyte subtypes through activation of the G protein-coupled receptor FPRL1/FPR2. Several other biological activities of SAA1, such as cytokine induction, reported to be mediated via TLRs, have been debated recently. Especially commercial SAA1, recombinantly produced in Escherichia coli, was found to be contaminated with bacterial products confounding biological assays performed with this rSAA1. We purified rSAA1 by RP-HPLC to homogeneity, removing contaminants such as lipopolysaccharides, lipoproteins and formylated peptides, and re-assessed several biological activities attributed to SAA1 (chemotaxis, cytokine induction, MMP-9 release, ROS generation, and macrophage differentiation). The homogeneous rSAA1 (hrSAA1) lacked most cell-activating properties, but its leukocyte-recruiting capacity in vivo and it's in vitro synergy with other leukocyte attractants remained preserved. Furthermore, hrSAA1 maintained the ability to promote monocyte survival. This indicates that pure hrSAA1 retains its potential to activate FPR2, whereas TLR-mediated effects seem to be related to traces of bacterial TLR ligands in the E. coli-produced human rSAA1.

Keywords: FPR2; MMP-9; ROS; SAA; chemokines; chemotaxis; macrophages; neutrophils.


Figures

FIGURE 1
FIGURE 1
Purification of rSAA1 using RP-HPLC to homogeneity. (A) Relative molecular mass determination of RP-HPLC-purified homogenous rSAA1 (hrSAA1) by mass spectrometry. The averaged mass spectrum of the pooled hrSAA1 fractions is shown with the ion intensities, the number of charges and the corresponding mass over charge ratio (m/z) for multiple charged ions. The experimentally determined deconvoluted mass spectrum of uncharged hrSAA1, as calculated by the Bruker deconvolution software, is shown as an insert at the right of the mass spectrum. (B) Homogenous rSAA1 (hrSAA1; 200 ng) was analyzed in parallel to rSAA1 (20 ng) using SDS–PAGE and silver staining. The molecular mass of the standard marker proteins is indicated in kilodalton.
FIGURE 2
FIGURE 2
rSAA1 treated with RP-HPLC elution solvents retains its biological activity. (A) The chemotactic activity of rSAA1 treated with 50% acetonitrile and 0.1% trifluoroacetic acid (ST rSAA1) was evaluated on human neutrophils in the Boyden microchamber assay. The chemotactic potencies are expressed as mean chemotactic index + SEM derived from three independent experiments. Control migration is indicated by a dashed line (—). (B) FPR2-transfected HEK293 cells were stimulated with rSAA1 (6000 ng/ml, 500 nM) treated with 50% acetonitrile and 0.1% trifluoroacetic acid. Afterward, the cells were stimulated with WKYMVm (10 ng/ml, 12 nM) as control. (C) FPR2-transfected HEK293 cells were stimulated with WKYMVm (10 ng/ml, 12 nM). (D) FPR1-transfected HEK293 cells were stimulated with rSAA1 (6000 ng/ml, 500 nM). Afterward, the cells were stimulated with fMLF (10–10 M) as control. (E) FPR1-transfected HEK293 cells were stimulated with fMLF (10–10 M). (B–E) Changes in intracellular calcium levels were monitored by spectrophotometry. Results are presented as the ratio of emission of calcium-bound fura over calcium-free fura. One representative experiment out of two independent experiments is shown.
FIGURE 3
FIGURE 3
hrSAA1 does not induce chemokine expression in CD14+ monocytes and treatment of rSAA1 with LPL diminishes activity. (A,C) Freshly isolated monocytes were induced with homogenous rSAA1 (hrSAA1) (1–12000 ng/ml, 0.08–1000 nM) in parallel with rSAA1 (1–12000 ng/ml, 0.08–1000 nM). (B,D) rSAA1 (100 ng/ml, 8 nM) was pre-incubated with LPL (2000 ng/ml) for 4 h prior to stimulation of monocytes. Following an incubation period of 24 h, cell supernatants were collected and CXCL8 and CCL3 expression was determined via specific ELISAs. Expression in unstimulated cells is indicated by a dashed line (—). Results are represented as the mean chemokine concentration + SEM and are derived from four to six independent experiments. Significant upregulation in comparison to control is indicated by asterisks (Mann-Whitney U-test; *p-value < 0.05, **p-value < 0.01). Significant reduction in inductive capacity following LPL treatment is indicated by a dagger (Mann-Whitney U-test; †p-value < 0.05).
FIGURE 4
FIGURE 4
hrSAA1 does not induce MMP-9 expression in CD14+ monocytes. Freshly isolated monocytes were induced with homogenous rSAA1 (hrSAA1) (1–100 ng/ml, 0.08–8 nM) in parallel with rSAA1 (1–100 ng/ml, 0.08–8 nM). Following an incubation period of 24 h, cell supernatants were collected and MMP-9 expression was determined via zymography. (A) Results are represented as the mean band intensity (×103) + SEM and are derived from four to six independent experiments. Significant upregulation in comparison to control is indicated by asterisks (Mann-Whitney U-test; *p-value < 0.05, **p-value < 0.01). (B) One representative zymography is shown.
FIGURE 5
FIGURE 5
hrSAA1 does not induce ROS production in CD14+ monocytes. Freshly isolated monocytes were stimulated with homogenous rSAA1 (hrSAA1) (10–1000 ng/ml, 0.8–80 nM) in parallel with rSAA1 (10–1000 ng/ml, 0.8–80 nM). Following an incubation period of 1 h, staining with 2′,7′-dichlorofluorescein diacetate (50 μM) was carried out and flow cytometry was used to quantify ROS production. Results are presented as the mean percent change in fluorescence intensity in comparison to buffer-treated cells + SEM (i.e., 0% is equivalent to the same fluorescence intensity as obtained for buffer-treated cells) and are derived from four to seven independent experiments. Significant upregulation in comparison to control is indicated by asterisks (Mann-Whitney U-test; ***p-value < 0.001).
FIGURE 6
FIGURE 6
hrSAA1 does not mediate macrophage polarization. Freshly isolated monocytes were treated with M-CSF (100 ng/ml, 2.7 nM) on day 0 to induce macrophage differentiation. On day 4 cells were treated with IFN-γ (25 ng/ml, 1.5 nM) plus LPS (100 ng/ml), IL-4 (20 ng/ml, 1.3 nM), rSAA1 (100 ng/ml, 8 nM), or homogenous rSAA1 (hrSAA1) (100 ng/ml, 8 nM) to promote macrophage polarization. On day 6 of culture, macrophages were collected and analyzed for expression of (A) M1 markers and (B) M2 markers using flow cytometry. Results are presented as the mean percent change in expression compared to M-CSF-treated cells + SEM (i.e., 0% is equivalent to the same expression level as M-CSF-treated cells) and are derived from seven independent experiments. Significant upregulation in comparison to control is indicated by asterisks (Wilcoxon signed-rank test; *p-value < 0.05).
FIGURE 7
FIGURE 7
hrSAA1 promotes the survival of monocytes. Freshly isolated monocytes were treated with hrSAA1 (300 or 3000 ng/ml, 25 or 250 nM), rSAA1 (300 or 3000 ng/ml, 25 or 250 nM), M-CSF (20 ng/ml, 0.54 nM) or left untreated (control) for a period of 24 h. Following stimulation, ATP levels were detected using firefly luciferase luminescence. Control survival is indicated by a dashed line (—). Results are presented as the mean percent of survival in comparison to control + SEM and are derived from five independent experiments. Significant survival in comparison to control is indicated by asterisks (Mann-Whitney U-test; *p-value < 0.05, **p-value < 0.01).
FIGURE 8
FIGURE 8
hrSAA1 induces in vivo recruitment of neutrophils and mononuclear cells. C57BL/6J male mice (8–10 mice per group) were intra-articularly injected with homogenous rSAA1 (hrSAA1; 100 or 500 ng/10 μl), rSAA1 (100 ng/10 μl) or 0.9% sodium chloride (control; 10 μl). Following an incubation period of 3 h, cells from the joint were collected and cytospins were prepared. Each dot represents one mouse and the horizontal line indicates the median number of recruited (A) neutrophils and (B) mononuclear cells per ml. Data are derived from two independent experiments. Significant leukocyte recruitment in comparison to control is indicated by asterisks (Mann-Whitney U-test; **p-value < 0.01, ***p-value < 0.001).
FIGURE 9
FIGURE 9
hrSAA1 retains the capacity to synergize with CXCL8 in the in vitro attraction and activation of neutrophils. (A) Homogenous rSAA1 (hrSAA1, 300 or 3000 ng/ml, 25 or 250 nM) and CXCL8 (1–10 ng/ml, 0.12–1.2 nM) were added to the lower compartment of a Boyden microchamber either alone or in combination. Freshly isolated neutrophils were added to the upper compartment and allowed to migrate for 45 min. The chemotactic potencies are expressed as mean chemotactic index (+SEM) derived from six independent experiments. Control recruitment is indicated by a dashed line (—). (B) MMK-1 (16 μg/ml, 9930 nM), hrSAA1 (3000 ng/ml, 250 nM), CXCL8 (3 or 9 ng/ml, 0.36 or 1.07 nM) or a combination of hrSAA1 and CXCL8 were added to the lower compartment of a Boyden microchamber. Freshly isolated neutrophils in the presence or absence of the FPR2 antagonist WRW4 (20 μg/ml, 18110 nM) were added to the upper compartment and allowed to migrate for 45 min. The chemotactic potencies are expressed as mean chemotactic index + SEM and are derived from three independent experiments. Control recruitment is indicated by a dashed line (—). (C) Neutrophils were stimulated (3 min) with homogenous hrSAA1 (300 or 3000 ng/ml, 25 or 250 nM), CXCL8 (1 or 3 ng/ml, 0.12 or 0.36 nM) or a combination of hrSAA1 and CXCL8. Data from six independent experiments are expressed as the net percentage of activated cells (blebbed and elongated cells) (+SEM). (D) Freshly isolated neutrophils were stimulated for 30 s with different concentrations of hrSAA1, CXCL8 or a combination of hrSAA1 and CXCL8. Following stimulation, cells were stained with Alexa Fluor 555 Phalloidin. Control actin polymerization is indicated by a dashed line (—). Results are presented as the mean percent florescence intensity relative to buffer-stimulated cells (+SEM) and are derived from six independent experiments. Significant neutrophil recruitment/activation in comparison to control is indicated by asterisks (Mann-Whitney U-test; *p-value < 0.05, **p-value < 0.01). Significant synergy between hrSAA1 and CXCL8 in neutrophil activation/recruitment is indicated by daggers (Mann-Whitney U-test; †p-value < 0.05, ††p-value < 0.01).

Similar articles

Cited by

References

    1. Saranya Revathy K, Umasuthan N, Whang I, Lee Y, Lee S, Oh MJ, et al. A novel acute phase reactant, serum amyloid A-like 1, from Oplegnathus fasciatus: genomic and molecular characterization and transcriptional expression analysis. Dev Comp Immunol. (2012) 37:294–305. 10.1016/j.dci.2012.03.014 - DOI - PubMed
    1. De Buck M, Gouwy M, Wang JM, Van Snick J, Opdenakker G, Struyf S, et al. Structure and expression of different serum amyloid A (SAA) variants and their concentration-dependent functions during host insults. Curr Med Chem. (2016) 23:1725–55. 10.2174/0929867323666160418114600 - DOI - PMC - PubMed
    1. Wang X, Chai H, Wang Z, Lin PH, Yao Q, Chen C. Serum amyloid A induces endothelial dysfunction in porcine coronary arteries and human coronary artery endothelial cells. Am J Physiol Heart Circ Physiol. (2008) 295:H2399–408. 10.1152/ajpheart.00238.2008 - DOI - PMC - PubMed
    1. Tomita T, Ieguchi K, Sawamura T, Maru Y. Human serum amyloid A3 (SAA3) protein, expressed as a fusion protein with SAA2, binds the oxidized low density lipoprotein receptor. PLoS One. (2015) 10:e0118835. 10.1371/journal.pone.0118835 - DOI - PMC - PubMed
    1. Nishida E, Aino M, Kobayashi S-I, Okada K, Ohno T, Kikuchi T, et al. Serum amyloid A promotes E-selectin expression via toll-like receptor 2 in human aortic endothelial cells. Mediators Inflamm. (2016) 2016:7150509. 10.1155/2016/7150509 - DOI - PMC - PubMed

Publication types

MeSH terms