. 2020 May 12:11:490.
doi: 10.3389/fgene.2020.00490. eCollection 2020.

SCSA: A Cell Type Annotation Tool for Single-Cell RNA-seq Data

Affiliations

SCSA: A Cell Type Annotation Tool for Single-Cell RNA-seq Data

Yinghao Cao et al. Front Genet. .

Abstract

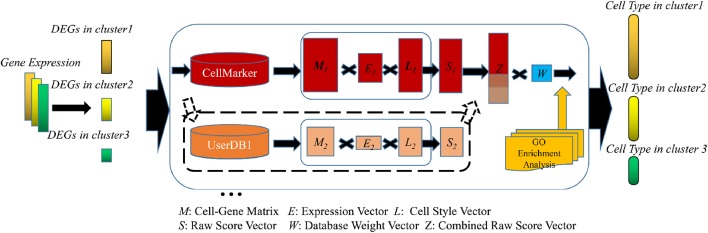
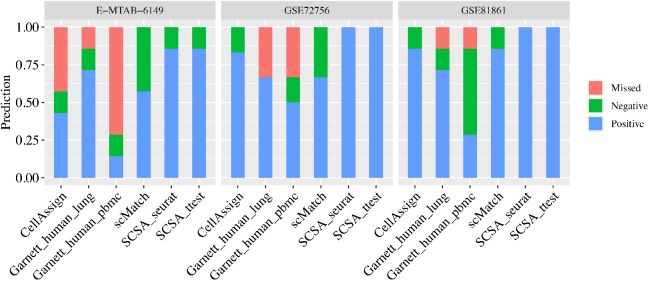
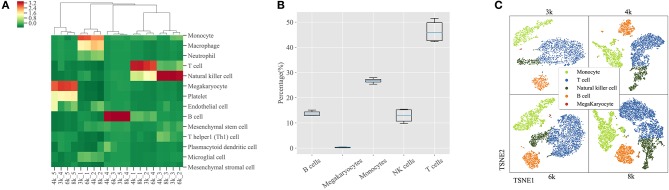
Currently most methods take manual strategies to annotate cell types after clustering the single-cell RNA sequencing (scRNA-seq) data. Such methods are labor-intensive and heavily rely on user expertise, which may lead to inconsistent results. We present SCSA, an automatic tool to annotate cell types from scRNA-seq data, based on a score annotation model combining differentially expressed genes (DEGs) and confidence levels of cell markers from both known and user-defined information. Evaluation on real scRNA-seq datasets from different sources with other methods shows that SCSA is able to assign the cells into the correct types at a fully automated mode with a desirable precision.

Keywords: CellMarker database; cell type annotation; differentially expressed genes; score annotation model; single-cell RNA sequencing.


Figures

Figure 1
Figure 1
Flowchart of the SCSA. First, DEGs of each cluster will be extracted and filtered from gene expression file. Next, SCSA employs marker gene databases to annotate cell clusters. In this step, both known marker gene database and user-defined marker database could be used simultaneously. For each cluster each database, a cell-gene matrix (M) with two vectors (E, L) will be generated to form a raw score vector (S). If multiple databases were selected, vectors would be normalized and combined together to make a new vector (Z), then multiplied with a database weight matrix (W) to make the last uniform vector. In the last step, ranked cell type vector will be generated according to the uniform score. In addition, SCSA employs GO enrichment analysis to give users some clue for unidentified clusters.
Figure 2
Figure 2
Performance of SCSA in comparison with other methods (scMatch, CellAssign, and Garnett) based on three known cell type datasets. Dataset identity was labeled on top of the panel with cluster numbers in brackets. For legends, “Positive” meant percentage of correctly predicted clusters, while “Negative” meant incorrectly predicted clusters and “Missed” meant predictions with uncertain cell types.
Figure 3
Figure 3
Cell components of PBMCs predicted by SCSA. (A) Clustering of uniform scores of the top five predicted cell types in four PBMCs datasets by SCSA. Each column stands for one cluster of four PBMCs datasets and each row stands for one cell type. Uniform scores were normalized using the z-score method to make clusters comparable. (B) Percentages of four different cell types in four PBMCs datasets based on SCSA's prediction. (C) Five cell types plotted by t-SNE based on the prediction of SCSA for four PBMCs datasets.

References

    1. Aran D., Looney A. P., Liu L., Wu E., Fong V., Hsu A., et al. (2019). Reference-based analysis of lung single-cell sequencing reveals a transitional profibrotic macrophage. Nat. Immunol. 20, 163–172. 10.1038/s41590-018-0276-y - DOI - PMC - PubMed
    1. Bacher R., Kendziorski C. (2016). Design and computational analysis of single-cell RNA-sequencing experiments. Genome Biol. 17:63. 10.1186/s13059-016-0927-y - DOI - PMC - PubMed
    1. Benjamini Y., Hochberg Y. (1995). Controlling the false discovery rate - a practical and powerful approach to multiple testing. J. R. Statist. Soc. Series B-Statist. Methodol. 57, 289–300. 10.1111/j.2517-6161.1995.tb02031.x - DOI
    1. Brohem C. A., de Carvalho C. M., Radoski C. L., Santi F. C., Baptista M. C., Swinka B. B., et al. (2013). Comparison between fibroblasts and mesenchymal stem cells derived from dermal and adipose tissue. Int. J. Cosmet. Sci. 35, 448–457. 10.1111/ics.12064 - DOI - PubMed
    1. Brown S. D., Wurst W., Kuhn R., Hancock J. M. (2009). The functional annotation of mammalian genomes: the challenge of phenotyping. Annu. Rev. Genet. 43, 305–333. 10.1146/annurev-genet-102108-134143 - DOI - PubMed

LinkOut - more resources