

Special Report: The Biology of Inequalities in Health: The Lifepath Consortium
- PMID: 32478023
- PMCID: PMC7235337
- DOI: 10.3389/fpubh.2020.00118
Special Report: The Biology of Inequalities in Health: The Lifepath Consortium
Abstract
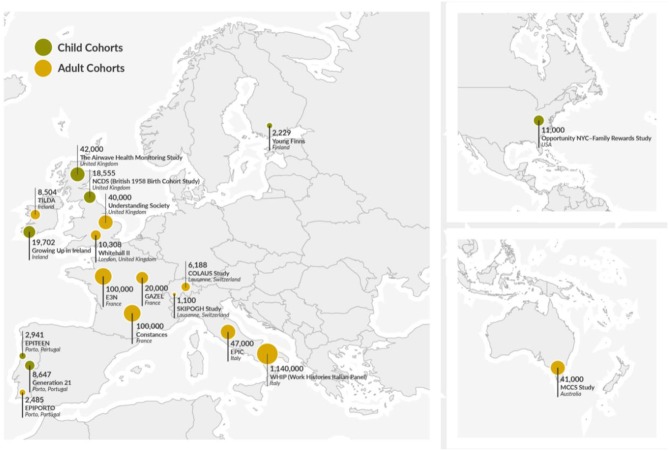
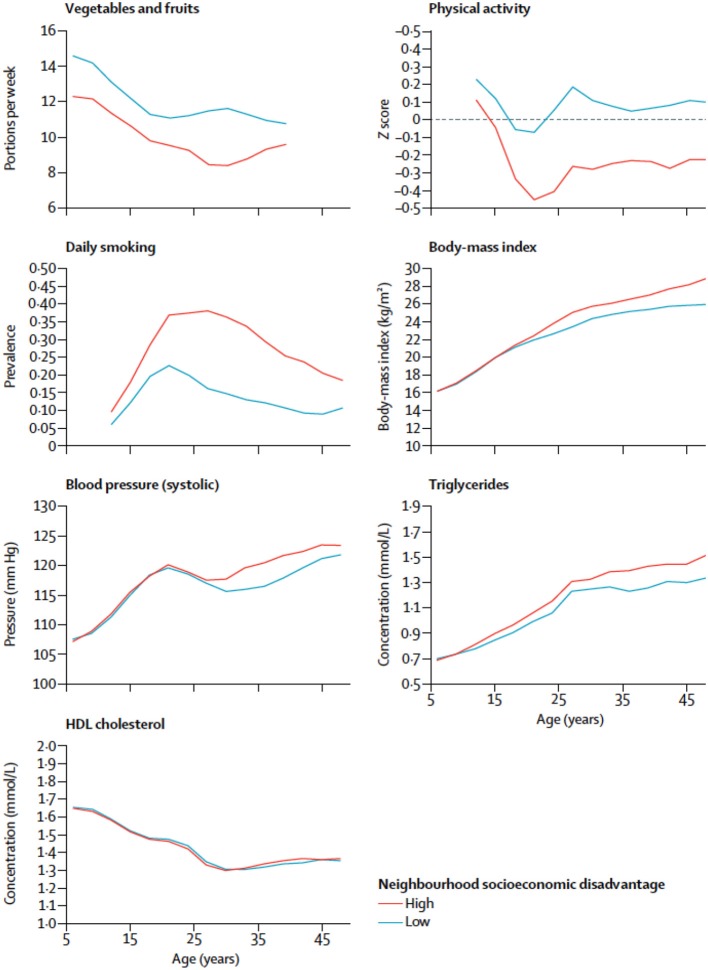
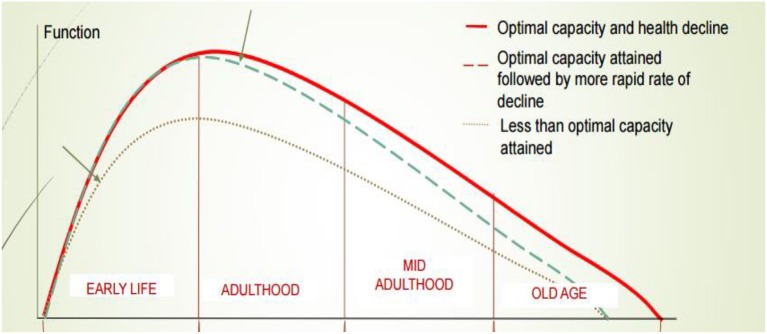
Funded by the European Commission Horizon 2020 programme, the Lifepath research consortium aimed to investigate the effects of socioeconomic inequalities on the biology of healthy aging. The main research questions included the impact of inequalities on health, the role of behavioral and other risk factors, the underlying biological mechanisms, the efficacy of selected policies, and the general implications of our findings for theories and policies. The project adopted a life-course and comparative approach, considering lifetime effects from childhood and adulthood, and pooled data on up to 1.7 million participants of longitudinal cohort studies from Europe, USA, and Australia. These data showed that socioeconomic circumstances predicted mortality and functional decline as strongly as established risk factors currently targeted by global prevention programmes. Analyses also looked at socioeconomically patterned biological markers, allostatic load, and DNA methylation using richly phenotyped cohorts, unraveling their association with aging processes across the life-course. Lifepath studies suggest that socioeconomic circumstances are embedded in our biology from the outset-i.e., disadvantage influences biological systems from molecules to organs. Our findings have important implications for policy, suggesting that (a) intervening on unfavorable socioeconomic conditions is complementary and as important as targeting well-known risk factors, such as tobacco and alcohol consumption, low fruit and vegetable intake, obesity and a sedentary lifestyle, and that (b) effects of preventive interventions in early life integrate interventions in adulthood. The report has an executive summary that refers to the different sections of the main paper.
Keywords: biology; healthy aging; life-course; omics; social inequalities; socioeconomic position.
Copyright © 2020 Vineis, Avendano-Pabon, Barros, Bartley, Carmeli, Carra, Chadeau-Hyam, Costa, Delpierre, D'Errico, Fraga, Giles, Goldberg, Kelly-Irving, Kivimaki, Lepage, Lang, Layte, MacGuire, Mackenbach, Marmot, McCrory, Milne, Muennig, Nusselder, Petrovic, Polidoro, Ricceri, Robinson, Stringhini and Zins.
Figures
Comment in
-
Commentary: Special Report: The Biology of Inequalities in Health: The Lifepath Consortium.Front Public Health. 2020 Oct 29;8:504530. doi: 10.3389/fpubh.2020.504530. eCollection 2020. Front Public Health. 2020. PMID: 33194935 Free PMC article. No abstract available.
References
-
- Marmot M, Allen J, Goldblatt P, Boyce T, McNeish D, Grady M, et al. Fair Society, Healthy Lives: the Marmot Review (Strategic review of health inequalities in England post-2010). London: Institute of Health Equity; (2010). Available online at: http://www.parliament.uk/documents/fair-society-healthy-lives-full-repor....
-
- Vineis P, Avendano-Pabon M, Barros H, Chadeau-Hyam M, Costa G, Dijmarescu M, et al. The biology of inequalities in health: the LIFEPATH project. Longitud Life Course Stud. (2017) 8:417–39. 10.14301/llcs.v8i4.448 - DOI
-
- WHO Global Action Plan for the Prevention and Control of Noncommunicable Diseases 2013–2020. Geneva: World Health Organization; (2013).