

Osteocyte lacunar strain determination using multiscale finite element analysis
- PMID: 32478144
- PMCID: PMC7251370
- DOI: 10.1016/j.bonr.2020.100277
Osteocyte lacunar strain determination using multiscale finite element analysis
Erratum in
-
Erratum regarding missing Declaration of competing interest statements in previously published articles.Bone Rep. 2021 Apr 29;14:101084. doi: 10.1016/j.bonr.2021.101084. eCollection 2021 Jun. Bone Rep. 2021. PMID: 34150955 Free PMC article.
Abstract
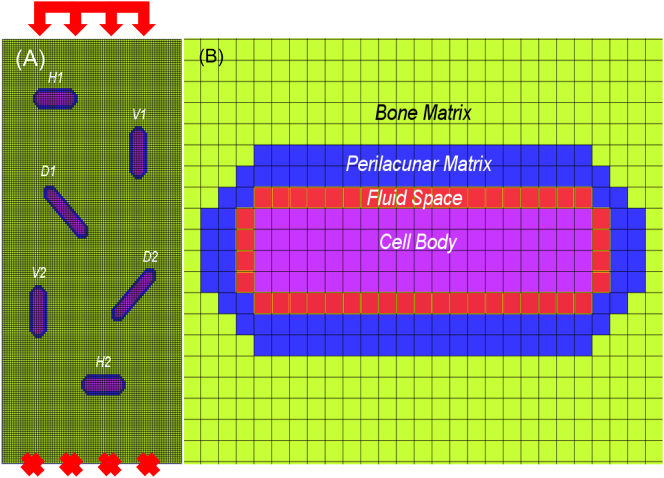
Osteocytes are thought to be the primary mechanosensory cells within bone, regulating both osteoclasts and osteoblasts to control load induced changes in bone resorption and formation. Osteocytes initiate intracellular responses including activating the Wnt/β-catenin signaling pathway after experiencing mechanical forces. In response to changing mechanical loads (strain) the osteocytes signal to cells on the bone surface. However, this process of osteocyte activation appears heterogeneous since it occurs in sub-populations of osteocytes, even within regions predicted to be experiencing similar global strain magnitudes determined based on traditional finite element modeling approaches. Several studies have investigated the strain responses of osteocyte lacunae using finite element (FE) models, but many were limited by the use of idealized geometries (e.g., ellipsoids) and analysis of a single osteocyte. Finite element models by other groups included more details, such as canaliculi, but all were done on models consisting of a single osteocyte. We hypothesized that variation in size and orientation of the osteocyte lacunae within bone would give rise to micro heterogeneity in the strain fields that could better explain the observed patterns of osteocyte activation following load. The osteocytes in our microscale and nanoscale models have an idealized oval shape and some are based on confocal scans. However, all the FE models in this preliminary study consist of multiple osteocytes. The number of osteocytes in the 3D confocal scan models ranged from five to seventeen. In this study, a multi-scale computational approach was used to first create an osteocyte FE model at the microscale level to examine both the theoretical lacunar and perilacunar strain responses based on two parameters: 1) lacunar orientation and 2) lacunar size. A parametric analysis was performed by steadily increasing the perilacunar modulus (5, 10, 15, and 20 GPa). Secondly, a nanoscale FE model was built using known osteocyte dimensions to determine the predicted strains in the perilacunar matrix, fluid space, and cell body regions. Finally, 3-D lacunar models were created using confocal image stacks from mouse femurs to determine the theoretical strain in the lacunae represented by realistic geometries. Overall, lacunar strains decreased by 14% in the cell body, 15% in the fluid space region and 25% in the perilacunar space as the perilacunar modulus increased, indicating a stress shielding effect. Lacunar strains were lower for the osteocytes aligned along the loading axis compared to those aligned perpendicular to axis. Increases in lacuna size also led to increased lacunar strains. These finite element model findings suggest that orientation and lacunar size may contribute to the heterogeneous initial pattern of osteocyte strain response observed in bone following in vivo applied mechanical loads. A better understanding of how mechanical stimuli directly affect the lacunae and perilacunar tissue strains may ultimately lead to a better understanding of the process of osteocyte activation in response to mechanical loading.
Keywords: Finite element model; Lacunae; Osteocyte; Perilacunar matrix; Strain.
© 2020 The Authors.
Figures


References
-
- Bacabac R.G., Mizuno D., Schmidt C.F., MacKintosh F.C., Van Loon J.J., Klein-Nulend J., Smit T.H. Round versus flat: bone cell morphology, elasticity, and mechanosensing. J. Biomech. 2008;41:1590–1598. - PubMed
-
- Black D.M., Rosen C.J. Postmenopausal osteoporosis. N. Engl. J. Med. 2016;374:254–262. - PubMed
-
- Bolte S., Cordelieres F. A guided tour into subcellular colocalization analysis in light microscopy. J. Microsc. 2006;224:213–232. - PubMed
Grants and funding
LinkOut - more resources
Full Text Sources
