. 2020 Apr 29;5(5):463-480.
doi: 10.1016/j.jacbts.2020.02.007. eCollection 2020 May.

Changes in Myocardial Microstructure and Mechanics With Progressive Left Ventricular Pressure Overload

Affiliations

Changes in Myocardial Microstructure and Mechanics With Progressive Left Ventricular Pressure Overload

William M Torres et al. JACC Basic Transl Sci. .

Abstract

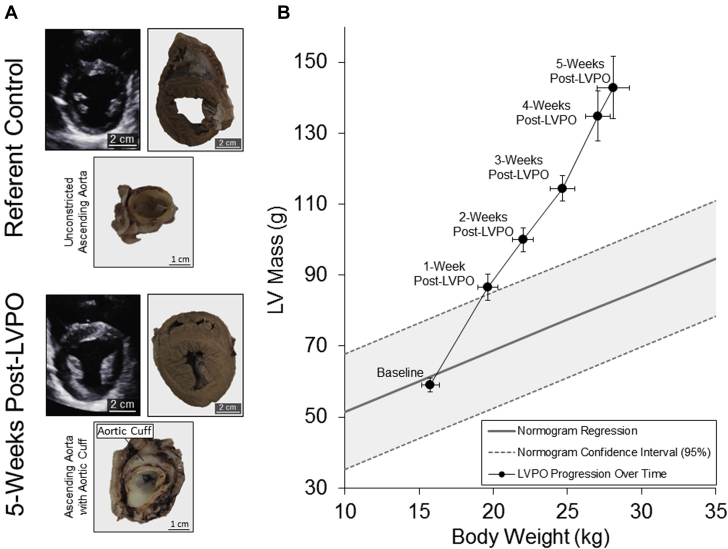
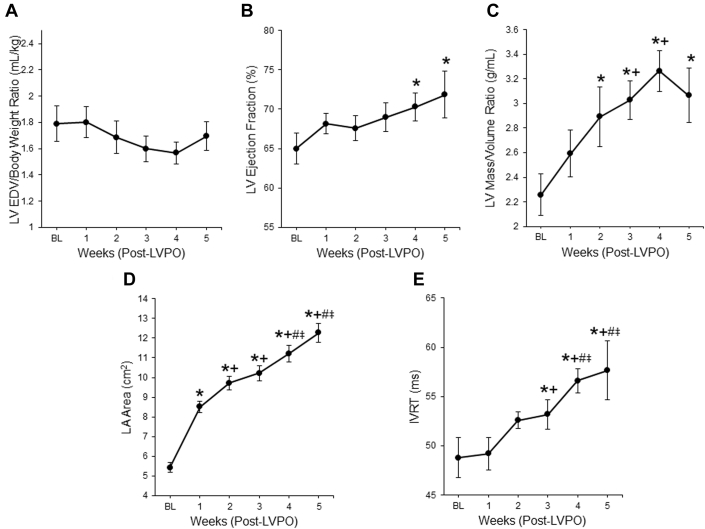
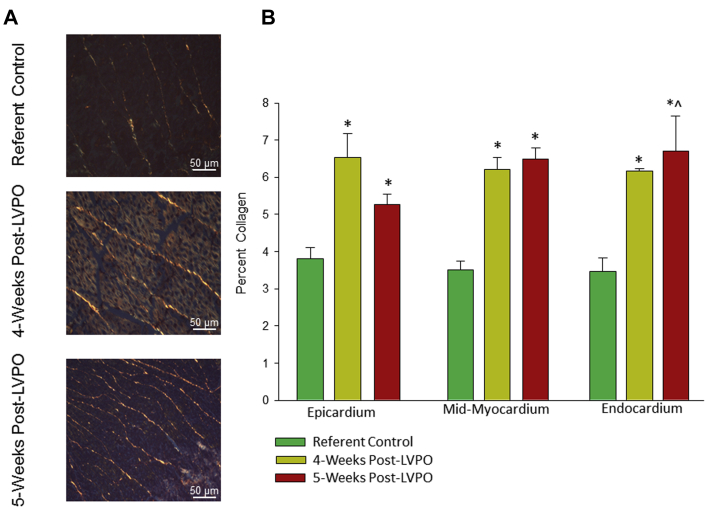
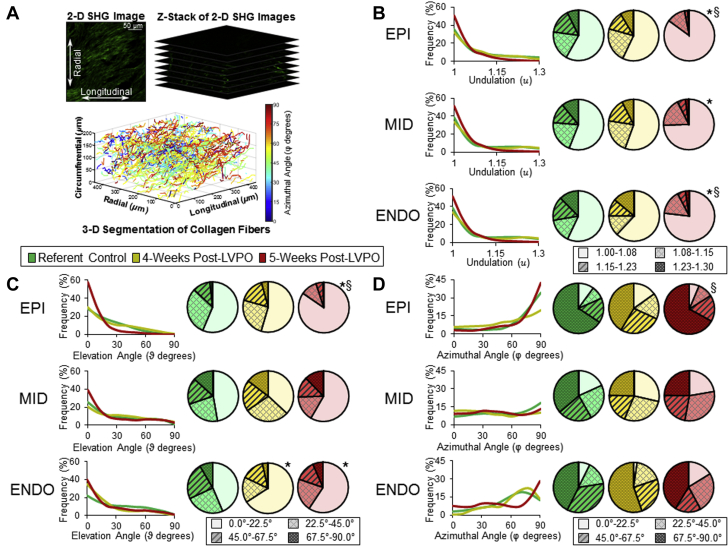
This study assessed the regional changes in myocardial geometry, microstructure, mechanical behavior, and properties that occur in response to progressive left ventricular pressure overload (LVPO) in a large animal model. Using an index of local biomechanical function at early onset of LVPO allowed for prediction of the magnitude of left ventricular chamber stiffness (Kc) and left atrial area at LVPO late timepoints. Our study found that LV myocardial collagen content alone was insufficient to identify mechanisms for LV myocardial stiffness with progression to heart failure with preserved ejection fraction (HFpEF). Serial assessment of regional biomechanical function might hold value in monitoring the natural history and progression of HFpEF, which would allow evaluation of novel therapeutic approaches.

Keywords: Ct, cycle time; EDV, end-diastolic volume; EF, ejection fraction; ESV, end-systolic volume; HF, heart failure; HFpEF, heart failure with preserved ejection fraction; HFrEF, heart failure with reduced ejection fraction; IVRT, isovolumic relaxation time; LA, left atrial; LV, left ventricular; LVPO, left ventricular pressure overload; NT-proBNP, N-terminal pro-brain natriuretic peptide; PCR, polymerase chain reaction; PRSW, pre-load recruitable stroke work; SHG, second harmonic generation; STE, speckle tracking echocardiography; echocardiography; heart failure; pressure overload; qPCR, quantitative real-time PCR.


Figures

None
Graphical abstract
Figure 1
Figure 1
LVPO-Induced LV Hypertrophy (A) Representative transthoracic echocardiographic views of the left ventricular (LV) short-axis at the level of the papillary muscle, along with preserved bisections of the intact ventricles and ascending aorta. A clear and obvious thickening of the LV wall occurred as a result of LV pressure overload (LVPO). The aortic cuff significantly reduced the cross-sectional area of the aortic lumen. (B) LV mass relative to body weight obtained at baseline and during 5 weeks post-LVPO superimposed on a normogram of this relation developed from previous studies. The observed increase in LV mass relative to body weight indicates an LVPO-induced hypertrophic response. (baseline – 4 weeks post-LVPO: n = 14; 5 weeks post-LVPO: n = 7)
Figure 2
Figure 2
Echocardiographic Indices Baseline values of (A) LV end-diastolic volume (LVEDV)/body weight ratio and (B) LV ejection fraction were largely maintained during 5 weeks post-LVPO, whereas (C) LV mass/volume ratio, (D) left atrial (LA) area, and (E) isovolumic relaxation time (IVRT) progressively increased. ∗p < 0.05 versus baseline value; +p < 0.05 versus 1-week value; #p < 0.05 versus 2-week value; ‡p < 0.05 versus 3-week value. (baseline – 4 weeks post-LVPO: n = 14; 5 weeks post-LVPO: n = 7). Abbreviations as in Figure 1.
Figure 3
Figure 3
LV Myocardial Mechanical Response and Mechanical Properties (A) Peak LV myocardial strain and (B) diastolic strain rate underwent similar changes in the epicardium, mid-myocardium, and endocardium during 5 weeks post-LVPO. (C) The mean diastolic LV myocardial stiffness (average of obtained regional stiffness values) progressively increased during 5 weeks post-LVPO in both the circumferential and longitudinal directions. ∗p < 0.05 versus baseline value; +p < 0.05 versus 1-week value; #p < 0.05 versus 2-week value. (baseline – 4 weeks post-LVPO: n = 14; 5 weeks post-LVPO: n = 7). Abbreviations as in Figure 1.
Figure 4
Figure 4
Evaluation of LV Chamber Stiffness (A) Representative pressure-volume relations developed from invasive LV pressure measurements. (B) Generated pressure-volume loops from a subset of referent control (n = 6), 4 weeks post-LVPO (n = 4), and 5 weeks post-LVPO (n = 4) pigs were used to derive LV chamber stiffness (Kc), which exhibits significant and late (4 weeks post-LVPO vs. 5 weeks post-LVPO) increases with LVPO. (C) A noninvasive surrogate (KC) was used for serial assessment of LV chamber stiffness, demonstrating a similar late elevation (4 weeks post-LVPO vs. 5 weeks post-LVPO) as well as progressive LV chamber stiffening during 5 weeks post-LVPO. ∗p < 0.05 versus baseline value; +p < 0.05 versus 1-week value; #p < 0.05 versus 2-weeks value; ‡p < 0.05 versus 3-week value; §p < 0.05 versus 4 weeks value. (baseline – 4 weeks post-LVPO: n = 14; versus weeks post-LVPO: n = 7). Abbreviations as in Figure 1.
Figure 5
Figure 5
Quantification of LV Myocardial Collagen Content (A) Transmural sections of the LV myocardium were stained with picrosirius red and imaged at 40× magnification. These images from the mid-myocardium reflect the increased fibrillar collagen content that occurred with LVPO. (B) Percent collagen content was computed for samples corresponding to the endocardium, mid-myocardium, and epicardium for referent controls (n = 9), 4 weeks post-LVPO (n = 6), and 5 weeks post-LVPO (n = 7). ∗p < 0.05 versus referent control endocardium, mid-myocardium, and epicardium, ˆp < 0.05 versus 5-week epicardium. Abbreviations as in Figure 1.
Figure 6
Figure 6
Characterization of Collagen Fiber Structure and Orientation (A) Three-dimensional (3-D) stacks of 2-dimensional (2-D) images acquired from second harmonic generation (SHG)−enabled reconstruction of collagen fibers and subsequent representation as vectors in a Cartesian coordinate system for samples corresponding to referent controls (n = 5), 4 weeks post-LVPO (n = 6), and 5 weeks post-LVPO (n = 7). (B) Regional fiber undulation (u) distributions were computed for the epicardium (EPI), mid-myocardium (MID), and endocardium (ENDO) based on reconstructed fiber geometries. Two fiber-specific angles were computed to quantify fiber orientation. (C) The elevation angle, ϑ, was computed from the circumferential-longitudinal plane. An angle of ϑ = 0° indicates fiber alignment with the circumferential axis. (D) The azimuthal angle, φ, was computed from the longitudinal-radial plane. An angle of φ = 0º indicates fiber alignment with the radial axis. ∗p < 0.05 versus referent control value; §p < 0.05 versus 4-week value. Other abbreviation as in Figure 1.
Figure 7
Figure 7
Predicting LVPO-Induced Increase in LV Chamber Stiffness Based on Early Noninvasive Measurements (A) Region-matched changes in wall thickness (H) and circumferential diastolic myocardial stiffness (κMR) obtained at 1 week post-LVPO exhibited an inverse correlation among all post-LVPO animals (n = 14). (B) Predicted values for LVPO-induced changes in LV chamber stiffness relative to baseline (KC,pred.) were generated through multiple linear regression modeling. KC,pred. significantly correlated with experimental values, suggesting that noninvasive measurements obtained at 1 week post-LVPO can predict the severity of subsequent LV chamber stiffening. RV = right ventricular; other abbreviations as in Figure 1.
Figure 8
Figure 8
Biomechanical, Geometrical, Compositional, and Microstructural Correlations A Spearman’s rank correlation analysis was used to interrelate region-matched biomechanical response variables [peak strain, diastolic strain rate, and diastolic myocardial stiffness (κMR ) with geometrical (wall thickness), compositional (collagen content), and microstructural [collagen undulation (u)], and orientation (ϑ and φ) response variables. All correlations refer to data means at the terminal study timepoints; (4 weeks post-LVPO: n = 6; 5 weeks post-LVPO: n = 7). ∗p < 0.05 for Spearman’s rank correlation coefficient (ρ). Abbreviations as in Figures 1 and 6.

Comment in

References

    1. Benjamin E.J., Blaha M.J., Chiuve S.E. Heart disease and stroke statistics’2017 update: a report from the American Heart Association. Circulation. 2017;35:e146–e603. - PMC - PubMed
    1. Bursi F., Weston S.A., Redfield M.M. Systolic and diastolic heart failure in the community. JAMA. 2006;296:2209–2216. - PubMed
    1. Bronzwaer J.G.F., Paulus W.J. Diastolic and systolic heart failure: different stages or distinct phenotypes of the heart failure syndrome? Curr Heart Fail Rep. 2009;6:281–286. - PubMed
    1. Komajda M., Carson P.E., Hetzel S. Factors associated with outcome in heart failure with preserved ejection fraction: findings from the Irbesartan in Heart Failure with Preserved Ejection Fraction Study (I-PRESERVE) Circ Heart Fail. 2011;4:27–35. - PubMed
    1. Zile M.R., Gaasch W.H., Anand I.S. Mode of death in patients with heart failure and a preserved ejection fraction: results from the irbesartan in heart failure with preserved ejection fraction study (I-Preserve) Trial. Circulation. 2010;121:1393–1405. - PubMed