. 2020 May;2(5):413-431.
doi: 10.1038/s42255-020-0209-6. Epub 2020 May 21.

Resolution of NASH and hepatic fibrosis by the GLP-1R/GcgR dual-agonist Cotadutide via modulating mitochondrial function and lipogenesis

Affiliations

Resolution of NASH and hepatic fibrosis by the GLP-1R/GcgR dual-agonist Cotadutide via modulating mitochondrial function and lipogenesis

Michelle L Boland et al. Nat Metab. 2020 May.

Abstract

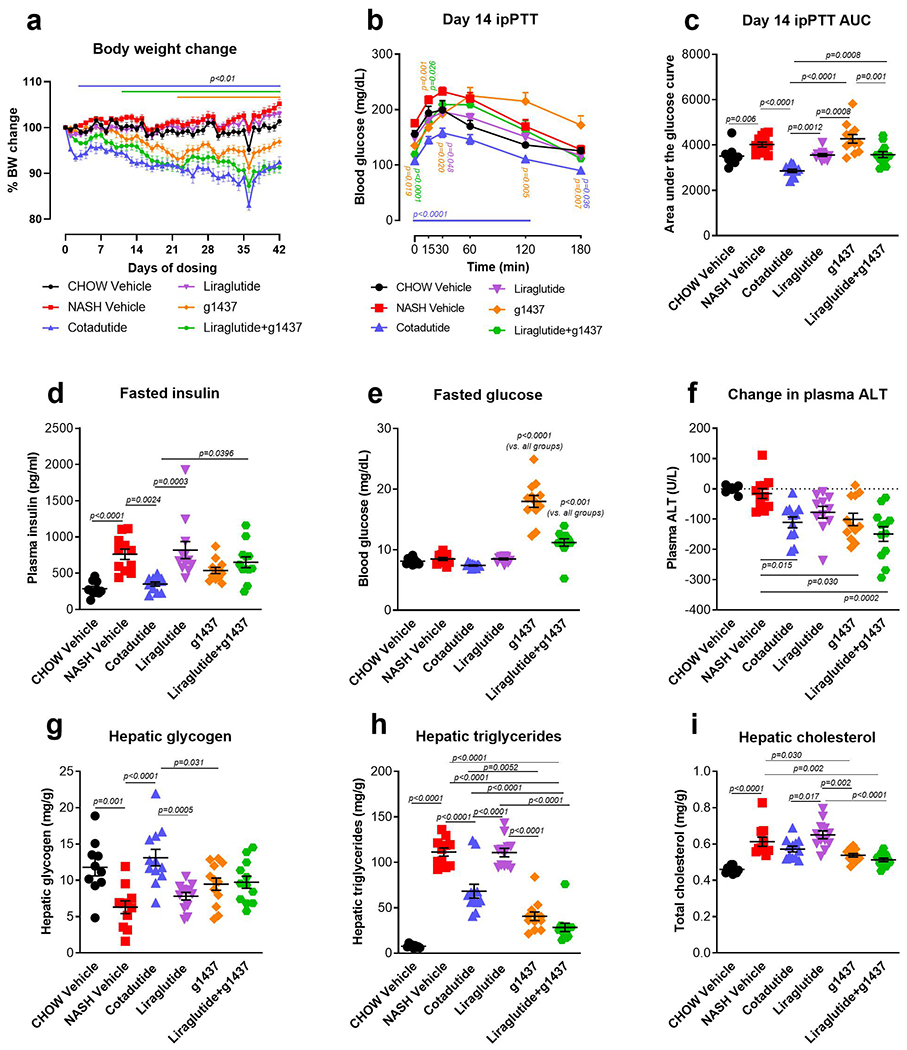
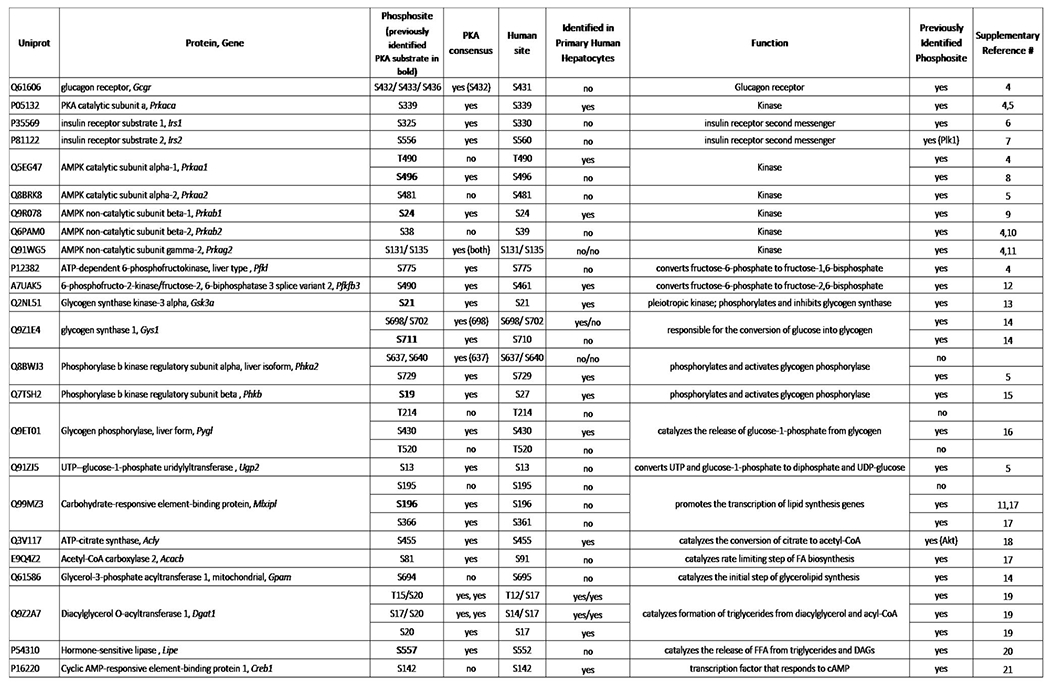
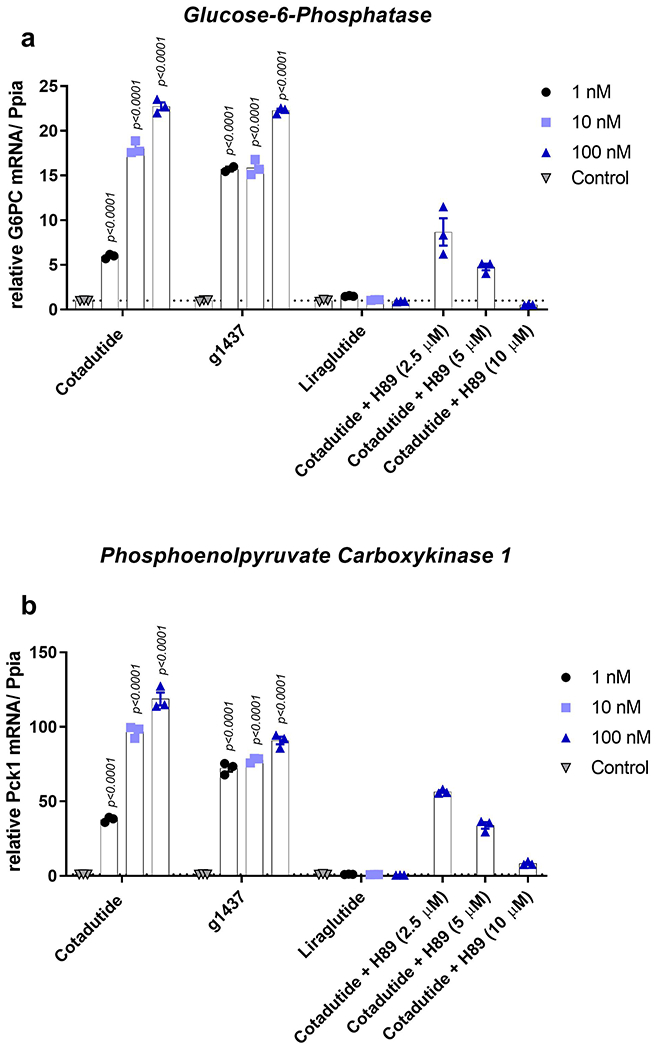
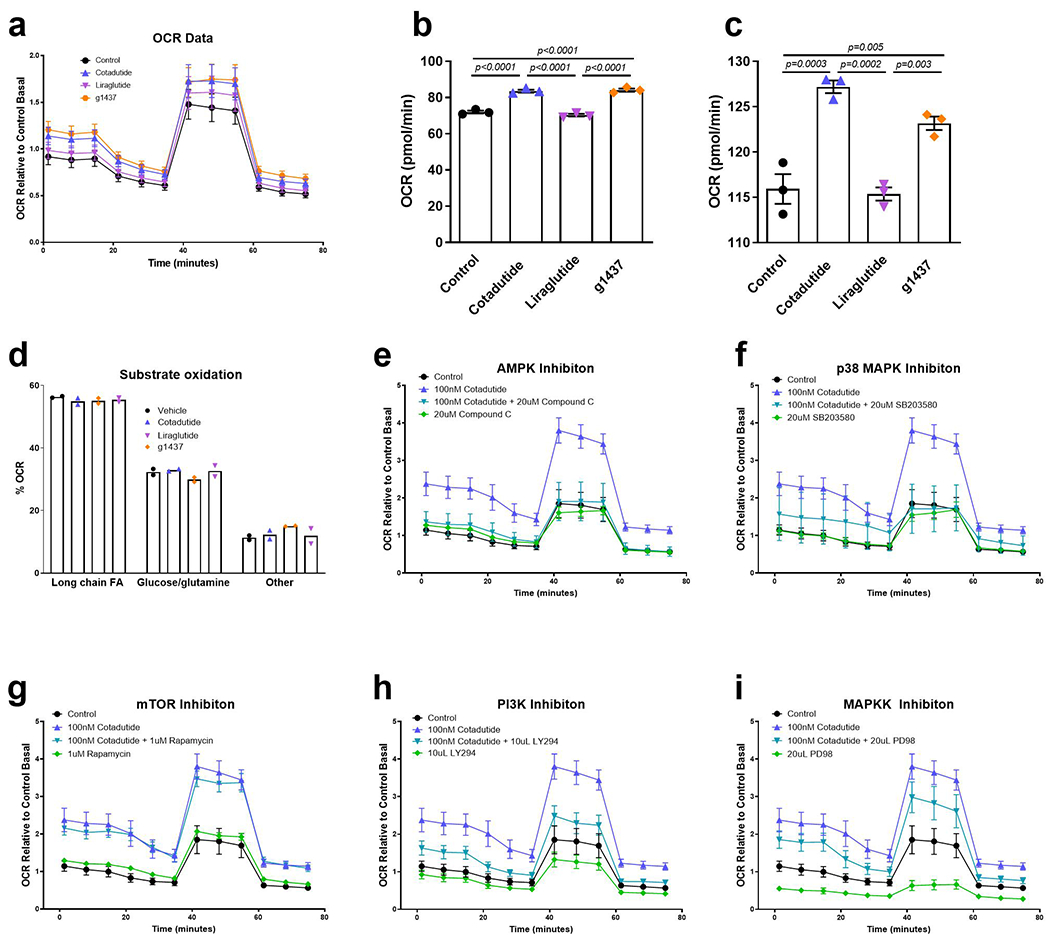
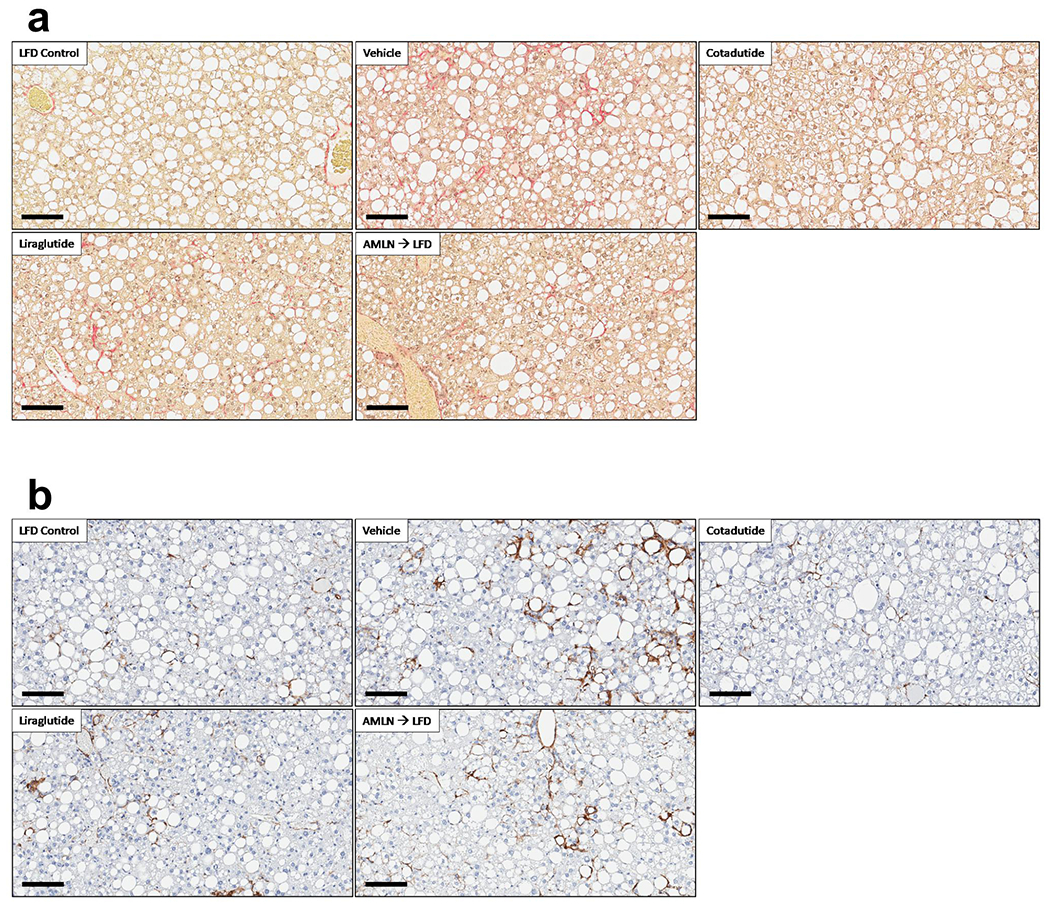
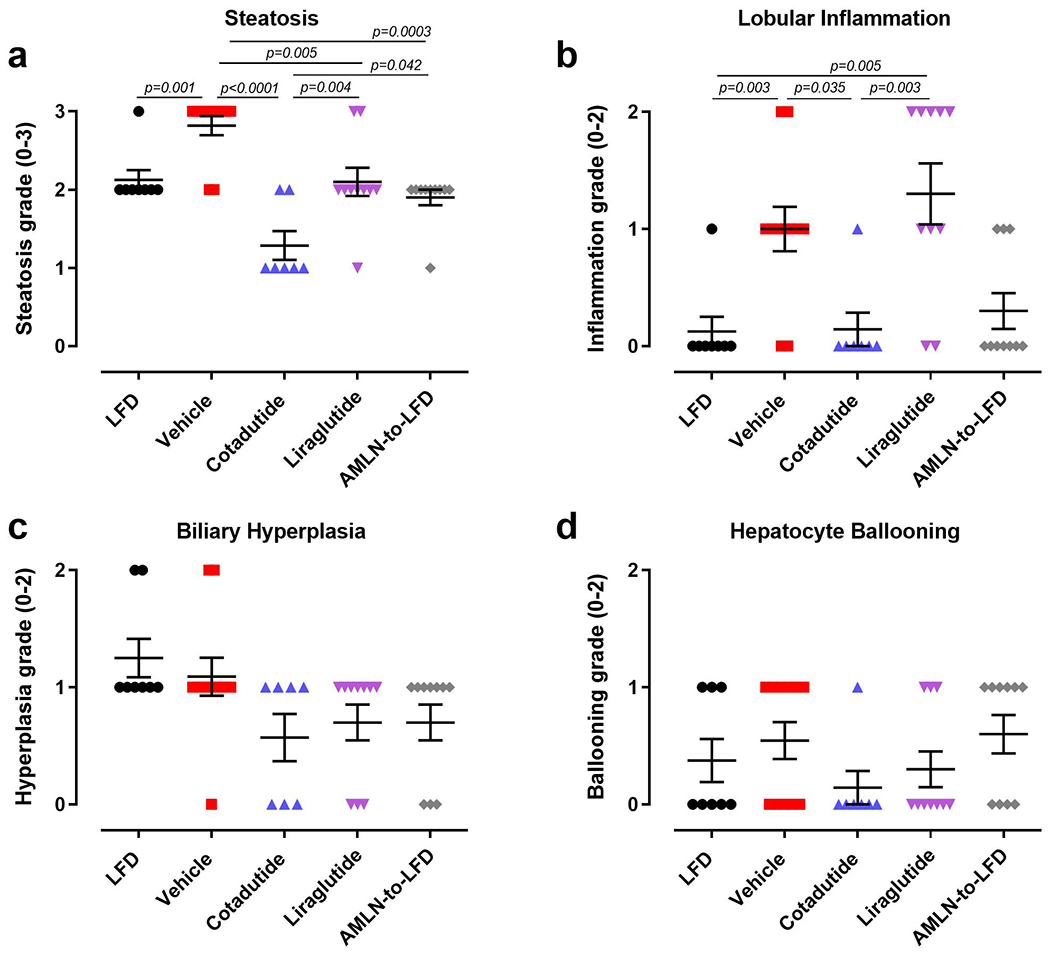
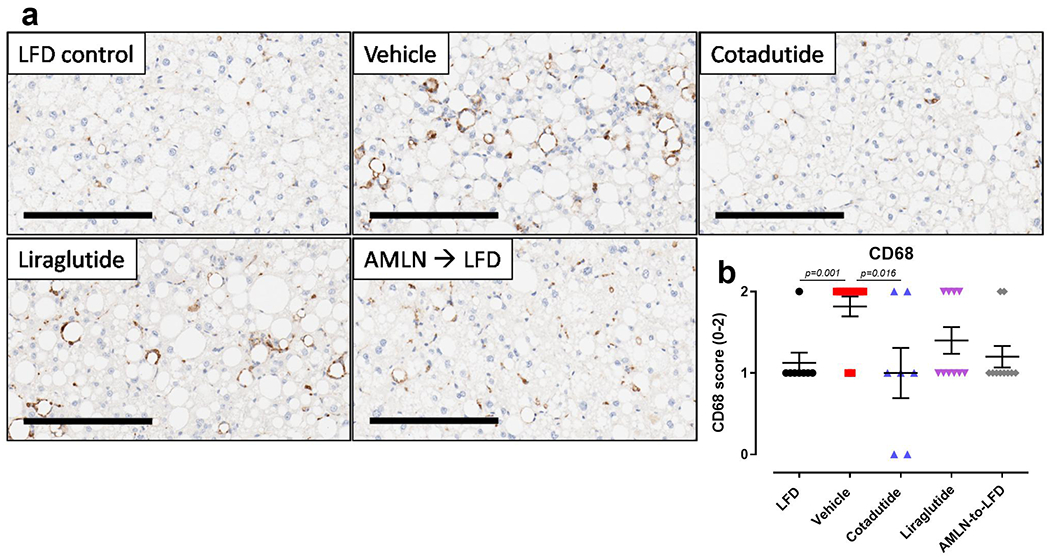
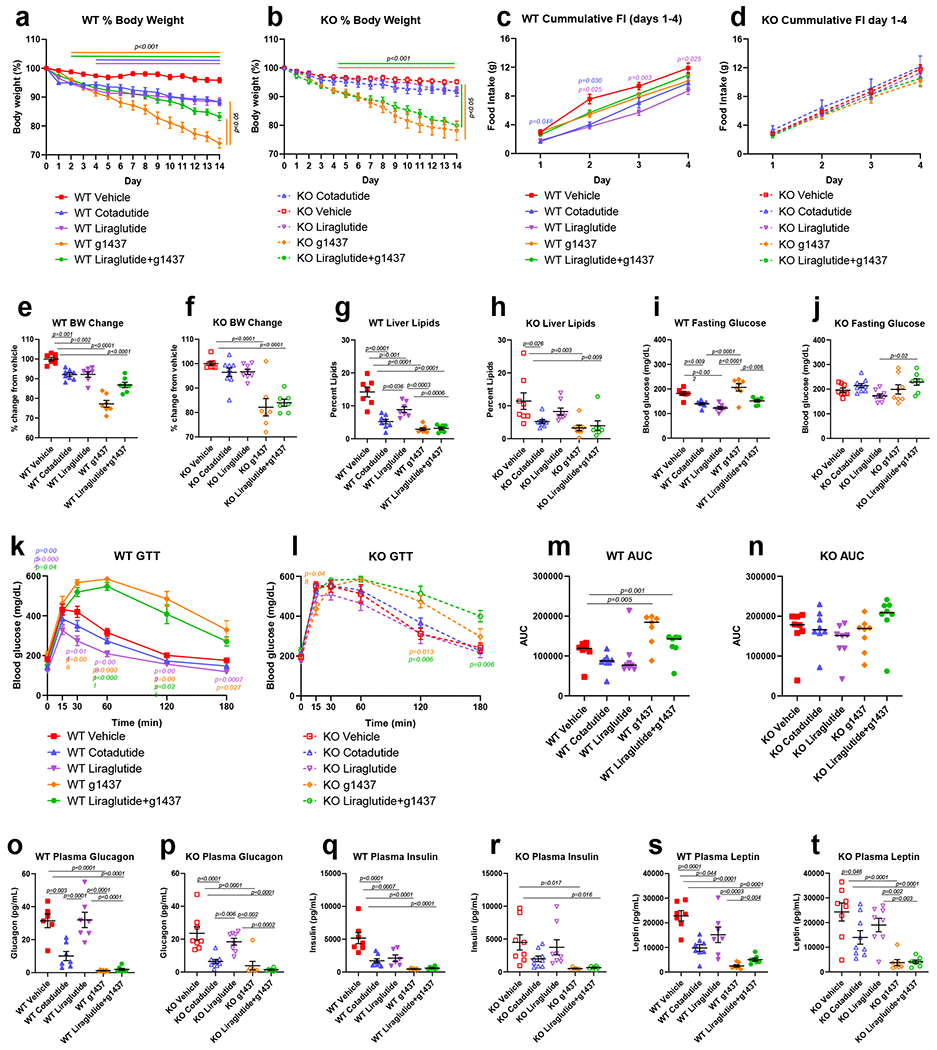
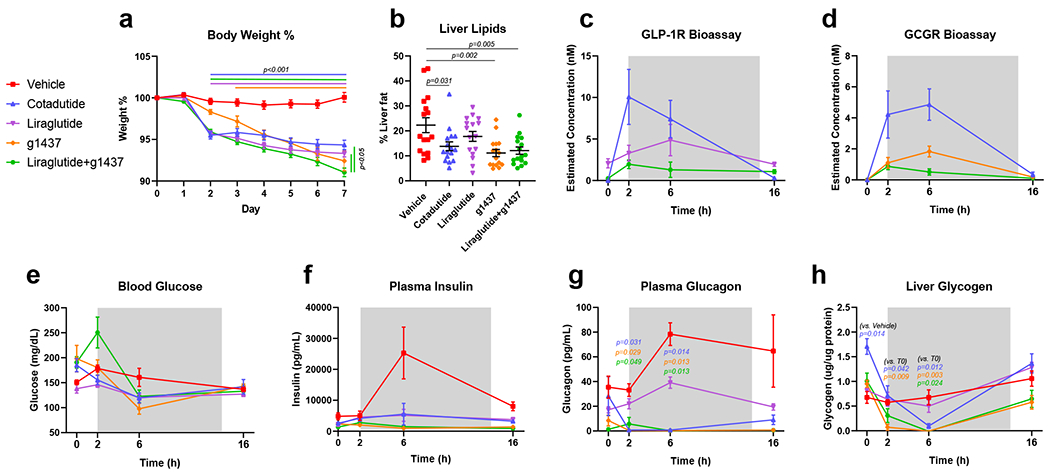
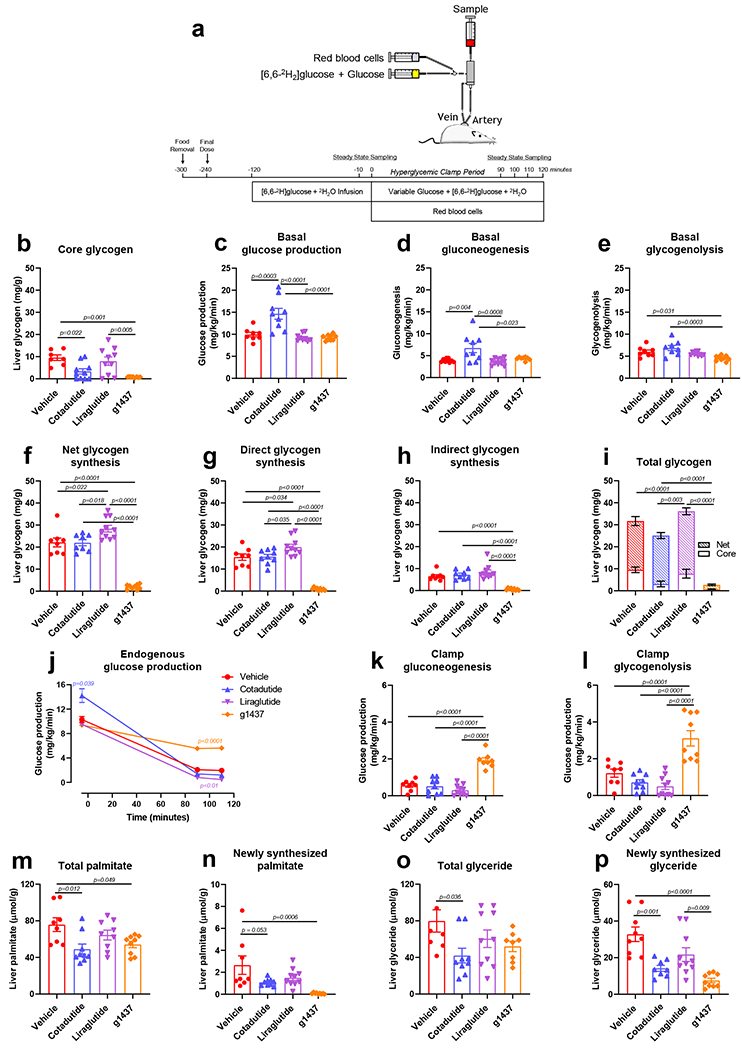
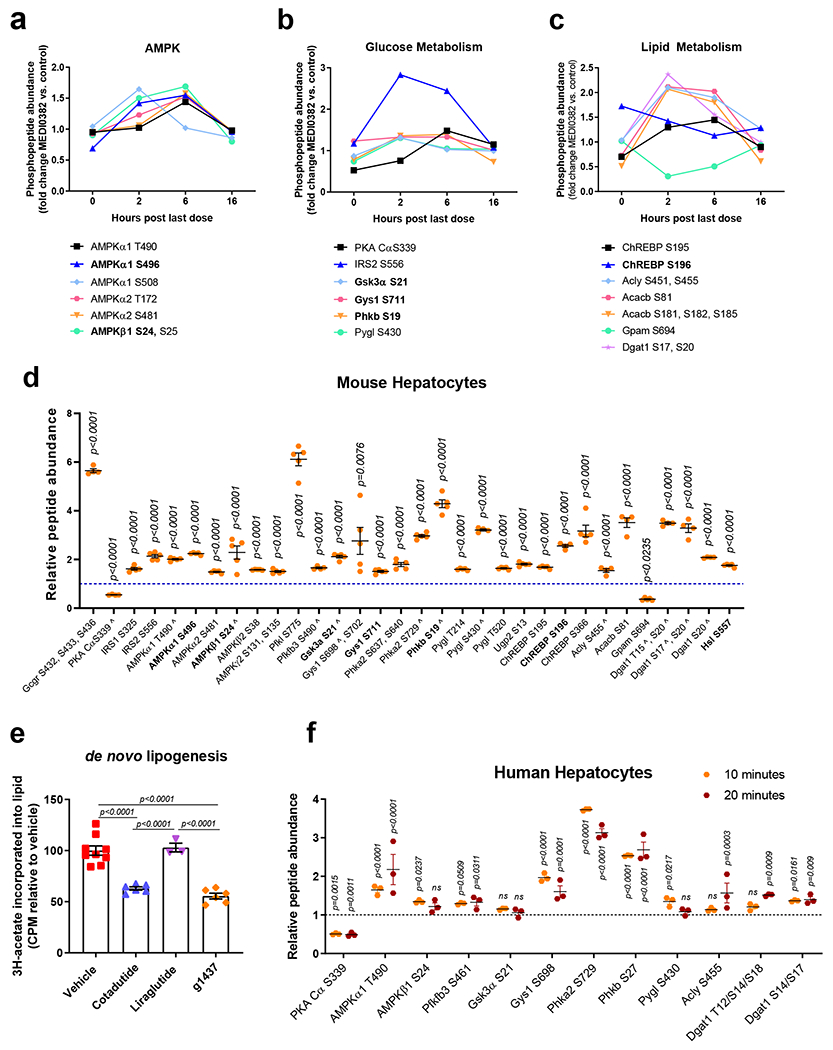
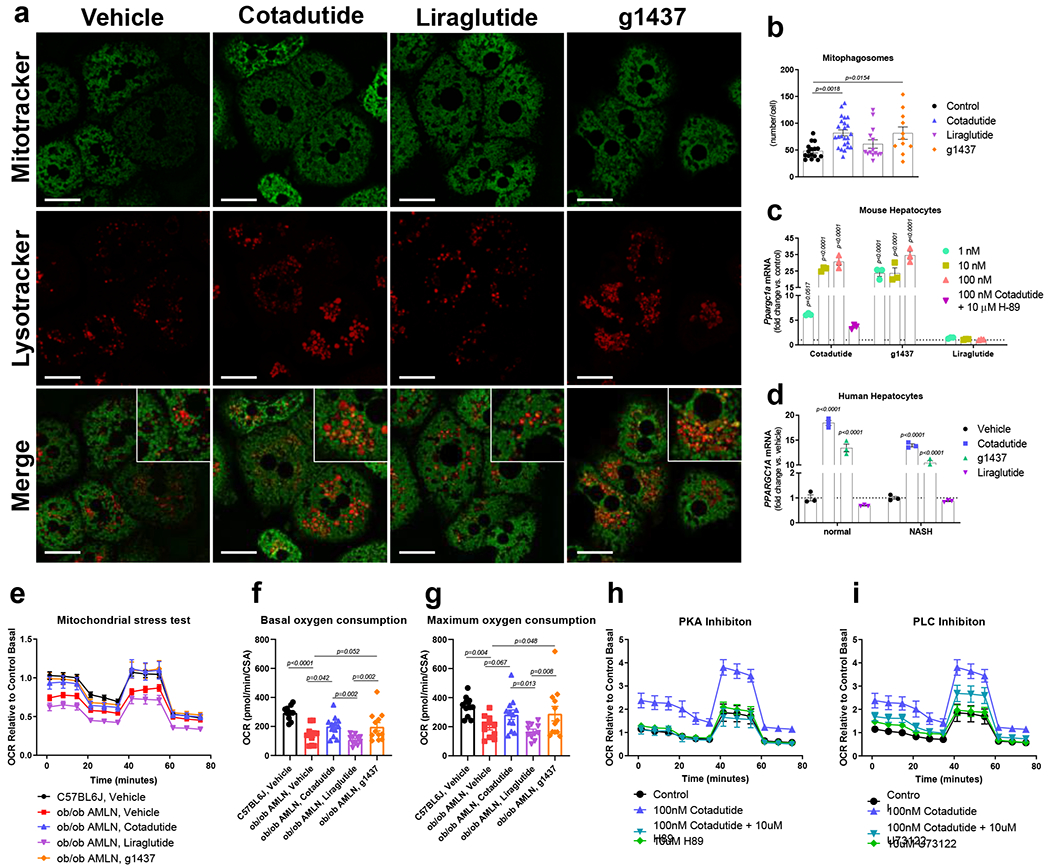
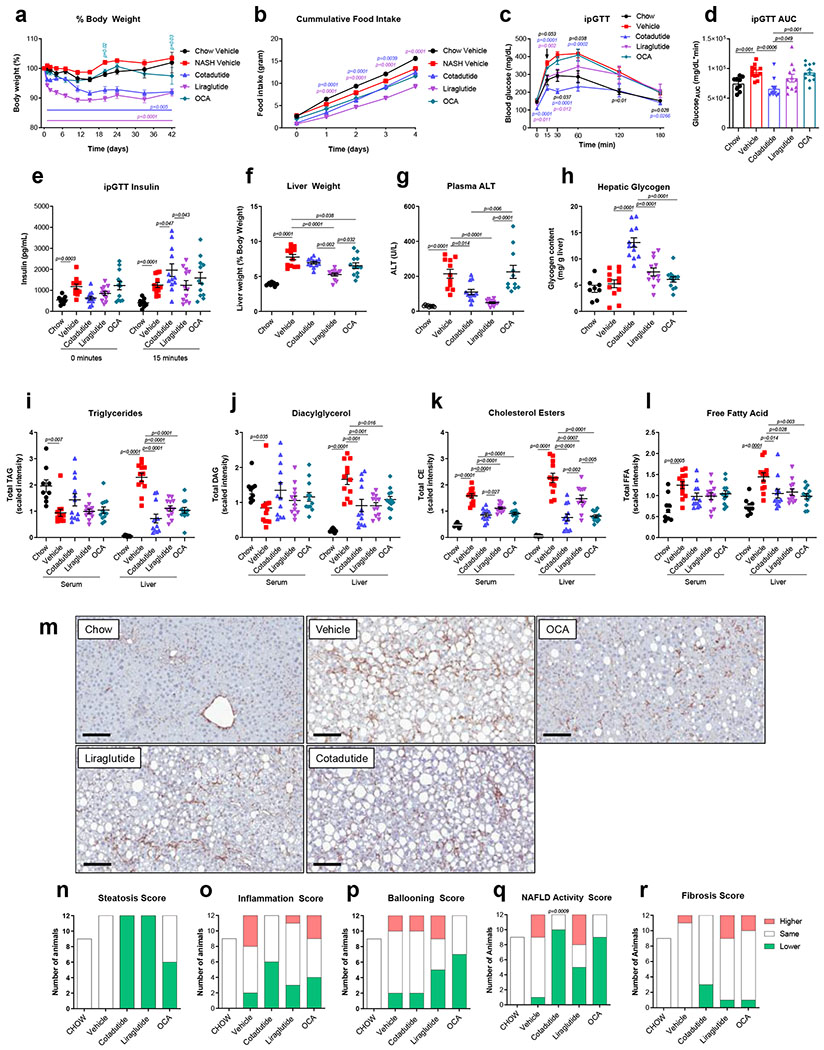
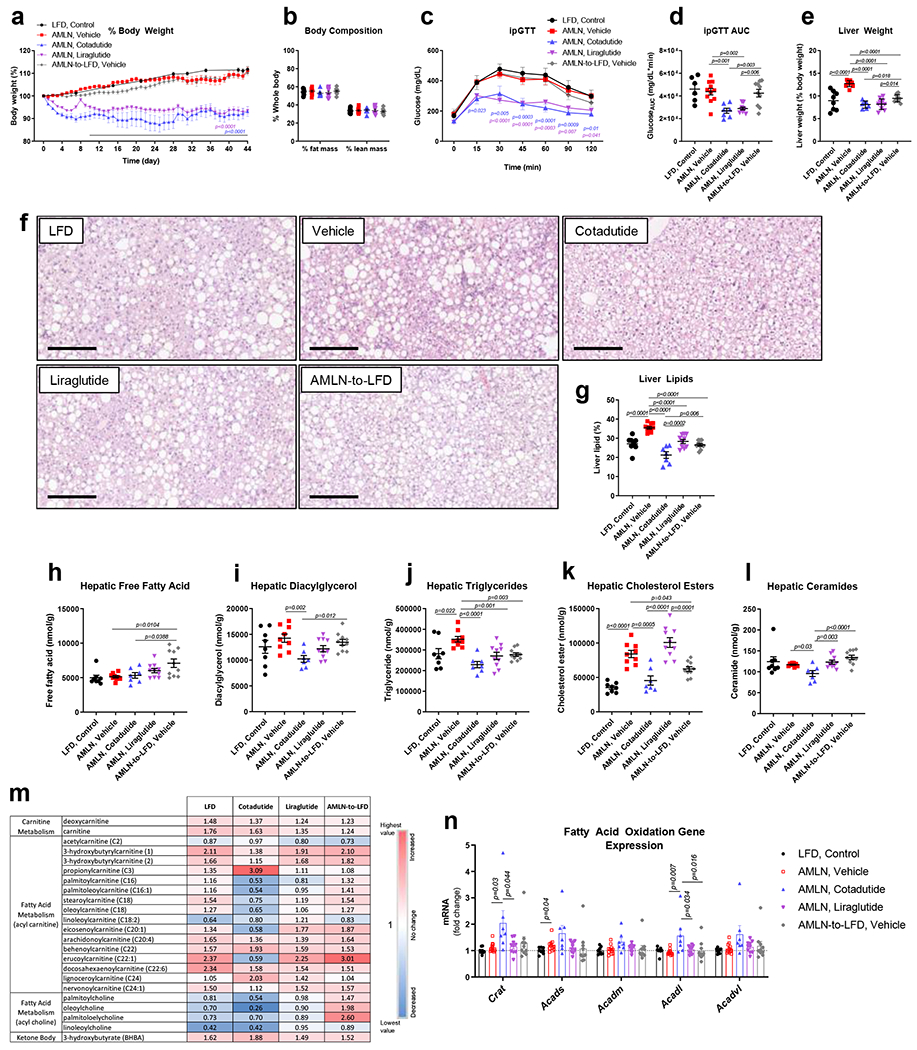
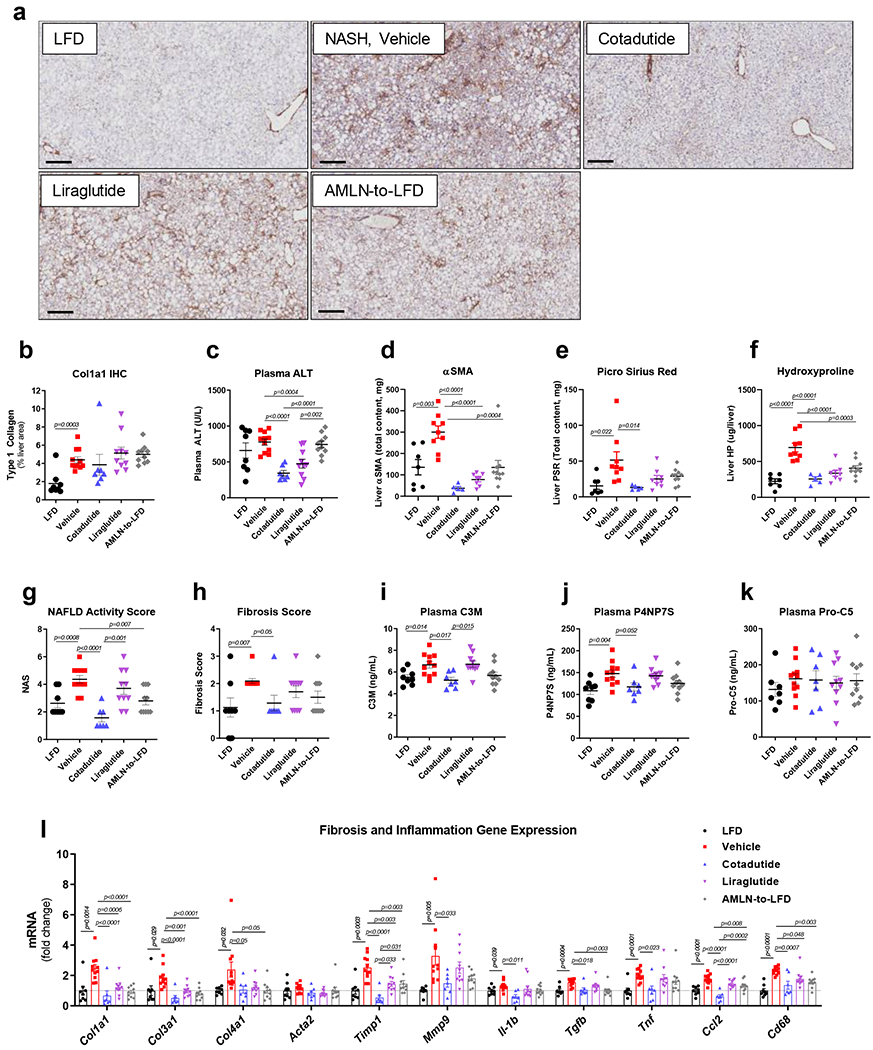
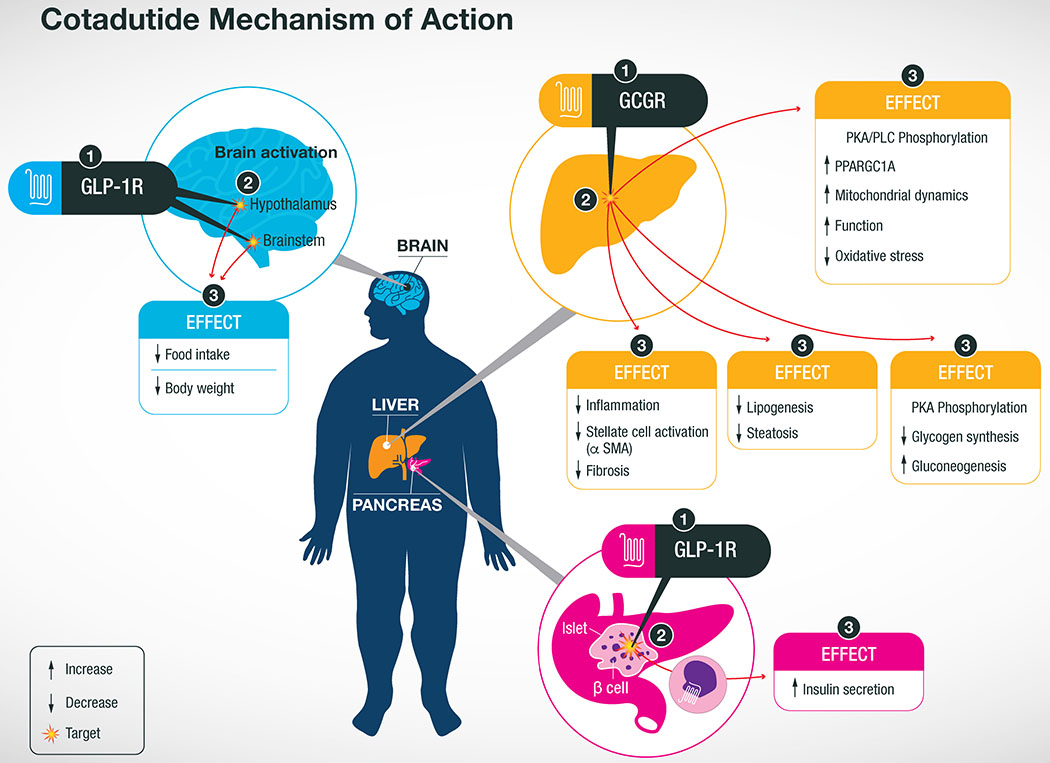
Non-alcoholic fatty liver disease and steatohepatitis are highly associated with obesity and type 2 diabetes mellitus. Cotadutide, a GLP-1R/GcgR agonist, was shown to reduce blood glycemia, body weight and hepatic steatosis in patients with T2DM. Here, we demonstrate that the effects of Cotadutide to reduce body weight, food intake and improve glucose control are predominantly mediated through the GLP-1 signaling, while, its action on the liver to reduce lipid content, drive glycogen flux and improve mitochondrial turnover and function are directly mediated through Gcg signaling. This was confirmed by the identification of phosphorylation sites on key lipogenic and glucose metabolism enzymes in liver of mice treated with Cotadutide. Complementary metabolomic and transcriptomic analyses implicated lipogenic, fibrotic and inflammatory pathways, which are consistent with a unique therapeutic contribution of GcgR agonism by Cotadutide in vivo. Significantly, Cotadutide also alleviated fibrosis to a greater extent than Liraglutide or Obeticholic acid (OCA), despite adjusting dose to achieve similar weight loss in 2 preclinical mouse models of NASH. Thus Cotadutide, via direct hepatic (GcgR) and extra-hepatic (GLP-1R) effects, exerts multi-factorial improvement in liver function and is a promising therapeutic option for the treatment of steatohepatitis.


Conflict of interest statement

COMPETING INTERESTS STATEMENT The authors declare competing interests as defined by Nature Research. Employee of AstraZeneca (R.C.L., K.M., S.O., J.C., J.N., J.G., L.J., C.J.R.). Owns stock in AstraZeneca (K.M., S.O., J.C., J.N., J.G., L.J., C.M.R., J.L.T., C.J.R.).

Figures

Extended Data Fig. 1
Extended Data Fig. 1. Metabolic and hepatic parameters following six-week treatment of NASH C57Bl6/J mice.
Mice were treated with Cotadutide, Liraglutide, g1437 or Liraglutide+g1437 at equimolar dosing (10 nmol/kg, SC, QD for 42 days) compared to vehicle. Animals were given ad libitum access to food for the entirety of the study except on day 14 mice were fasted for 6 h prior to ipPTT. (a) Reduction in body weight throughout the 42-day dosing period shown as % change. (b) Blood glucose profile during ipPTT (pyruvate given at dose of 2g/kg) and (c) area under the PTT curve. (d) Fasting plasma insulin, (e) fasting blood glucose and (f) plasma ALT levels at the end of the study. (g) Terminal liver glycogen content, (h) triglycerides and (i) cholesterol. Chow Vehicle (n=10); NASH Vehicle (n=11); Cotadutide (n=12); Liraglutide (n=12); g1437 (n=12); Liraglutide+g1437 (n=12). Data shown as the mean ± SEM. (a and b) Two-way ANOVA, Tukey’s multiple comparisons post-hoc test. In (a and b) colored lines and p-values indicated differences for the corresponding treatment group compared with NASH vehicle at each time point. (c-i) Two-sided student’s t-test for chow controls vs. NASH vehicle to determine effect of NASH diet; One-way ANOVA, Tukey’s multiple comparisons post-hoc test, chow group excluded.
Extended Data Fig. 2
Extended Data Fig. 2. Table of phosphopeptides.
Description of hepatic phosphopeptides detected in primary mouse and human hepatocytes following treatment with g1437.
Extended Data Fig. 3
Extended Data Fig. 3. Glucagon induced gene expression of G9Pase and Pck1 is PKA-dependent.
(a) G6Pase and (b) Pck1 mRNA levels in primary mouse hepatocytes treated with increasing concentrations (1, 10, and 100 nM) of Cotadutide, g1437 or Liraglutide for 4h. Cells were also treated with 100 nM Cotadutide plus increasing concentrations of H89 (2.5 μM, 5 μM and 10 μM). (n=3 biologically independent samples for each group and concentration). All data shown as the mean ± SEM. One-way ANOVA with Dunnett’s multiple comparisons post-hoc test.
Extended Data Fig. 4
Extended Data Fig. 4. Cotadutide improves mitochondrial respiratory function in primary mouse hepatocytes through Gcg signaling mechanisms.
(a) Mitochondrial oxygen consumption rate (OCR) during mitochondrial stress test of healthy primary murine hepatocytes treated ex vivo for 4h with 100 nM Cotadutide, g1437 or Liraglutide compared to vehicle control hepatocytes (n=3 biologically independent samples/group). (b) Basal respiration and (c) maximal respiration measured following injection of uncoupler FCCP. (d) Oxygen consumption of primary mouse hepatocytes shown as the percentage of total respiration that is driven by the oxidation of indicated substrates (n=2 biologically independent samples/group). (e-i) Oxygen consumption of mouse primary hepatocytes, during mitochondrial stress test, treated with Cotadutide +/− AMPK inhibitor, Compound C (e; 20 uM), p38MAPK inhibitor, SB203580 (f; 20 um), mTOR inhibitor, Rapamycin (g; 1 uM), PI3K inhibitor, LY294 (h; 10 uM) or MAPKK inhibitor, PD98 (i; 20 uM) compared with Control treated hepatocytes. n=6 replicates from 1 biological samples for all except for Cotadutide; Cotadutide+SB203580; Rapamycin; Cotadutide+Rapamycin; PD98; Cotadutide+PD98 in which 5 replicates were performed. The experiment was performed on 3 separate occasions with similar results. All data shown as the mean ± SEM. (b-d) One-way ANOVA with Dunnett’s multiple comparisons post-hoc test.
Extended Data Fig. 5
Extended Data Fig. 5. Cotadutide reduces hepatic fibrosis and inflammation corresponding to animals shown in Figures 7 and 8.
(a) representative αSMA stained liver sections, quantification is provided in Fig. 8d. Scale bar = 100 μm. (b) representative PSR stained liver sections, quantification is provided in Fig. 8e. Scale bar = 100 μm. These experiments were performed in ob/ob mice with LFD (n=8); AMLN Vehicle (n=11); Cotadutide (n=7); Liraglutide (n= 10); AMLN-to-LFD (n=10) mice/group.
Extended Data Fig. 6
Extended Data Fig. 6. Grades of histopathological NASH features corresponding to animals in Figures 7 and 8.
(a) steatosis grade, (b) lobular inflammation, (c) biliary hyperplasia and (d) hepatocyte ballooning. LFD (n=8); Vehicle (n=11); Cotadutide (n=7); Liraglutide (n=10); AMLN-to-LFD (n=10). Data represented as the mean ± SEM. Two-sided student’s t-test for LFD vs. vehicle to determine effect of NASH diet; one-way ANOVA, Tukey’s multiple comparison post-hoc test, LFD group excluded.
Extended Data Fig. 7
Extended Data Fig. 7. CD68, a marker of immune cell infiltration, is reduced by Cotadutide in animals corresponding to Figures 7 and 8.
(a) Representative images of CD68 IHC staining of mouse liver and the (b) pathologist graded scoring. LFD control slides are set to baseline of 1 to account for resident Kupffer cells (dark stained spots disperse equally between hepatocytes). Infiltration of immune cells identified by accumulation around vacuoles we scored relative to the baseline. Scale bar = 200 μm. LFD (n=8); Vehicle (n=11); Cotadutide (n=7); Liraglutide (n=10); AMLN-to-LFD (n=10). Data represented as the mean ± SEM. Two-sided student’s t-test for LFD vs. vehicle to determine effect of NASH diet; One-way ANOVA, Tukey’s multiple comparisons post-hoc test, LFD group excluded.
Figure 1.
Figure 1.
Metabolic and hepatic parameters following two-week treatment of DIO GLP-1R WT or KO mice with Cotadutide, Liraglutide, g1437 or Liraglutide+g1437 at equimolar dosing (10 nmol/kg, SC, QD for 14 days) compared to vehicle. Blood and tissues were harvested 20h after administration of the final dose. Animals were given ad libitum access to food for the entirety of the study except for the day of GTT where they were fasted for 6h prior to injection of glucose (1.25 mg/kg). Reduction in body weight throughout the 14 day dosing period shown as % change in WT (a) and KO (b) mice. Cumulative food intake during the first 4 days of dosing in WT (c) and KO (d) mice. Percent change in body weight from vehicle in WT (e) and KO (f) mice. Terminal liver lipid percentage in WT (g) and KO (h) mice. Fasting blood glucose levels, blood glucose profile during IPGTT and area under the glucose curve in WT (i, k and m, respectively) and KO mice (j, l and n, respectively). Plasma glucagon, insulin and leptin in WT (o, q and s, respectively) and KO (p, r and t, respectively) mice. WT Vehicle (n=7); WT Cotadutide (n=8); WT Liraglutide (n=7); WT g1437 (n=7); WT Liraglutide+g1437 (n=7); KO Vehicle (n=8); KO Cotadutide (n=9); KO Liraglutide (n=8); KO g1437 (n=8); KO Liraglutide+g1437 (n=7) mice/group. Data shown as the mean ± SEM. (a-d, i and j) Two-way ANOVA, (e-h, k and l) One-way ANOVA, with Tukey’s multiple comparisons post-hoc. In (a) and (b), lines above the graph indicated differences compared with vehicle at each time point, lines to the right indicated differences between groups at day 14. In (c), (k) and (l) p-values in color represent the treatment group indicated vs. vehicle.
Figure 2.
Figure 2.
Temporal changes in metabolic and hepatic parameters following one-week treatment of DIO C57Bl6/J mice with Cotadutide, Liraglutide, g1437 or Liraglutide+g1437 at equimolar dosing (10 nmol/kg, SC, QD for 7 days) compared to vehicle. Blood and tissues were harvested at indicated timepoints after administration of final dose. Animals were given ad libitum access to food for the entirety of the study. (a) Reduction in body weight throughout the 7 day dosing period shown as % change from baseline, (b) terminal liver lipid percentage, (c) serum GLP-1 receptor bioactivity profiles for Cotadutide and Liraglutide treatments, (d) serum Gcg receptor bioactivity profiles for Cotadutide and g1437 treatments, (e) blood glucose levels, (f) plasma insulin levels, (g) plasma glucagon and (h) liver glycogen content. For each timepoint n=4 mice/group. Data shown as the mean ± SEM. (a, c-h) Two-way ANOVA, (b) One-way ANOVA, with Tuckey’s multiple comparison post-hoc. In (a) lines above the graph indicated differences compared with Vehicle at each time point, lines to the right indicated differences between groups at day 7. In (g) p values indicated differences compared with Vehicle at each time point for the indicated group.
Figure 3.
Figure 3.
Hepatic glycogen flux following one-week treatment of DIO C57Bl6 mice with Cotadutide, Liraglutide or g1437 at equimolar dosing (10 nmol/kg, SC, QD for 7 days) compared to vehicle. (a) Experimental design showing continuous infusion of [6,6-D2]-glucose was initiated 2h following the final dose in fasted animals for 120 min to achieve steady state and then for an additional 120 min with hyperglycemia. (b) Core hepatic glycogen is the liver glycogen content that does not contain radio-labeled glucose indicating it was synthesized prior to initiation of the infusion. (c) Glucose production, (d) gluconeogenesis and (e) glycogenolysis during the fasted, basal state. (f) Net, (g) direct and (h) indirect glycogen synthesis is indicative of incorporation of glucose directly from the circulation or indirectly from diversion of gluconeogenic carbon to glycogen, respectively. (i) Total liver glycogen at the conclusion of the experiment showing the net and core glycogen contributions. (j) Endogenous glucose production, (k) gluconeogenesis and (l) glycogenolysis during the hyperglycemic clamp. (m) Total and (n) newly synthesized hepatic palmitate during 2H2O infusion. (o) Total and (p) newly synthesized hepatic glyceride during 2H2O infusion. Vehicle (n=8); Cotadutide (n=9); Liraglutide (n=10); g1437 (n=9) mice/group. Data shown as the mean ± SEM. One-way ANOVA, with Tuckey’s multiple comparison post-hoc. In (j) Two-way ANOVA, with Tuckey’s multiple comparison post-hoc and colored p-value represent difference of indicated group to vehicle.
Figure 4.
Figure 4.
Cotadutide-induced changes in the hepatic phosphoproteome of carbohydrate and lipid metabolism-related molecules. Hepatic phospho-sites of (a) AMPKα/AMPKβ, (b) proteins involved in glucose metabolism and (c) proteins involved in lipid metabolism detected in DIO mice following repeated dosing of Cotadutide (10 nmol/kg, SC, QD for 7 days) compared to vehicle. Livers were harvested at indicated timepoints after administration of final dose. For each timepoint n=3 mice/group. Adjusted p-values from in-built ANOVA are shown in Supplementary Table 2. (d) Differential abundance of phosphopeptides detected in primary murine hepatocytes following a 10 min treatment with 100 nM g1437, a GcgR agonist. Abundance in g1437-treated cells relative to unstimulated control cells (n=5/group). The experiment was replicated on 2 separate occasions yielding similar results. Bold text indicates known PKA-targeted sites; ^ indicates homologous sites identified in human hepatocytes. (e) De novo lipogenesis in primary murine hepatocytes treated ex vivo with 100 nM Cotadutide (n=6), 100 nM g1437 (n=6) or 100 nM Liraglutide (n=3) shown as 3H-acetate lipid incorporation relative to vehicle-treated controls (n=9). Sample size indicates biologically independent experiments and data shown as the mean ± SEM. (f) Differential abundance of phosphopeptides detected in primary human hepatocytes following a 10 or 20 min treatment with 100 nM g1437. Abundance in g1437-treated cells relative to unstimulated control cells (n=3 biologically independent samples/group). d-f: data shown as mean ± SEM; d, f: vs. unstimulated controls, two-sided Student’s t-test; e: vs. vehicle controls, one-way ANOVA with Tuckey’s multiple comparison post-hoc.
Figure 5.
Figure 5.
Cotadutide induces mitochondrial turnover and improves mitochondrial respiration. (a) Representative live cell confocal microscopy images showing mouse primary hepatocytes treated ex vivo with 100 nM Cotadutide, g1437 or Liraglutide for 2h and stained with Mitotracker green and Lysotracker Deep red. Scale bar = 25 μm. (b) Quantification of Lysotracker deep red puncta that contain Mitotracker green as a measure of mitophagosomes Control (n=15); Cotadutide (n=24); Liraglutide (n=14); g1537 (n=11) cells/treatment. (c) Ppargc1a mRNA levels in primary mouse hepatocytes treated with increasing concentrations (1, 10, and 100 nM) of Cotadutide, g1437, or Liraglutide for 4h. Cells were also treated with 100 nM Cotadutide plus 10 μM H89. (n=3 biologically independent samples/group) (d) PPARGC1a mRNA in primary human hepatocytes from normal or NASH donors treated with 100 nM Cotadutide, g1437, or Liraglutide for 4 h (n=3 biologically independent samples/group). (e) Oxygen consumption rate during mitochondrial stress test of primary murine NASH hepatocytes treated ex vivo for 4h with 100 nM Cotadutide (n=12) or 100 nM Liraglutide (n=11) or g1437 (n=11) compared to untreated NASH hepatocytes (n=11). Respiration of untreated primary hepatocytes from lean C57BL6J controls (n=3) also shown (Sample size indicates number of replicates from a single biological sample. The experiment was repeated 3 times yeilding similar results). (f) Basal and (g) maximal respiration from (e). (h and i) Oxygen consumption of healthy mouse primary hepatocytes treated with Cotadutide +/− PKA inhibitor, H89 (h; 10 uM) or PLC inhibitor, U73122 (i; 10 uM) (n=6 replicates for a single biologically sample. The experiment was repeated 3 time yeilding similar results). All data shown as the mean ± SEM. (b-d) vs. vehicle controls, one-way ANOVA with Dunnett’s multiple comparisons post-hoc test; (f, g) Two-sided student’s t-test for C57BL6J, vehicle vs. ob/ob AMLN, vehicle to determine effect of dieat and one-way ANOVA with Tukey’s multiple comparisons post-hoc, C57BL6J, vehicle group excluded.
Figure 6.
Figure 6.
Superior efficacy of Cotadutide on NASH endpoints in C57BL6/J mice fed AMLN diet for 29 weeks compared to Liraglutide and Obeticholic acid. Effect of sub-chronic Cotadutide (10 nmol/kg, SC, QD for 6 weeks), Liraglutide (40 nmol/kg, SC, QD for 6 weeks) or Obeticholic acid (OCA, 70 μmol/kg, PO, QD for 6 weeks) compared to vehicle or lean chow-fed mice. (a) Body weight expressed as change in body weight from baseline (%). (b) Cumulative food intake over the first 4 days of dosing. (c) Blood glucose profile following intraperitoneal injection of 1.5 mg/kg glucose after 4 weeks of dosing. (d) Area under the GTT curve. (e) Time 0 and 15 min plasma insulin levels during GTT. (f) Terminal liver weight normalized to body weight. (g) Terminal plasma ALT. (h) Hepatic glycogen levels. Serum and liver levels of total lipid species of (i) triglycerides, (j) diacylglycerols, (k) cholesterol esters, and (l) free fatty acids. (m) Representative type I collagen-stained liver sections. Scale bar = 200 μm. Responder rate (number of mice to exhibit improved vs. no change vs. higher) for (n) steatosis, (o) inflammation, (p) ballooning, (q) NAFLD activity score (NAS) and (r) fibrosis, shown as number of mice per group and evaluated by comparing scores from terminal vs. pre-study biopsy liver sections. Chow (n=9); Vehicle (n=12); Cotadutide (n=12); Liraglutide (n=12); OCA (n=12) mice/group. Data represented as mean ± SEM. (a, b, c) vs. vehicle controls, two-way repeated measures ANOVA followed by Dunnett’s multiple comparisons post-hoc test; (d-l) Two-sided Student’s t-test for chow controls vs. vehicle to determine effect of NASH diet; one-way ANOVA, with Tuckey’s multiple comparison post-hoc, chow group excluded; (n-q) vs. vehicle, Chi-square test for pairwise comparisons to vehicle.
Figure 7.
Figure 7.
Superior reductions in liver lipid with Cotadutide versus Liraglutide in ob/ob AMLN mouse model of NASH. Effect of sub-chronic Cotadutide (30 nmol/kg, SC, QD for 6 weeks), Liraglutide (40 nmol/kg, SC, QD for 6 weeks) or reversion from NASH-inducing diet to LFD (AMLN-to-LFD) in male ob/ob AMLN NASH mice compared to untreated ob/ob LFD controls and vehicle-treated AMLN NASH mice. (a) Body weight expressed as change in body weight from baseline (%). (b) Body composition expressed as percent lean and fat mass. (c) Blood glucose profile following intraperitoneal injection of 1.5 mg/kg glucose after 4 weeks of dosing and (d) area under the glucose curve. (e) Terminal liver weight shown as percentage of body weight. (f) Representative H&E-stained liver sections. Scale bar = 200 μm. (g) Terminal percent liver lipid content. Terminal hepatic concentration of (h) free fatty acid, (i) diacylglycerol, (j) triglyceride, (k) cholesterol esters, and (l) ceramide. (m) Hepatic fatty acid metabolism-related metabolite levels relative to vehicle-treatment. (n) Hepatic mRNA expression of fatty acid oxidation genes. LFD (n=8); Vehicle (n=11); Cotadutide (n=7); Liraglutide (n= 10); AMLN-to-LFD, Vehicle (n=10) mice/group. Data represented as the mean ± SEM. (a, c) Two-way repeated measures ANOVA followed by Dunnett’s multiple comparisons post-hoc test vs. vehicle controls; (b, d, e, g-l, n) Two-sided student’s t-test for vehicle vs. LFD to determine effect of NASH diet and One-way ANOVA, with Tuckey’s multiple comparisons post-hoc, LFD group excluded.
Figure 8.
Figure 8.
Cotadutide further reduces hepatic fibrosis and inflammation compared to Liraglutide or diet switch in ob/ob AMLN mouse model of NASH. Effect of sub-chronic Cotadutide (30 nmol/kg, SC, QD for 6 weeks), Liraglutide (40 nmol/kg, SC, QD for 6 weeks) or reversion to LFD on fibrosis endpoints from male ob/ob NASH mice. (a) representative type-I collagen stained liver sections. Scale bar = 200 μm. (b) quantification of Col1a1 staining in a. (c) Plasma ALT levels. (d) Quantification of αSMA staining, representative images in Supplementary Fig. 14. (e) Quantification of PSR staining, representative images in Supplementary Fig. 14. (f) Liver hydroxyproline content. (g) NAFLD activity scores. (h) fibrosis scores. Quantification of plasma levels of (i) C3M, a type III collagen peptide fragment, (j) P4NP7S, a type IV collagen pro-peptide fragment and (k) pro-C5. (l) Hepatic transcript levels of fibrosis- and inflammation-related genes. LFD (n=8); Vehicle (n=11); Cotadutide (n=7); Liraglutide (n= 10); AMLN-to-LFD (n=10) mice/group. Data represented as the mean ± SEM. Two-sided student’s t-test for vehicle vs. LFD to determine effect of NASH diet. One-way ANOVA, with Tuckey’s multiple comparison post-hoc, LFD group excluded, for treatment effects.
Figure 9.
Figure 9.
Summary of Cotadutide mechanism of action at target organs.The dual-agonist activity of Cotadutide acts at the GLP-1R in the brain to inhibit appetite resulting in decreased food intake and body weight loss. Meanwhile the GLP-1R agonist activity at the pancreatic β-cells increases insulin secretion to improve whole body glucose control. Cotadutide also acts at the GcgR of hepatocytes in the liver to improved mitochondrial maintenance and function leading to lower levels of oxidative stress. GcgR signaling in the liver also decreases de novo lipogenesis and glycogen synthesis resulting in lower lipid content a greater flux of glucose through the liver. Altogether, these action in the liver reduces inflammation and stellate cell activation resulting in less fibrosis, a major hallmark of NASH morbidity and mortality. Although these observations originated from preclinical studies in mouse models of NASH, these effects are being replicated in clinical studies of T2D patients.

References

    1. Younossi Z, et al. Global burden of NAFLD and NASH: trends, predictions, risk factors and prevention. Nat Rev Gastroenterol Hepatol 15, 11–20 (2018). - PubMed
    1. Ibrahim SH, Hirsova P & Gores GJ Non-alcoholic steatohepatitis pathogenesis: sublethal hepatocyte injury as a driver of liver inflammation. Gut 67, 963–972 (2018). - PMC - PubMed
    1. Friedman SL, Neuschwander-Tetri BA, Rinella M & Sanyal AJ Mechanisms of NAFLD development and therapeutic strategies. Nature Medicine 24, 908–922 (2018). - PMC - PubMed
    1. Cusi K Treatment of patients with type 2 diabetes and non-alcoholic fatty liver disease: current approaches and future directions. Diabetologia 59, 1112–1120 (2016). - PMC - PubMed
    1. Bueter M & le Roux CW Gastrointestinal hormones, energy balance and bariatric surgery. Int J Obes (Lond) 35 Suppl 3, S35–39 (2011). - PubMed

References for Materials and Methods

    1. Ayala JE, et al. Hyperinsulinemic-euglycemic Clamps in Conscious, Unrestrained Mice. J Vis Exp, e3188 (2011). - PMC - PubMed
    1. Steele R, Wall JS, De Bodo RC & Altszuler N Measurement of size and turnover rate of body glucose pool by the isotope dilution method. Am J Physiol 187, 15–24 (1956). - PubMed
    1. Bederman IR, Foy S, Chandramouli V, Alexander JC & Previs SF Triglyceride synthesis in epididymal adipose tissue: contribution of glucose and non-glucose carbon sources. J Biol Chem 284, 6101–6108 (2009). - PMC - PubMed
    1. Hasenour CM, et al. Mass spectrometry-based microassay of 2H and 13C plasma glucose labeling to quantify liver metabolic fluxes in vivo. Am J Physiol Endocrinol Metab 309, E191–203 (2015). - PMC - PubMed
    1. Young JD INCA: a computational platform for isotopically non-stationary metabolic flux analysis. Bioinformatics 30, 1333–1335 (2014). - PMC - PubMed

Publication types

MeSH terms