. 2020 Jun 1:9:e58436.
doi: 10.7554/eLife.58436.

Retrocopying expands the functional repertoire of APOBEC3 antiviral proteins in primates

Affiliations

Retrocopying expands the functional repertoire of APOBEC3 antiviral proteins in primates

Lei Yang et al. Elife. .

Abstract

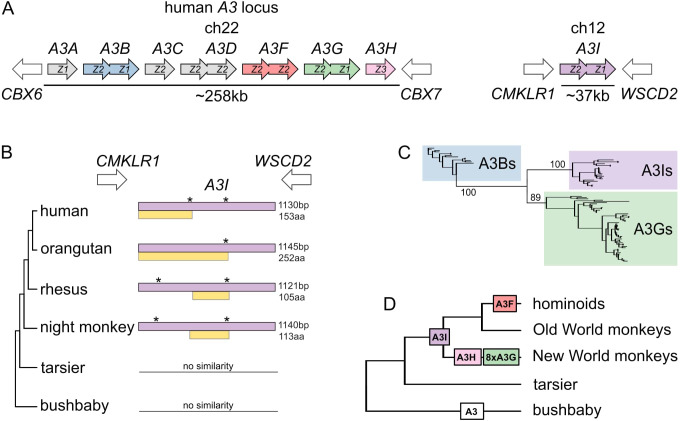
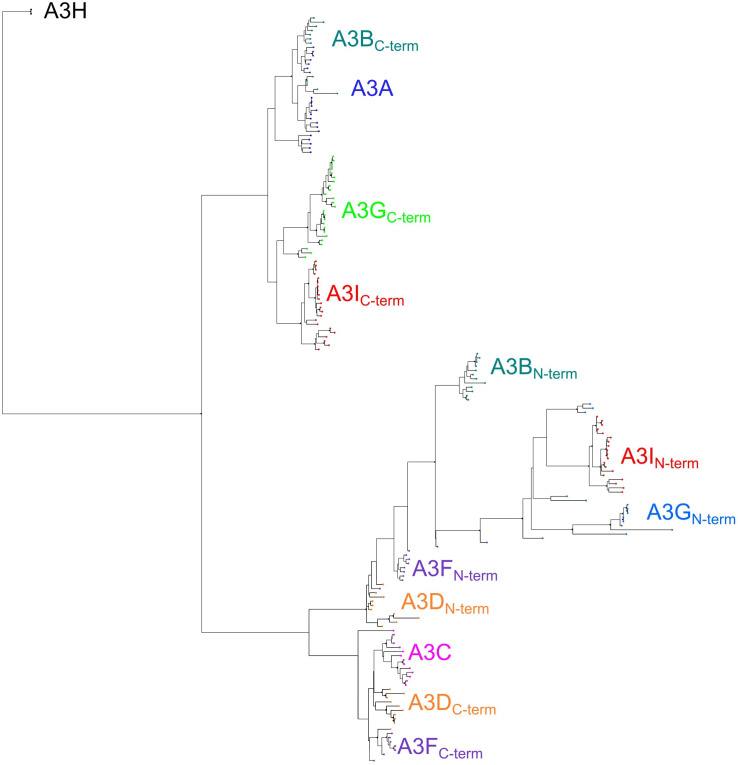
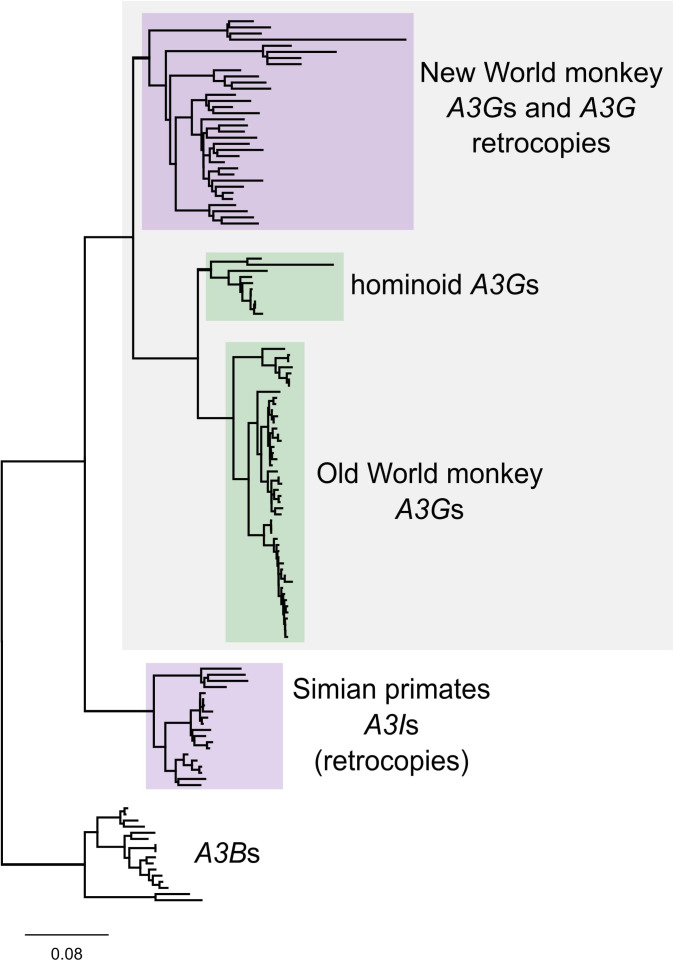
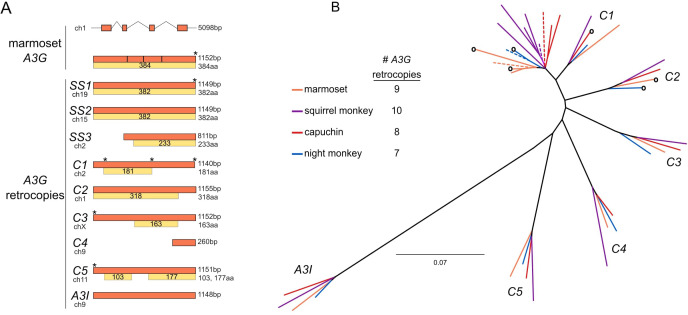
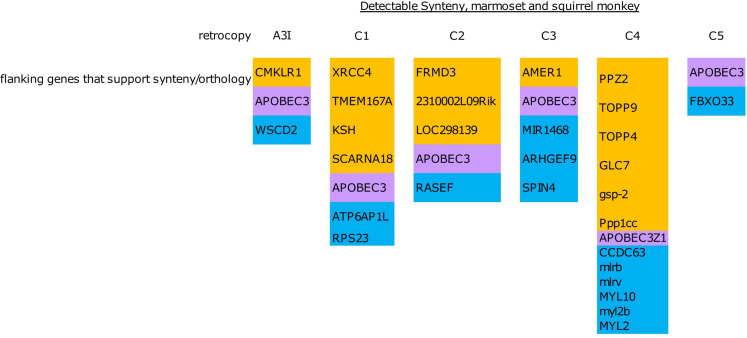
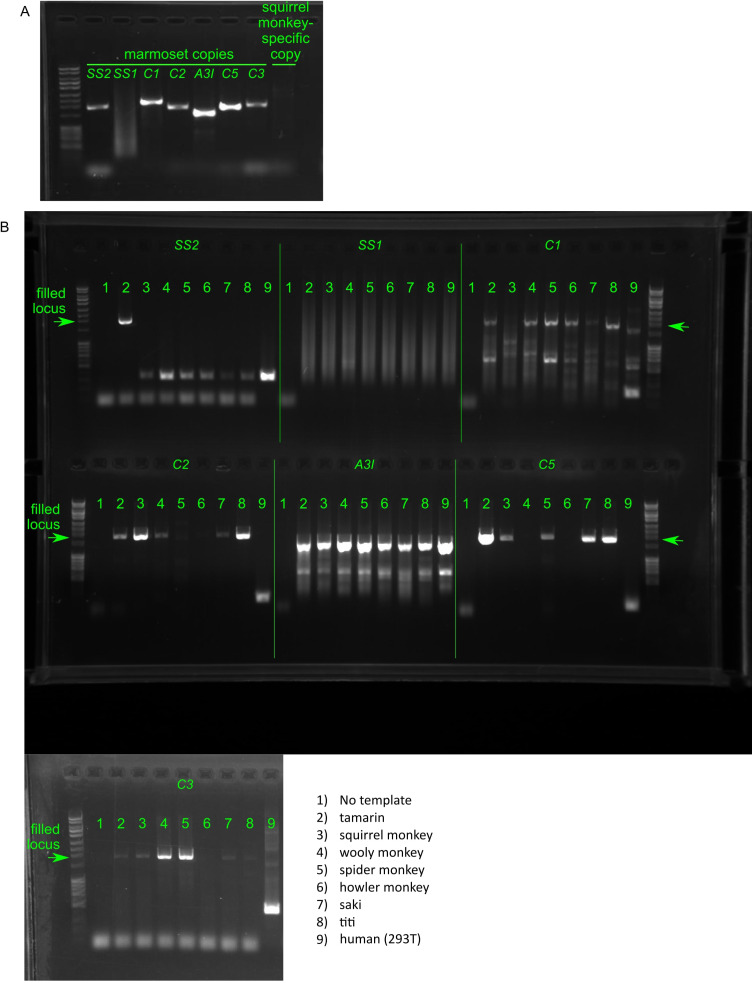
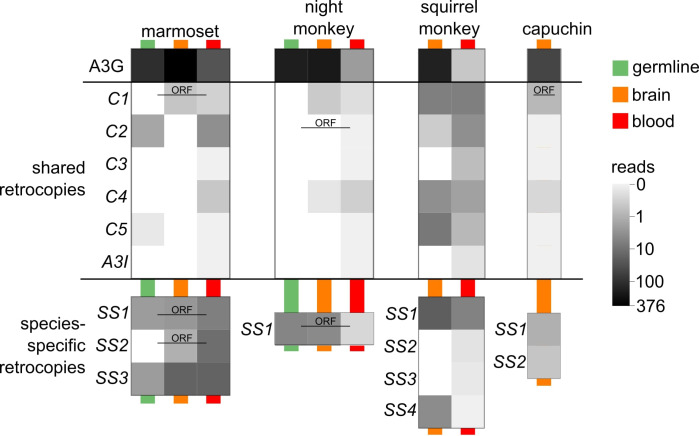
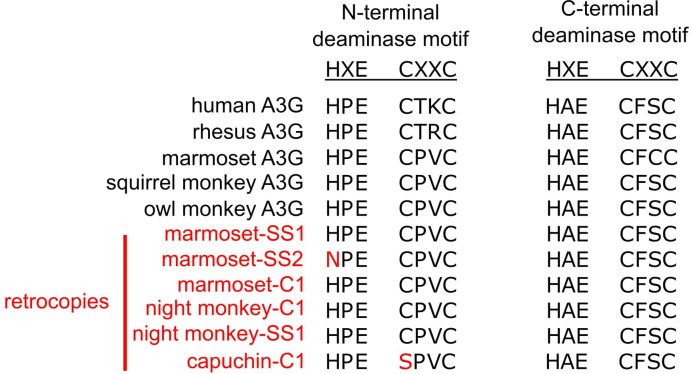
Host-virus arms races are inherently asymmetric; viruses evolve much more rapidly than host genomes. Thus, there is high interest in discovering mechanisms by which host genomes keep pace with rapidly evolving viruses. One family of restriction factors, the APOBEC3 (A3) cytidine deaminases, has undergone positive selection and expansion via segmental gene duplication and recombination. Here, we show that new copies of A3 genes have also been created in primates by reverse transcriptase-encoding elements like LINE-1 or endogenous retroviruses via a process termed retrocopying. First, we discovered that all simian primate genomes retain the remnants of an ancient A3 retrocopy: A3I. Furthermore, we found that some New World monkeys encode up to ten additional APOBEC3G (A3G) retrocopies. Some of these A3G retrocopies are transcribed in a variety of tissues and able to restrict retroviruses. Our findings suggest that host genomes co-opt retroelement activity in the germline to create new host restriction factors as another means to keep pace with the rapid evolution of viruses. (163).

Keywords: APOBEC3; evolutionary biology; genome defense; genome evolution; infectious disease; microbiology; restriction factors; retrogenes; transposable elements.


Conflict of interest statement

LY, ME, HM, RM No competing interests declared

Figures

Figure 1.
Figure 1.. Identification and phylogenetic distribution of A3I.
(A) A3I is located away from the A3 locus at a distant but highly conserved syntenic locus in all simian primates. The human genome is shown as an example. (B) ORF structure of A3I in various primate species. Purple boxes represent sequences that can be aligned to the intron-containing A3 copies, whereas yellow boxes represent the longest ORF of the A3I in corresponding species. Stars (*) indicate the position of stop codons. (C) Maximum likelihood phylogeny of A3Is and the intron-containing A3Bs and A3Gs. Clusters of A3Is, A3Gs, and A3Bs are highlighted by their respective color, and bootstrap values leading to these clusters are shown on the nodes. (D) Expansion of A3 retrocopies along the primate phylogeny. The number of retrocopies of each A3 is shown in color boxes at the inferred point of retrocopy birth in the primate phylogeny. The white ‘A3’ box represents a sequence that could not be assigned to a particular ortholog.
Figure 1—figure supplement 1.
Figure 1—figure supplement 1.. A phylogeny of the domains of primate A3s and A3G retrocopies A PhyML tree of the domains of A3s and A3Is.
Primate A3s with two deaminase domains were split into their constituent N-terminal and C-terminal domains and aligned together with all single deaminase domain A3s. Black triangles indicate bootstraps > 90%.
Figure 1—figure supplement 2.
Figure 1—figure supplement 2.. A phylogeny of primate A3s and A3G retrocopies A PhyML tree of nucleotide sequences of an alignable region of A3Gs and A3Bs from diverse simian primates in addition to A3G retrocopies from New World monkeys.
Tree is rooted on the A3B group. New World monkey retrocopies group with New World monkey A3Gs which group in a larger group with A3Gs from all simian primates. Exceptionally, one retrocopy (A3I) is found in all simian primate genomes and forms a monophyletic group that branches before the diversification of simian primates (and their A3Gs).
Figure 2.
Figure 2.. Discovery and phylogenetic analysis of A3G retrocopies in New World monkeys.
(A) The common marmoset (Callithrix jacchus) genome encodes a single A3G and nine retrocopies of A3G (orange boxes). A3G resides on four coding exons at the A3 locus on chromosome 1, while the retrocopies are intronless and found throughout the genome. Some retrocopies contain putative protein-coding ORFs (yellow boxes) of varying lengths that retain alignable sequence similarity to the A3G protein (gray within yellow boxes, regions of poor alignment caused by frame-shifting mutations). (B) PhyML tree of A3G and A3G retrocopies from the four sequenced and assembled New World monkey genomes suggests that six retrocopies are orthologous and conserved in all four species (clusters C1-C5 and A3I). The genome of each species (colors correspond to species) contains an intron-containing A3G (dotted line) as well as retrocopies that are closely related to A3G. These more recent copies are found in only one genome, without identifiable orthologs in the other three species. Some retrocopies retain a putative protein coding ORF (indicated by a circle at the branch tip).
Figure 2—figure supplement 1.
Figure 2—figure supplement 1.. Synteny analysis of retrocopies in marmoset and squirrel monkey for inference of orthology UCSC table browser was used to identify the genes on either side of each retrocopy in marmoset and squirrel monkey.
An occurrence of the same genes on both sides of a copy in each species was used as an indicator of synteny and therefore orthology. All inferred orthologous pairs were also supported by phylogenetic groupings.
Figure 2—figure supplement 2.
Figure 2—figure supplement 2.. PCR of genomic DNA of New World monkeys to date retrocopy births.
(A) PCR amplification of marmoset genomic DNA using oligos designed to designed to amplify each retrocopy locus in marmoset shows filled loci for 6/7 retrocopies and a failed PCR reaction for retrocopy SS1. Oligos designed to amplify a squirrel-monkey copy, not found in marmoset, show no band. (B) Amplification of marmoset retrocopy-containing loci in a panel of New World monkeys plus human genomic DNA show variable presence and/or retention of retrocopies across species.
Figure 3.
Figure 3.. A3G retrocopies are transcribed in New World Monkey tissues A heat map shows the counts of RNA-seq reads (log10 of read count + 1) that map uniquely at 100% identity and coverage.
Each pixel represents the average read counts of available data for the corresponding tissue type and A3G retrocopy. Tissue types are marked by the colored lines behind the pixels. Green represents germline tissues including iPSC, ESC, testis and ovary; orange represents brain tissues of various regions; red represents blood samples including whole blood and lymphocytes. Retrocopies which retain a putative protein coding ORF are labeled with ‘ORF’.
Figure 4.
Figure 4.. A3G retrocopies retain core deaminase motifs.
An amino acid alignment of the core deaminase motifs shows that A3Gs of various primates have conserved HxE-CxxC motifs in both the N- and C-terminal domains. The putative ORF-encoding retrocopies all retain a conserved C-terminal motif, and most retain an N-terminal motif.
Figure 5.
Figure 5.. Simulation and evolution suggest selection to retain ORFs in A3G retrocopies.
(A) A simulation of ORF retention suggests most are lost within 10–20 million years in the absence of any selection to retain the ORF. Dots indicate the proportion of simulated ORFs (10,000 total) that were still intact after a given time. Colors represent three sets of parameters intended to match New World monkeys (green) or provide liberal (orange, mouse-like) and conservative (blue, human-like) bounds on the parameter sets of indel rate and generation time. The substitution rate of Ma’s night monkey was used for all three sets of simulations. Horizontal red lines indicate the 1 st and 5th percentile of intact ORFs. Vertical red lines mark the key time points of last common ancestors (LCA) among New World monkeys.
Figure 5—figure supplement 1.
Figure 5—figure supplement 1.. Analysis of selection in the evolution of retrocopies.
Top, PAML free ratio analysis of selection along branches (omega values for terminal branches shown in orange). Omega values less than one for all terminal branches leading to A3Gs suggest these genes have evolved under purifying selection. The branches leading to the two retrocopies that restrict retrovirus have elevated omega values (significantly higher than dN/dS = 1, p=0.058 for capuchin-C1, p=0.025 for marmoset-SS1) suggesting these retrocopies have evolved under positive selection. Bottom, RELAX analysis of overall selection when comparing A3Gs (purple) to A3G retrocopies (black) suggests the retrocopies have evolved under intensified selection (no detection of relaxation of selection) relative to the presumably functional A3Gs.
Figure 6.
Figure 6.. A3G retrocopies restrict HIV-1 but not LINE-1 Bar charts of measured restriction of LINE-1 (retrotransposition assays) and HIV-1ΔVif (single cycle infectivity assays) show that NWM A3Gs and some A3G retrocopies restrict retrovirus.
Only NWM A3Gs, but not retrocopies restrict LINE-1.
Figure 6—figure supplement 1.
Figure 6—figure supplement 1.. Western blot of A3s and A3G retrocopies For each construct, 50 ng plasmid was transfected into 25,000 293T cells in a single well of a 24 well plate.
Forty-eight hours later, cells were harvested, lysed, and probed with Covance mouse HA.11 Clone 16B12 anti-HA monoclonal antibody.

Similar articles

Cited by

References

    1. Arias JF, Koyama T, Kinomoto M, Tokunaga K. Retroelements versus APOBEC3 family members: no great escape from the magnificent seven. Frontiers in Microbiology. 2012;3:275. doi: 10.3389/fmicb.2012.00275. - DOI - PMC - PubMed
    1. Balasubramanian S, Zheng D, Liu YJ, Fang G, Frankish A, Carriero N, Robilotto R, Cayting P, Gerstein M. Comparative analysis of processed ribosomal protein pseudogenes in four mammalian genomes. Genome Biology. 2009;10:R2. doi: 10.1186/gb-2009-10-1-r2. - DOI - PMC - PubMed
    1. Beck CR, Garcia-Perez JL, Badge RM, Moran JV. LINE-1 elements in structural variation and disease. Annual Review of Genomics and Human Genetics. 2011;12:187–215. doi: 10.1146/annurev-genom-082509-141802. - DOI - PMC - PubMed
    1. Best S, Le Tissier P, Towers G, Stoye JP. Positional cloning of the mouse retrovirus restriction gene Fv1. Nature. 1996;382:826–829. doi: 10.1038/382826a0. - DOI - PubMed
    1. Bininda-Emonds OR, Cardillo M, Jones KE, MacPhee RD, Beck RM, Grenyer R, Price SA, Vos RA, Gittleman JL, Purvis A. The delayed rise of present-day mammals. Nature. 2007;446:507–512. doi: 10.1038/nature05634. - DOI - PubMed

Publication types