. 2020 Jun 1:9:e57438.
doi: 10.7554/eLife.57438.

Tissue-resident macrophages promote extracellular matrix homeostasis in the mammary gland stroma of nulliparous mice

Affiliations

Tissue-resident macrophages promote extracellular matrix homeostasis in the mammary gland stroma of nulliparous mice

Ying Wang et al. Elife. .

Abstract

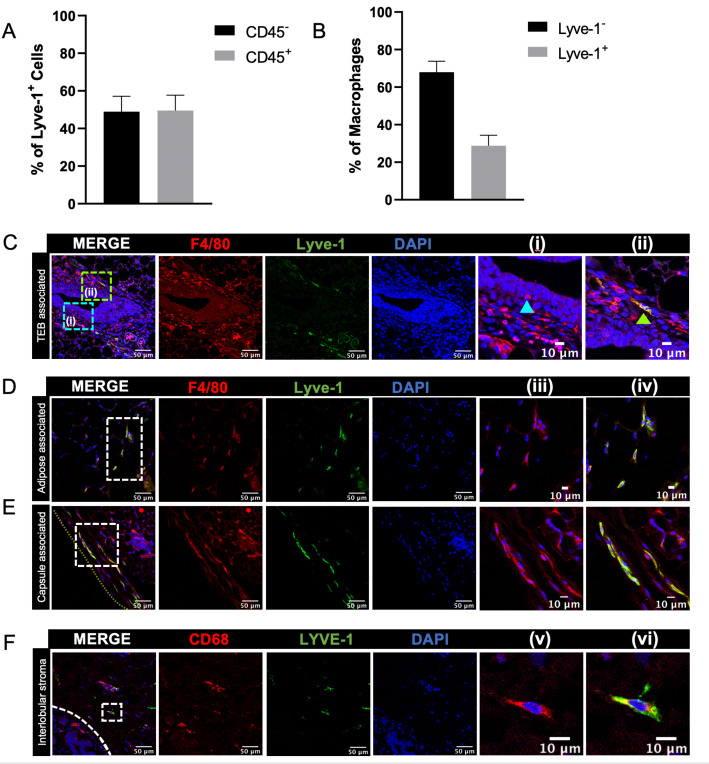
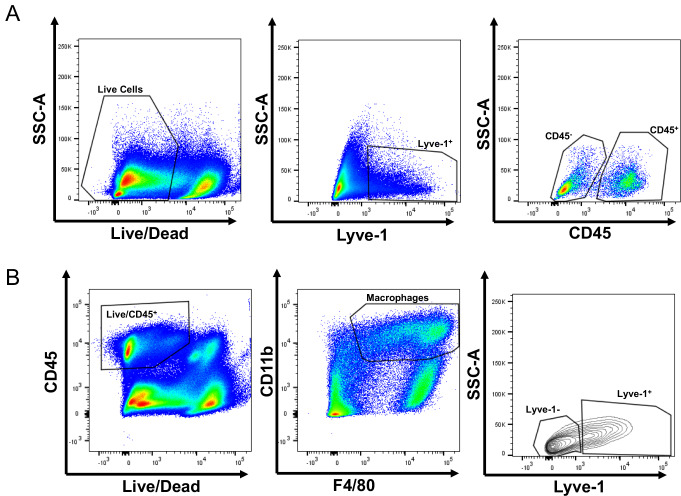
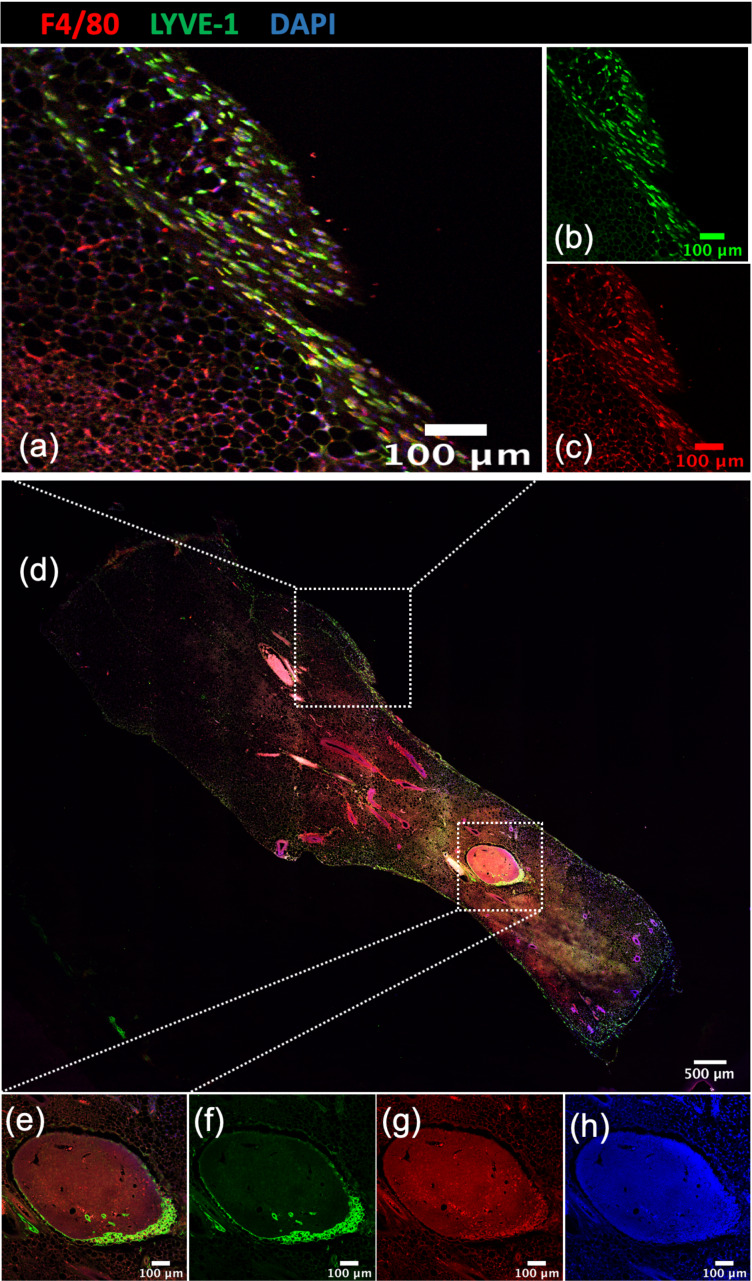
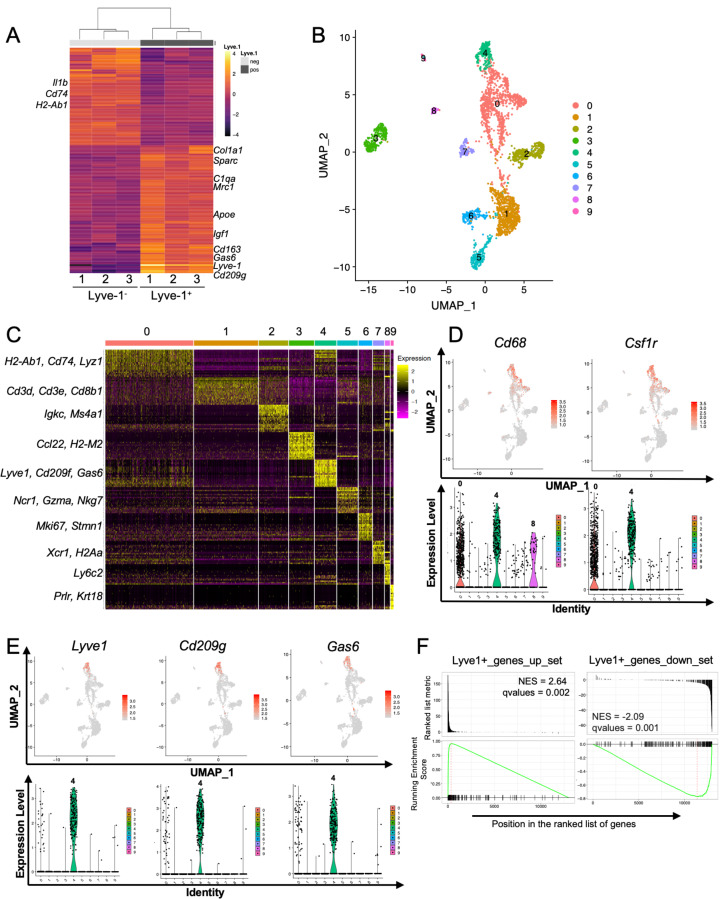
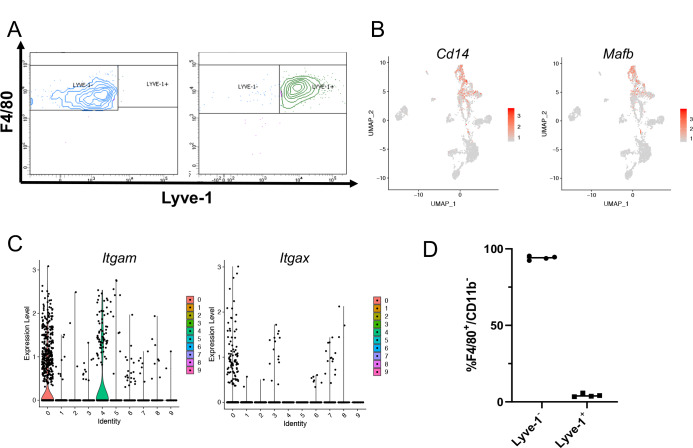
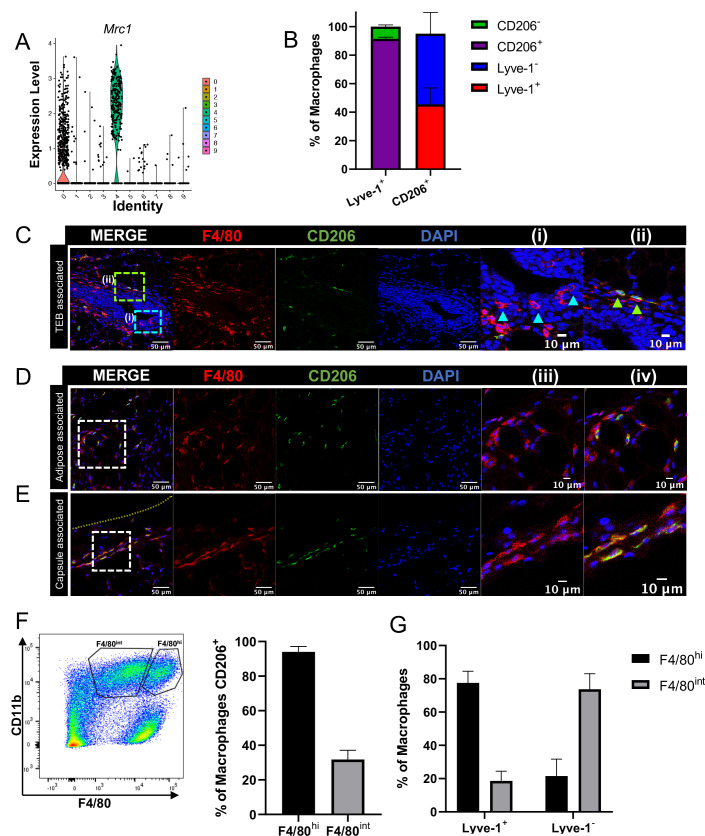
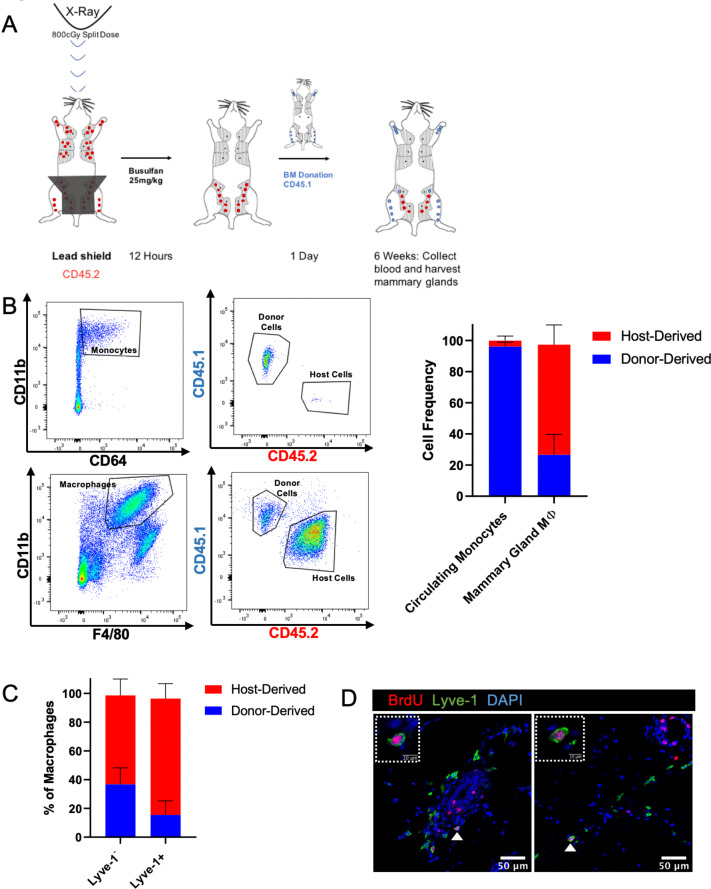
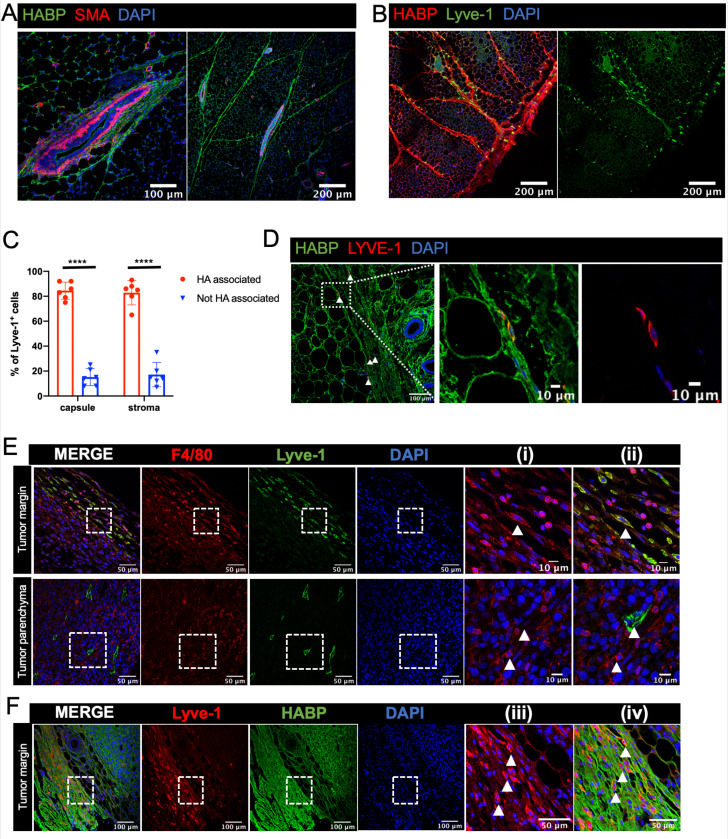
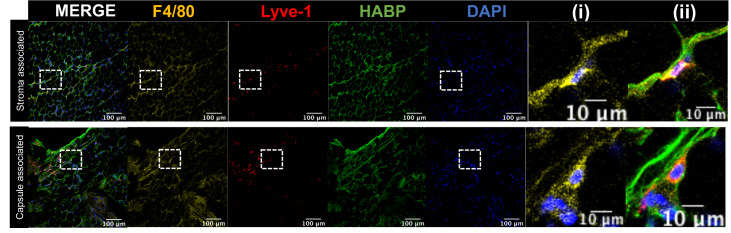
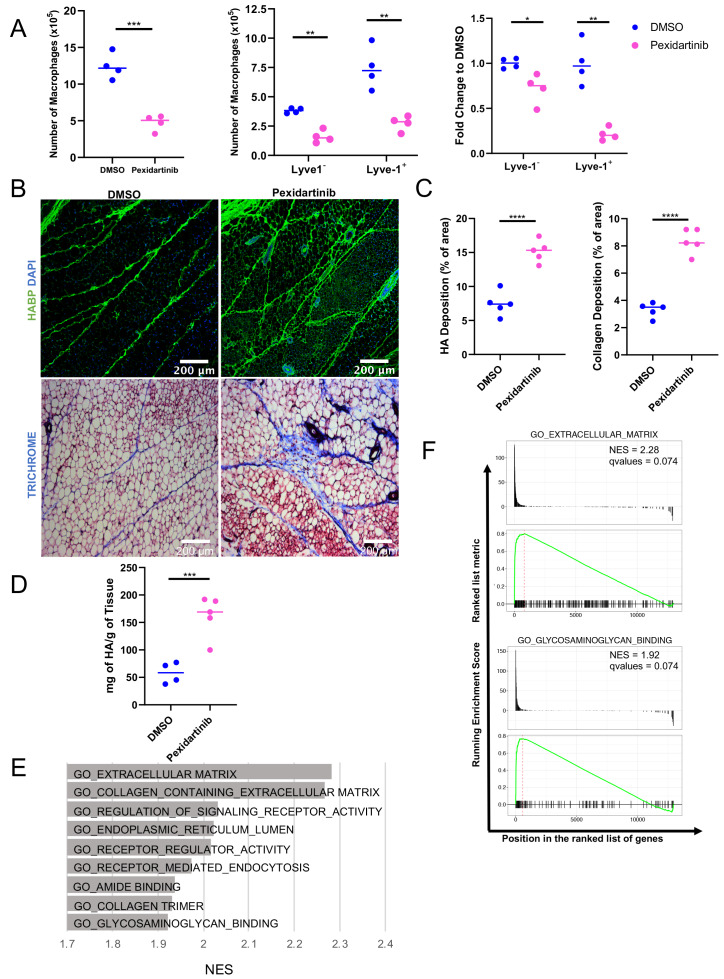
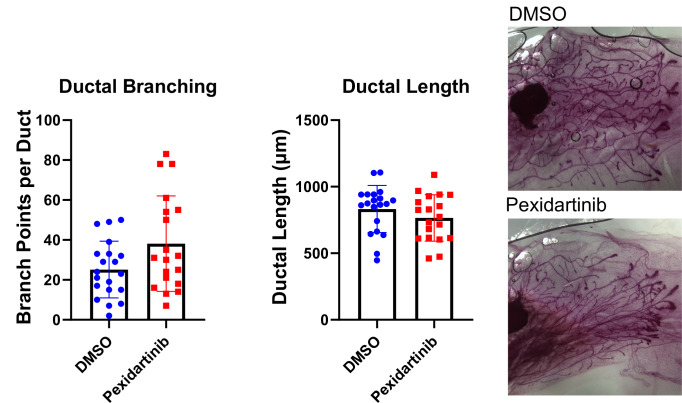
Tissue-resident macrophages in the mammary gland are found in close association with epithelial structures and within the adipose stroma, and are important for mammary gland development and tissue homeostasis. Macrophages have been linked to ductal development in the virgin mammary gland, but less is known regarding the effects of macrophages on the adipose stroma. Using transcriptional profiling and single-cell RNA sequencing approaches, we identify a distinct resident stromal macrophage subpopulation within the mouse nulliparous mammary gland that is characterized by the expression of Lyve-1, a receptor for the extracellular matrix (ECM) component hyaluronan. This subpopulation is enriched in genes associated with ECM remodeling and is specifically associated with hyaluronan-rich regions within the adipose stroma and fibrous capsule of the virgin mammary gland. Furthermore, macrophage depletion leads to enhanced accumulation of hyaluronan-associated ECM in the adipose-associated stroma, indicating that resident macrophages are important for maintaining homeostasis within the nulliparous mammary gland stroma.

Keywords: developmental biology; extracellular matrix; immunology; inflammation; macrophage; mammary gland; mouse; stroma.


Conflict of interest statement

YW, TC, RL, DH, PW, AI, AN, HM, KS No competing interests declared

Figures

Figure 1.
Figure 1.. Identification of Lyve-1+ macrophages in the mammary gland.
(A) Mammary glands from 10-week-old mice (n = 4) were assessed for CD45+ and CD45 Lyve-1+ cells by flow cytometry. (B) Mammary glands from 10-week-old mice (n = 4) were assessed for CD45+CD11b+F4/80+Lyve-1 and CD45+CD11b+F4/80+Lyve-1+ cells by flow cytometry. (C) Mammary glands were harvested from 6-week-old mice, immunostaining was performed for F4/80 and Lyve-1, and the localization of single- and double-positive cells associated with TEBs was examined (n = 5, three images/localization). Representative images of F4/80+Lyve-1 (i, arrowhead) and F4/80+Lyve-1+ (ii, arrowhead) cells are shown. Yellow lines show the margin of the mammary gland. Insets show higher magnification. (D, E) Representative images of F4/80+Lyve-1+ cells in the adipose stroma and fibrous capsule of the mammary gland. Representative images show F4/80 (iii) and co-staining (iv). Inserts show higher magnification. (F) Human mammary glands obtained from reduction mammoplasty samples demonstrate the presence of CD68+Lyve-1+ macrophages in the interlobular stroma (n = 5, three images/sample). Representative images show F4/80 (v) and co-staining (vi).
Figure 1—figure supplement 1.
Figure 1—figure supplement 1.. Identification of Lyve-1+ macrophages in the mammary gland.
(A) Gating of flow cytometry for CD45+ and CD45 Lyve-1+ cells. (B) Gating of flow cytometry for CD45+CD11b+F4/80+Lyve-1 and CD45+CD11b+F4/80+Lyve-1+ cells.
Figure 1—figure supplement 2.
Figure 1—figure supplement 2.. Localization of Lyve-1+ macrophages in the mammary gland.
Image of a mammary gland from a 6-week-old female mouse (n = 3) stained for F4/80 (red), Lyve-1 (green) and DAPI (blue). Insets show examples of the mammary gland capsule (a–d) and lymph nodes (e–h).
Figure 2.
Figure 2.. Identification of a distinct Lyve-1+ macrophage subpopulation by transcriptional profiling.
(A) Heat map of RNA-seq analysis of CD45+CD11b+F4/80+Lyve-1 and CD45+CD11b+F4/80+Lyve-1+ cells isolated from 6-week-old (lane 1) and 10-week-old (lanes 2–3) mice. Genes shown have an adjusted p-value <0.01 and a fold-change of >1 and <10 (abs values). For each lane, n = 4 pooled mice. (B) UMAP of scRNA-seq analysis of CD45+ cells isolated from 10-week-old mice as generated by Seurat. (C) Heat map of the top 20 differentially regulated genes in each cluster. (D) Feature plots and violin plots of selected macrophage genes. (E) Feature plots and violin plots of genes associated with cluster four that were also found in the bulk RNA-seq analysis. (F) GSEA demonstrating that the single-cell populations (clusters) are enriched for in the data from the bulk RNA-seq analysis.
Figure 2—figure supplement 1.
Figure 2—figure supplement 1.. Identification of a distinct Lyve-1+ macrophage subpopulation by transcriptional profiling.
(A) Post-sort analysis of CD45+CD11b+F4/80+Lyve-1 and CD45+CD11b+F4/80+Lyve-1+ cells that were submitted for bulk RNA-seq analysis. (B) scRNA-seq data showing genes associated with macrophages expressed in clusters 0 and 4. (C) Violin plots showing expression levels of Itgam and Itgax across clusters. (D) Graph showing Lyve-1 expression in F4/80+/CD11b macrophages by flow cytometry.
Figure 3.
Figure 3.. F4/80+Lyve-1+ cells are enriched for CD206 expression.
(A) Violin plot of Mrc1 expression in the single-cell RNA-seq dataset shown in Figure 2. (B) Mammary glands from 10-week-old mice (n = 4) were assessed for CD206 expression in CD45+CD11b+F4/80+Lyve-1- and CD45+CD11b+F4/80+Lyve-1+ cells by flow cytometry. (C) Mammary glands were harvested from 6-week-old mice (n = 5, three images/localization), immunostaining was performed for F4/80 and CD206, and the localization of single- and double-positive cells associated with TEBs was examined. Representative images of F4/80+CD206 (i, arrowheads) and F4/80+CD206+ (ii, arrowheads) cells are shown. (D, E) Representative images of F4/80+CD206+ cells in the adipose stroma and fibrous capsule of the mammary gland. Representative images show F4/80 (iii) and co-staining (iv). The yellow line in panel (E) shows the margin of the mammary gland. Insets show higher magnification. (F) Flow cytometry analysis showing F4/80hi and F4/80int cells in the mammary gland and CD206 expression in each population. (G) Flow cytometry analysis of F4/80 expression on Lyve-1 and Lyve-1+ cells. n = 4 mice analyzed.
Figure 3—figure supplement 1.
Figure 3—figure supplement 1.. F4/80+Lyve-1+ cells are enriched for CD206 expression.
(A) Gating of flow cytometry for Lyve-1 expression in CD45+CD11b+F4/80+CD206 and CD45+CD11b+F4/80+CD206+ cells. (B) Gating of flow cytometry for CD206 expression in CD45+CD11b+F4/80+Lyve-1 and CD45+CD11b+F4/80+Lyve-1+ cells.
Figure 4.
Figure 4.. Lyve-1+ macrophages exhibit low turnover and self-renewal in the mammary gland.
(A) Schematic of shielded bone marrow chimera experiment. (B) Representative flow cytometry plots showing the gating and identification of host (CD45.2) and donor (CD45.1) cells in the blood and mammary gland. Quantification of flow cytometry demonstrates that although most of the monocytes in the blood are donor-derived, the majority of macrophages in the mammary gland are host-derived. Cells were first gated on Live and pan-CD45 expression. In the quantification graphs, n = 23 mice from three separate experiments. (C) Quantification of flow cytometry demonstrates that the majority of Lyve-1+ macrophages remain host-derived 6 weeks after bone marrow transplant. (D) Mammary glands were isolated from mice after a 2 hr BrdU pulse and immunostained for BrdU and Lyve-1 (n = 3, three images/localization). Examples of BrdU+Lyve-1+ cells are shown, insets show higher magnification.
Figure 5.
Figure 5.. Lyve-1+ cells localize to HA-enriched ECM in the mammary gland.
(A) Mammary glands from 6-week-old mice were immunostained for HA using HA binding protein (HABP, green) and smooth muscle actin (SMA, red) (n = 3, three images/sample). (B) Mammary glands from 6-week-old mice were immunostained for HA using HA binding protein (HABP, red) and Lyve-1 (green) showing staining of the fibrous capsule and fibrous septae in the adipose stroma. (C) Quantification of Lyve-1+ cells associated with the capsule and adipose stromal regions in the mammary gland. N = 6 mice, three images analyzed per mammary gland. ****p<0.0001. (D) Co-staining of HABP and Lyve-1 in human mammary gland demonstrating the presence of HA-associated Lyve-1+ cells (n = 3, five images/sample). Arrowheads show Lyve-1+ cells and inserts show higher magnification. (E) Mammary tumor sections from 4T1 tumors were immunostained for F4/80 (red) and Lyve-1 (green) (n = 4, three images/localization). Representative images are shown of the peri-tumoral stroma and the tumor parenchyma. Inserts show higher magnification. (F) Mammary tumor sections from 4T1 tumors were immunostained for Lyve-1 (red) and HABP (green). Insets show higher magnification.
Figure 5—figure supplement 1.
Figure 5—figure supplement 1.. Lyve-1+ cells localize to HA-enriched ECM in the mammary gland.
Mammary glands were stained for F4/80, Lyve-1 and HABP to confirm that Lyve-1+ cells associated with HA are also F4/80+. Insets show higher magnification.
Figure 6.
Figure 6.. Macrophage depletion impacts ECM in the stroma.
(A) 5-week-old female mice were treated with pexidartinib for 2 weeks and mammary glands were harvested for analysis of macrophages for CD45+CD11b+F4/80+ by flow cytometry. Flow cytometry demonstrated depletion of CD45+CD11b+F4/80+Lyve-1 and CD45+CD11b+F4/80+Lyve-1+ cells in the mammary gland following pexidartinib treatment. Quantification of total cell counts and fold-change depletion are shown. Total Macrophages Number DMSO vs pexidartinib, p=0.0007; Lyve1 Macrophages Number DMSO vs pexidartinib, p=0.0015; Lyve1+ Macrophages Number DMSO vs pexidartinib, p=0.0095; Lyve1 Fold Change DMSO vs pexidartinib, p=0.037; Lyve1+ Fold Change DMSO vs pexidartinib, p=0.0052. These data demonstrate one representative experiment, experiments were repeated three times with similar results, n = 4 mice per treatment group. (B) Mammary glands from mice treated with either pexidartinib or solvent control were stained for HA (HABP, green) or with trichrome to visualize collagen-containing ECM (collagen, blue). (C) Quantification of HABP and collagen staining. Between 3 and 6 images/sample were analyzed for HABP and collagen staining, n = 5 per treatment group. Three replicates were used for HABP analysis and one replicate was done for collagen analysis. HA deposition (% of area) DMSO vs pexidartinib, p<0.0001 (pooled) and collagen deposition (% of area) DMSO vs pexidartinib, p<0.0001. (D) Quantification of HA in mammary glands isolated from mice treated with pexidartinib or solvent control normalized to gland weight, p=0.0015, n = 4 mice for control group and n = 5 mice for pexidartinib group. (E) GSEA analysis of the C5 database for gene sets enriched in cluster 4 from the scRNA-seq analysis showing the top nine enriched gene sets by NES. (F) GSEA plots of representative lists identified in panel (E). *, p<0.05; **, p<0.01; ***, p<0.005; ****, p<0.0001; using Welch’s t-test.
Figure 6—figure supplement 1.
Figure 6—figure supplement 1.. Macrophage depletion does not impact ductal elongation of branching.
Quantification of ductal elongation and branching in mammary glands from mice treated with either solvent or pexidartinib for 2 weeks. Ductal Branching DMSO vs pexidartinib, p=0.1081; Ductal Length DMSO vs pexidartinib, p=0.1661. P values generated using Mann-Whitney U Test.

References

    1. Aslakson CJ, Miller FR. Selective events in the metastatic process defined by analysis of the sequential dissemination of subpopulations of a mouse mammary tumor. Cancer Research. 1992;52:1399–1405. - PubMed
    1. Banerji S, Ni J, Wang SX, Clasper S, Su J, Tammi R, Jones M, Jackson DG. LYVE-1, a new homologue of the CD44 glycoprotein, is a lymph-specific receptor for hyaluronan. Journal of Cell Biology. 1999;144:789–801. doi: 10.1083/jcb.144.4.789. - DOI - PMC - PubMed
    1. Bieniasz-Krzywiec P, Martín-Pérez R, Ehling M, García-Caballero M, Pinioti S, Pretto S, Kroes R, Aldeni C, Di Matteo M, Prenen H, Tribulatti MV, Campetella O, Smeets A, Noel A, Floris G, Van Ginderachter JA, Mazzone M. Podoplanin-Expressing macrophages promote lymphangiogenesis and lymphoinvasion in breast Cancer. Cell Metabolism. 2019;30:917–936. doi: 10.1016/j.cmet.2019.07.015. - DOI - PMC - PubMed
    1. Bohrer LR, Chuntova P, Bade LK, Beadnell TC, Leon RP, Brady NJ, Ryu Y, Goldberg JE, Schmechel SC, Koopmeiners JS, McCarthy JB, Schwertfeger KL. Activation of the FGFR-STAT3 pathway in breast Cancer cells induces a hyaluronan-rich microenvironment that licenses tumor formation. Cancer Research. 2014;74:374–386. doi: 10.1158/0008-5472.CAN-13-2469. - DOI - PMC - PubMed
    1. Butcher DT, Alliston T, Weaver VM. A tense situation: forcing tumour progression. Nature Reviews Cancer. 2009;9:108–122. doi: 10.1038/nrc2544. - DOI - PMC - PubMed

Publication types

Substances

Associated data