. 2020 Jun 1;16(6):e1008836.
doi: 10.1371/journal.pgen.1008836. eCollection 2020 Jun.

Adaptation of codon usage to tRNA I34 modification controls translation kinetics and proteome landscape

Affiliations

Adaptation of codon usage to tRNA I34 modification controls translation kinetics and proteome landscape

Xueliang Lyu et al. PLoS Genet. .

Abstract

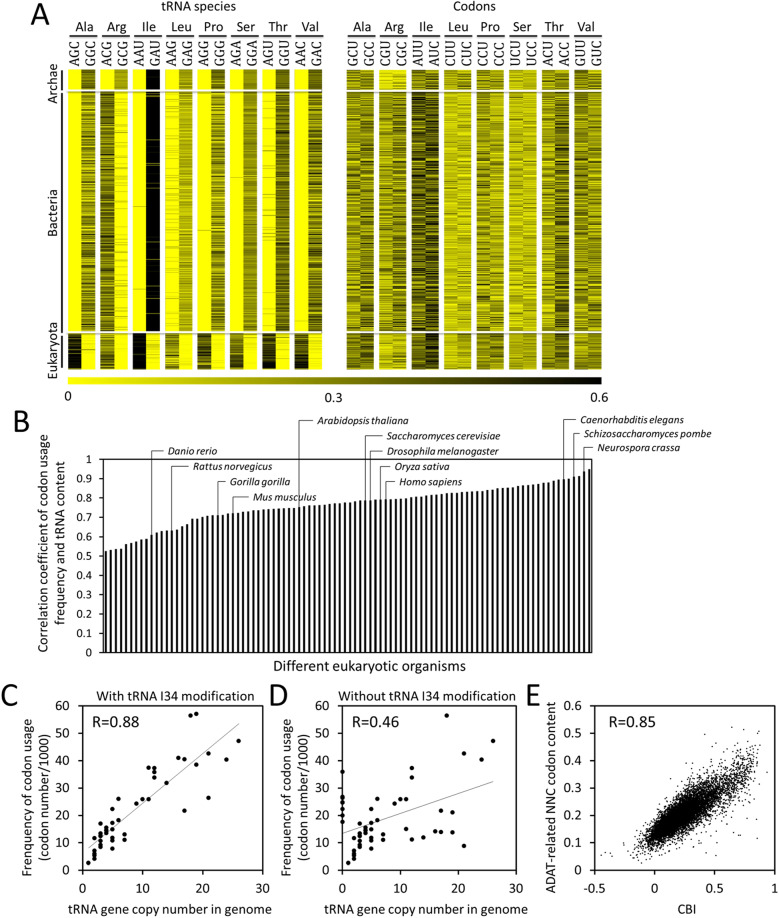
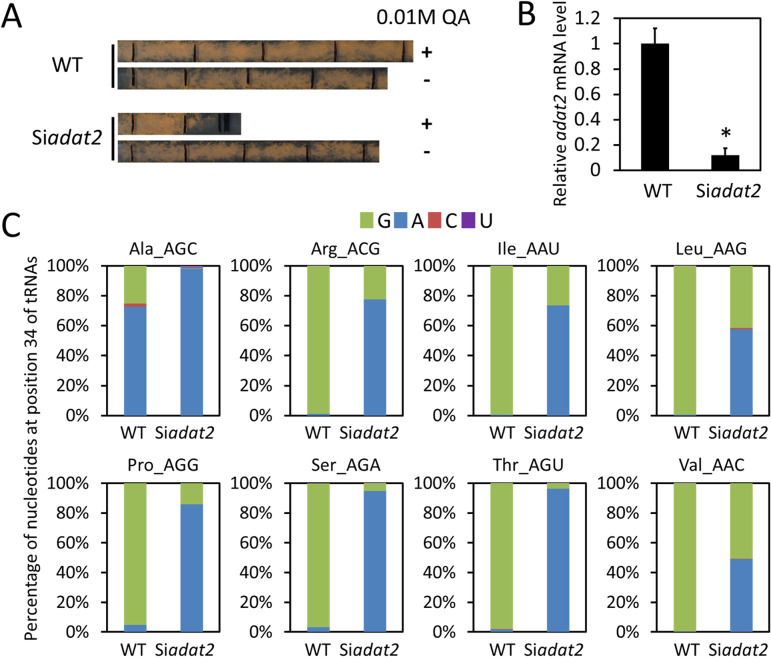
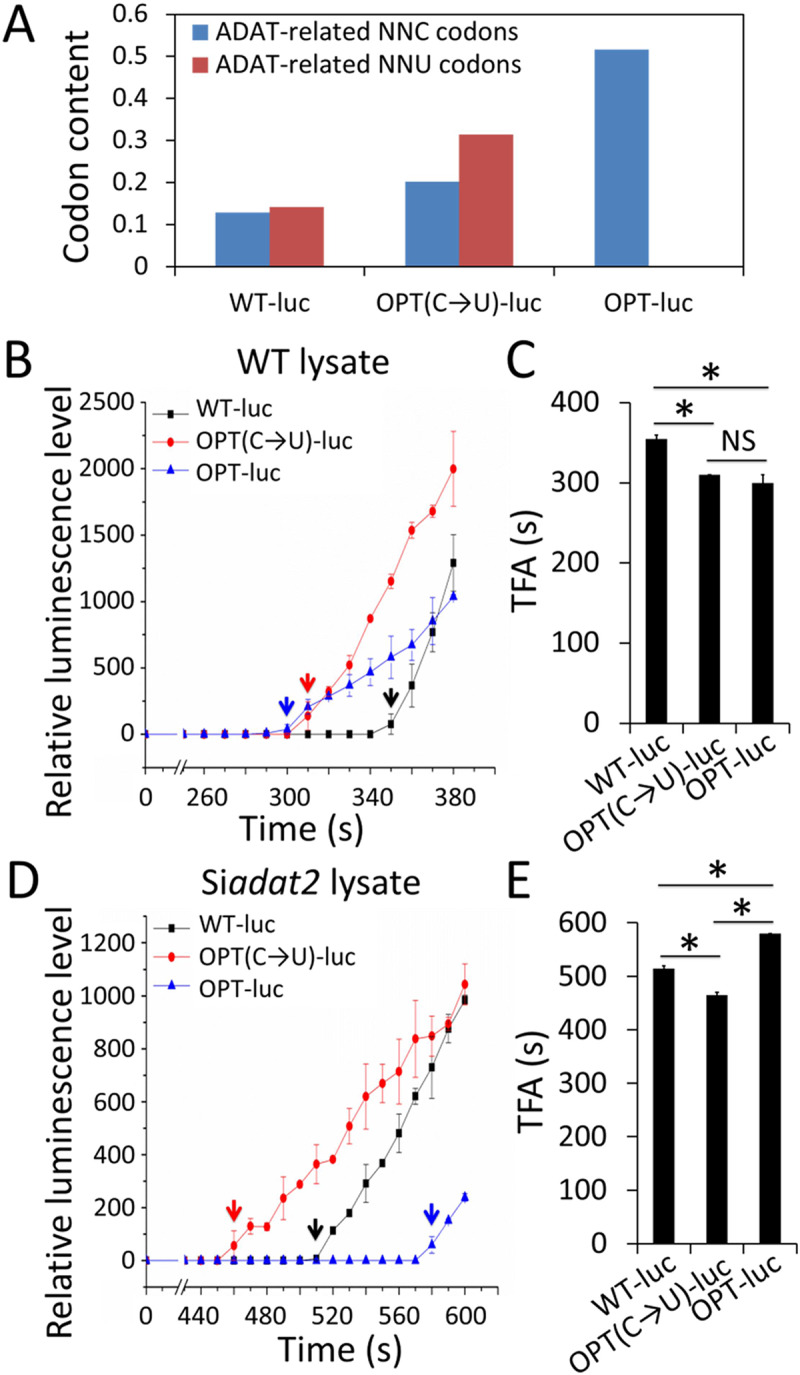
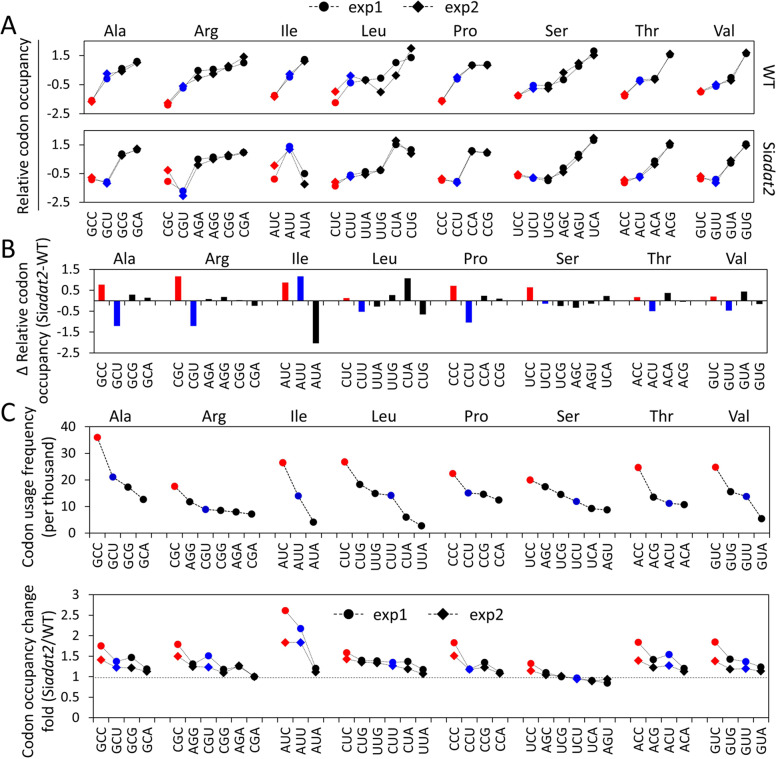
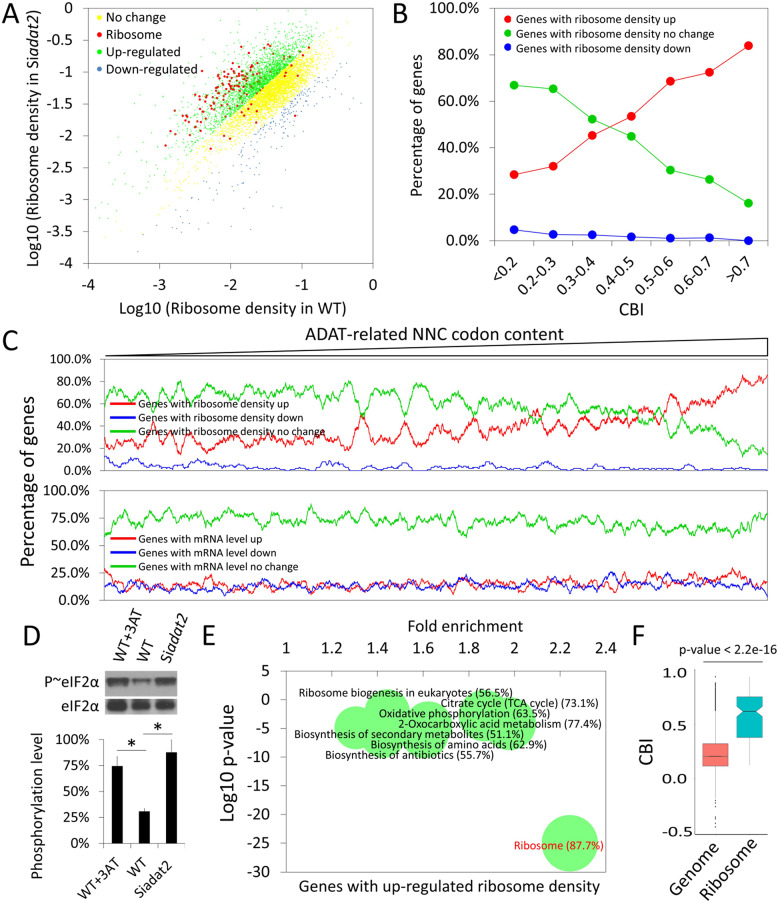
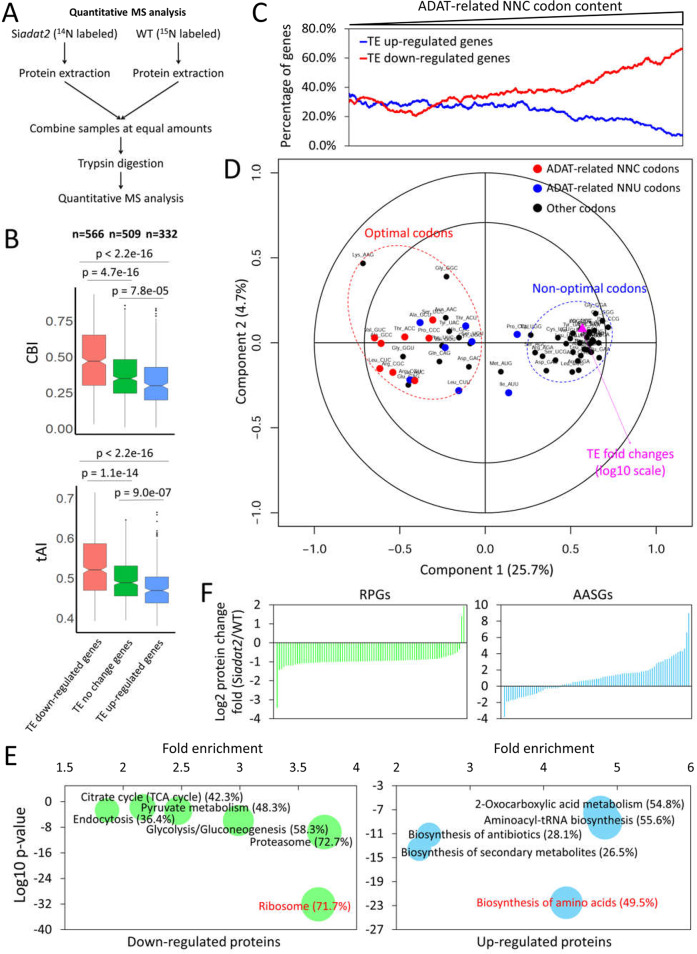
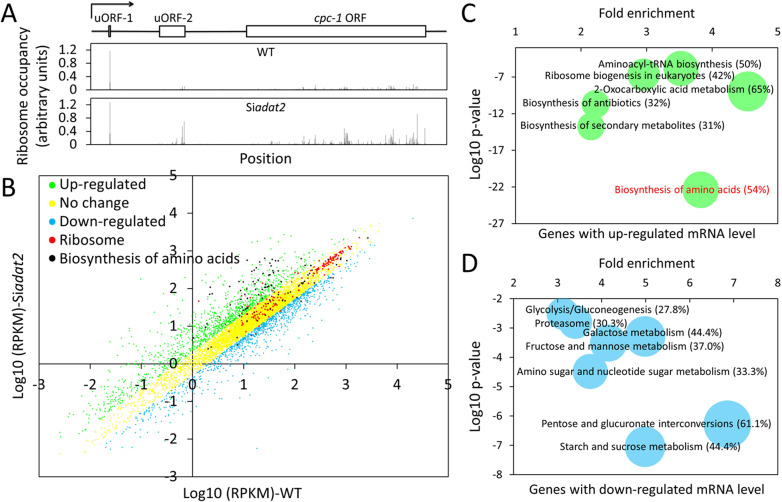
Codon usage bias is a universal feature of all genomes and plays an important role in regulating protein expression levels. Modification of adenosine to inosine at the tRNA anticodon wobble position (I34) by adenosine deaminases (ADATs) is observed in all eukaryotes and has been proposed to explain the correlation between codon usage and tRNA pool. However, how the tRNA pool is affected by I34 modification to influence codon usage-dependent gene expression is unclear. Using Neurospora crassa as a model system, by combining molecular, biochemical and bioinformatics analyses, we show that silencing of adat2 expression severely impaired the I34 modification levels for the ADAT-related tRNAs, resulting in major ADAT-related tRNA profile changes and reprogramming of translation elongation kinetics on ADAT-related codons. adat2 silencing also caused genome-wide codon usage-biased ribosome pausing on mRNAs and proteome landscape changes, leading to selective translational repression or induction of different mRNAs. The induced expression of CPC-1, the Neurospora ortholog of yeast GCN4p, mediates the transcriptional response after adat2 silencing and amino acid starvation. Together, our results demonstrate that the tRNA I34 modification by ADAT plays a major role in driving codon usage-biased translation to shape proteome landscape.


Conflict of interest statement

The authors have declared that no competing interests exist.

Figures

Fig 1
Fig 1. Relationship among tRNA-dependent adenosine deaminases, tRNA composition and codon usage frequency.
(A) The relative abundance of ADAT-related tRNA species in each tRNA family (left) and the corresponding relative codon usage frequency in each codon family (right) of 959 species from archaea, bacteria, and eukaryotes, respectively. The tRNA type is designated by its anticodon and encoded amino acid. The color code depicts the relative tRNA abundance (based on tRNA gene copy number in genomes) or the relative codon usage frequency in each family. (B) Histogram showing the Pearson’s correlation coefficient between tRNA content and genome-wide codon usage frequency in 96 eukaryotic organisms when I:C, I:U and G:U wobble events are taken into account. Major model organisms are indicated. tRNA content was calculated as the gene copy number of a specific tRNA gene divided by total tRNA gene number in each genome. (C) Scatter plot showing the correlation between tRNA gene copy number and codon usage frequency in N. crassa genome when I:C, I:U and G:U wobble events are taken into consideration. (D) Scatter plot showing the correlation between tRNA gene copy number and codon usage frequency in the N. crassa genome when tRNA I34 modification (I:C, I:U wobble events) was not considered. (E) Scatter plot showing the strong correlation between gene codon optimality measured by CBI values and ADAT-related NNC codon contents in N. crassa. R values in C, D and E represent respective Pearson’s correlation coefficient.
Fig 2
Fig 2. ADAT2 is required for the I34 modification of eight ADAT-related tRNA species.
(A) Race tube assay comparing the growth phenotypes of the WT and Siadat2 strains with/without QA. Each black line on the race tube marks the growth front every 24 hrs. (B) The relative adat2 mRNA levels detected by quantitative reverse transcription (qRT)-PCR in the WT and Siadat2 strains. The expression levels of adat2 were normalized to that of β-tubulin. The adat2 expression level in the WT strain was set as 1.0. Data are means ± SD. *, P < 0.05, as determined by Student's two-tailed t-test. (C) Bar charts showing the proportions of G, A, C, and U contents detected by tRNA sequencing at the position 34 of each tRNA in the WT and Siadat2 strains. Inosine is read as G by sequencing. The tRNA species with anticodons are indicated at the top of each bar chart.
Fig 3
Fig 3. Translation assays in vitro demonstrate that adat2 silencing alters codon optimality for translation elongation.
(A) Comparison of ADAT-related codon contents (NNC/NNU codon number divided by total codon number) of WT, OPT(C→T), and OPT Luc mRNAs. (B) Real-time measurement of luciferase activity from WT, OPT(C→T), and OPT Luc mRNAs in WT lysate. Reactions were performed at room temperature. Recorded relative light units (RLUs) were plotted versus translation reaction time in 10-s intervals. TFAs of the luminescence signal are indicated by arrows. (C) Statistical analysis of TFAs of the signals from the three Luc mRNAs in the WT cell lysate. (D) Real-time measurement of luciferase activity from the three Luc mRNAs in Siadat2 lysate in the experiments conducted as described in panel B. (E) Statistical analysis of TFAs of the signals from the three reporters in the Siadat2 cell lysate. Data are means ± SD. *, P < 0.05. NS, not significant, as determined by Student's two-tailed t-test. Compared with WT Luc, there are 360 codons were optimized in the OPT Luc; Compared with OPT Luc, there are 173 ADAT-related NNC codons were changed in OPT(C→T) Luc (S11 Fig).
Fig 4
Fig 4. Ribosome profiling demonstrated that adat2 silencing alters codon optimality in each codon family in vivo.
(A) The relative codon occupancies in each ADAT-related codon family in the WT and Siadat2 cells. Red and blue colors indicate ADAT-related NNC and NNT codons, respectively. The relative codon occupancy values in each codon family were normalized and centralized by z-score transformation. The results for two independent biological replicates are shown. (B) Changes of the relative codon occupancy (Δ relative codon occupancy) in each ADAT-related codon family in the Siadat2 relative to the WT cells. The ADAT-related eight NNC and NNT codons are marked as red and blue bars, respectively. Data for other codons are in black. Data are averages of two independent biological replicates. (C) Genome-wide codon usage frequency (numbers per thousand codons, upper panel) in N. crassa and codon occupancy change folds (lower panel) in ADAT-related codon families between the Siadat2 and WT cells. Data from two independent biological replicates are shown. The codon occupancy values are normalized to that of the most occupied codon (5’-CGA-3’, arginine).
Fig 5
Fig 5. Codon usage-biased ribosome pausing after adat2 silencing.
(A) A scattered plot showing the ribosome density of each gene in the WT strain versus the Siadat2. The genes with up-regulated, down-regulated, and unchanged ribosome density in the Siadat2 compared to the WT strain are indicated by green, blue, and yellow dots, respectively. RPGs are marked as red dots. (B) Line plot showing CBI values versus percentages of genes with up-regulated, down-regulated, and unchanged ribosome densities in the Siadat2 compared to the WT strain. (C) Upper panel: Percentage of genes with up-regulated ribosome density in the Siadat2 strain increased with the increase of the ADAT-related NNC codon contents. Lower panel: No correlation was observed between the mRNA level change and the ADAT-related NNC codon contents. The mRNA level of each gene was measured by their average RPKM values of two independent mRNA-seq experiments. All the detected genes were ranked by their ADAT-related NNC codon contents, a window containing 100 genes slides from low to high ADAT-related NNC codon contents. The red, blue and green curves represent the percentages of genes with up-regulated, down-regulated and non-changed ribosome density (upper panel) or mRNA level (lower panel) in each window, respectively. (D) Representative western blot for eIF2α and phosphorylated eIF2α in the lysates of the WT cells treated with 3-AT, the WT cells without any treatment, and the Siadat2 cells in the presence of QA. The phosphorylation levels were represented by the ratios of phosphorylated eIF2α normalized to eIF2α. The graph shows quantification of means ± SD (n = 3). *, P < 0.05, as determined by Student's two-tailed t-test. (E) Functional enrichment analysis of genes with up-regulated ribosome density in the Siadat2 compared to the WT strain. Genes with up-regulated ribosome density were used as the probe and the whole genome was used as background. Bubble sizes represent the percentages (% in parentheses) of enriched genes among total genes in each pathway. Representative functional categories from KEGG database are presented; for a complete list, see S1 Table. (F) Boxplot of CBI values of the whole genome and that of the RPGs. The p-value is determined by Welch’s two-tailed t-test.
Fig 6
Fig 6. adat2 silencing resulted in codon usage-biased proteome changes.
(A) A diagram depicting the experimental procedures for the quantitative MS analysis of protein level changes in the Siadat2 compared with the WT strain. (B) Boxplots of CBI (upper panel) and tAI values (lower panel) for genes whose TEs were up-regulated, down-regulated, and unchanged in the Siadat2 compared with the WT strain. n = gene numbers in corresponding groups. The p-value is determined by Welch’s two-tailed t-test. (C) Line plot showing the percentage of genes with up/down-regulated TEs in the Siadat2 strain as the ADAT-related NNC codon contents increase. These genes were ranked by their ADAT-related NNC codon contents and the percentages of genes were plotted in a sliding window (200 genes/window) from low to high ADAT-related NNC codon contents. (D) PLSR analysis of the effect of codon content on protein level changes. Genes with changed TE levels were used. The log10 (TE fold change) was used as the response (Y) and the 61 codon contents were used as the regressor (X). The model has 2 components, and includes leave-one-out (LOO) cross-validated predictions [93]. The outer and inner circles indicate 100% and 50% explained variance, respectively; 30.4% of observed variance can be explained by two latent components (ncomp = 3, component 1: 25.7%, component 2: 4.7%). The purple triangle represents the TE fold change. (E) Functional enrichment analysis of down-regulated (left) and up-regulated (right) proteins in the Siadat2 compared with the WT strain. Genes with up- and down-regulated protein levels were used as probes, respectively, and the whole genome was used as background. Bubble sizes represent the percentages (% in parentheses) of enriched genes among total genes in each pathway. Representative functional categories from KEGG database are presented; see S1 Table for a complete list. (F) Change fold of the protein levels of individual ribosomal proteins (left) and proteins involved in amino acid biosynthesis (right) in the Siadat2 strain compared with the WT strain.
Fig 7
Fig 7. Transcriptional responses upon adat2 silencing.
(A) The ribosome occupancy of cpc-1 in the WT and Siadat2 strains across the entire transcript. A schematic of the transcript is shown above the plots. The numbers of RPFs on each codon of cpc-1 transcript were normalized by the RPF library size and its mRNA level. (B) Comparison of the transcript expression profiles of the Siadat2 and WT strains. (C and D) Gene functional enrichment analysis based on the mRNA level changes for the up-regulated genes (C) and down-regulated genes (D). Genes with up- and down-regulated mRNA levels were used as probes respectively, and the whole genome was used as background. Bubble sizes represent the percentages (% in parentheses) of enriched genes among total genes in each pathway. Representative functional categories from KEGG database are presented; for a complete list, see S1 Table.

Similar articles

Cited by

References

    1. Phizicky EM, Hopper AK (2010) tRNA biology charges to the front. Genes Dev 24: 1832–1860. 10.1101/gad.1956510 - DOI - PMC - PubMed
    1. El Yacoubi B, Bailly M, de Crecy-Lagard V (2012) Biosynthesis and function of posttranscriptional modifications of transfer RNAs. Annu Rev Genet 46: 69–95. 10.1146/annurev-genet-110711-155641 - DOI - PubMed
    1. Torres AG, Batlle E, Ribas de Pouplana L (2014) Role of tRNA modifications in human diseases. Trends Mol Med 20: 306–314. 10.1016/j.molmed.2014.01.008 - DOI - PubMed
    1. Chan CT, Pang YL, Deng W, Babu IR, Dyavaiah M, et al. (2012) Reprogramming of tRNA modifications controls the oxidative stress response by codon-biased translation of proteins. Nat Commun 3: 937 10.1038/ncomms1938 - DOI - PMC - PubMed
    1. Chionh YH, McBee M, Babu IR, Hia F, Lin W, et al. (2016) tRNA-mediated codon-biased translation in mycobacterial hypoxic persistence. Nat Commun 7: 13302 10.1038/ncomms13302 - DOI - PMC - PubMed

Publication types