. 2020 Aug 3;219(8):e201907058.
doi: 10.1083/jcb.201907058.

Nucleobindin-1 regulates ECM degradation by promoting intra-Golgi trafficking of MMPs

Affiliations

Nucleobindin-1 regulates ECM degradation by promoting intra-Golgi trafficking of MMPs

Natalia Pacheco-Fernandez et al. J Cell Biol. .

Abstract

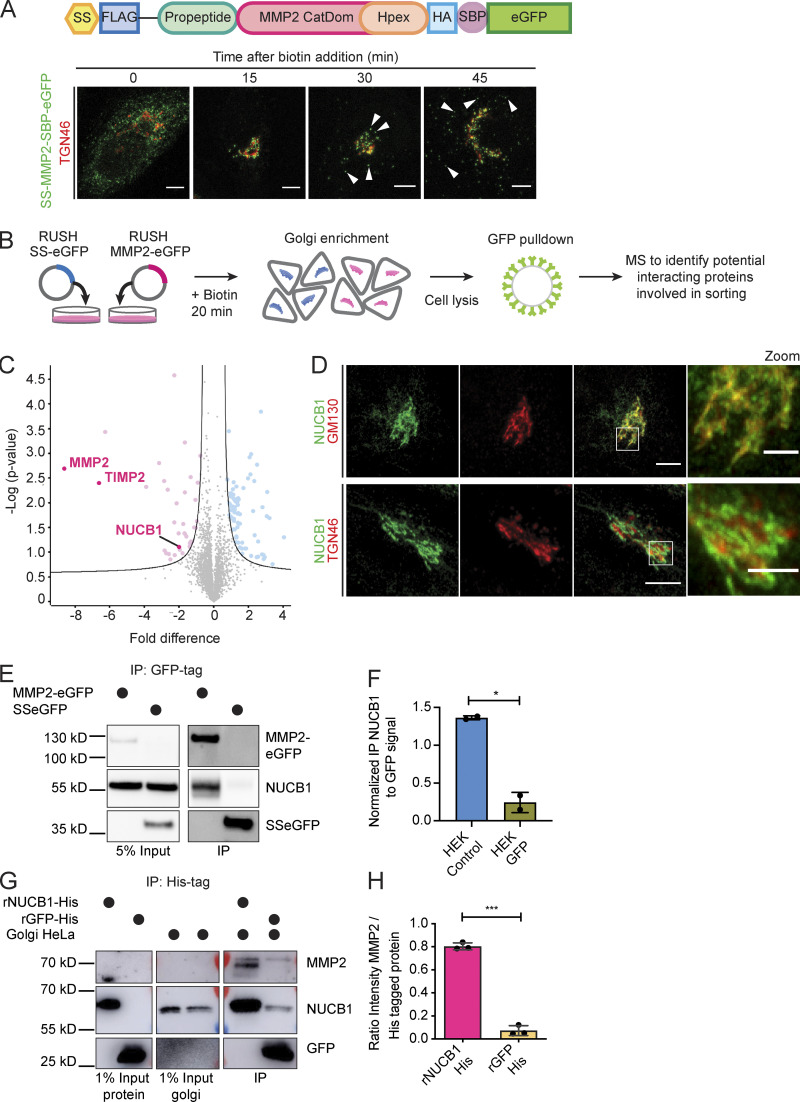
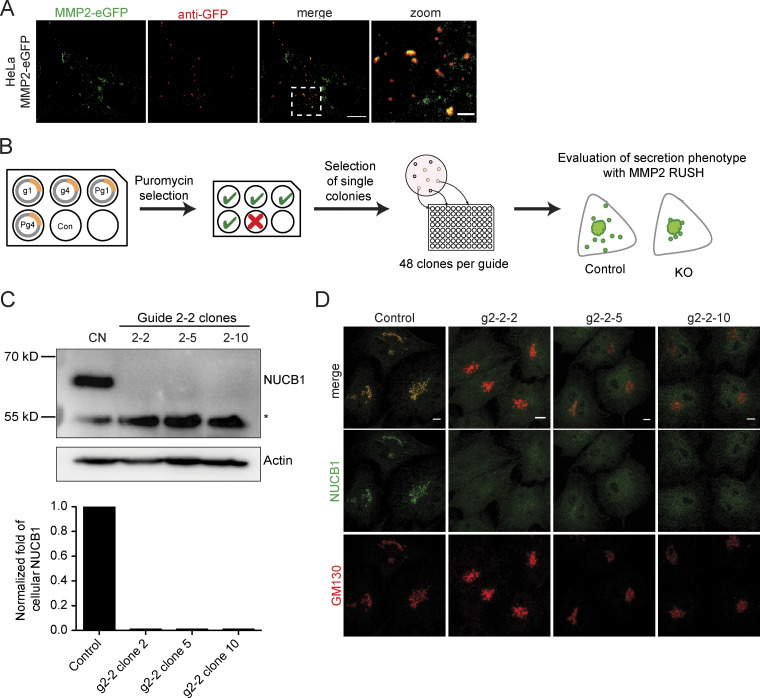
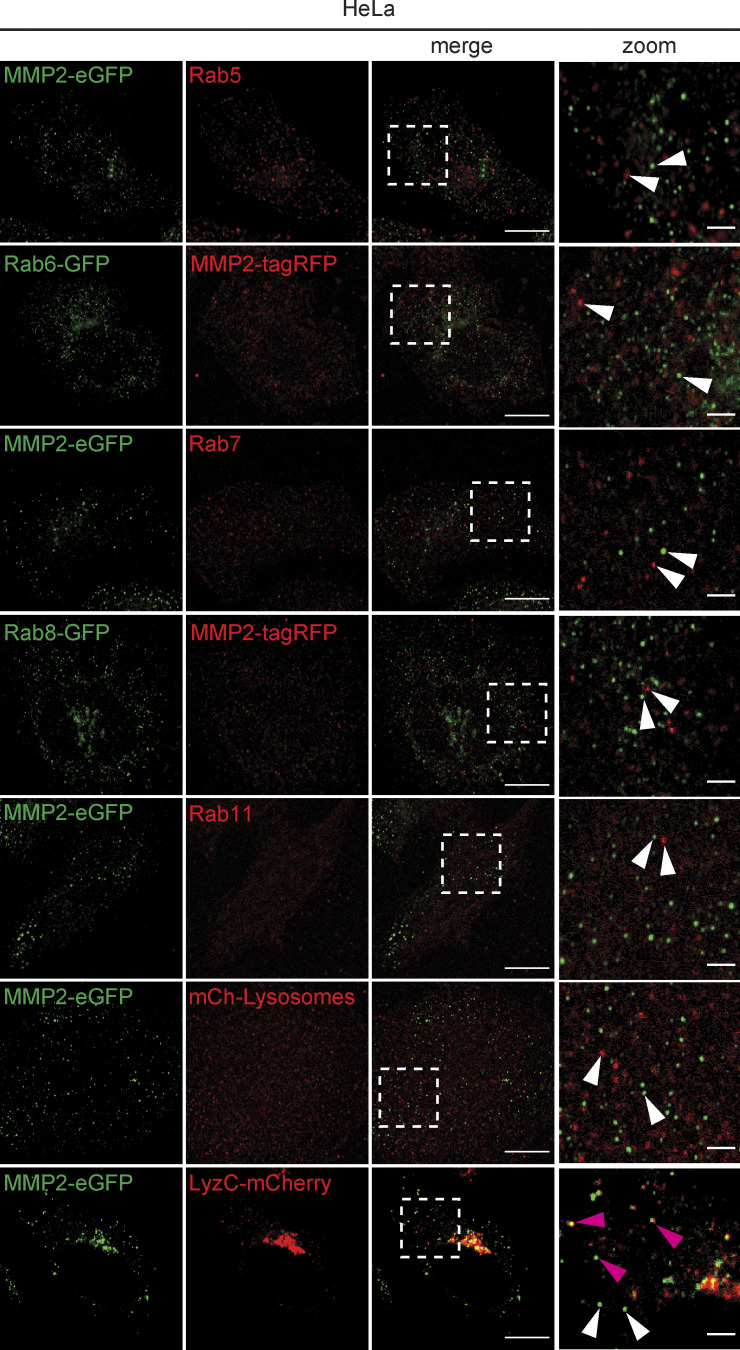
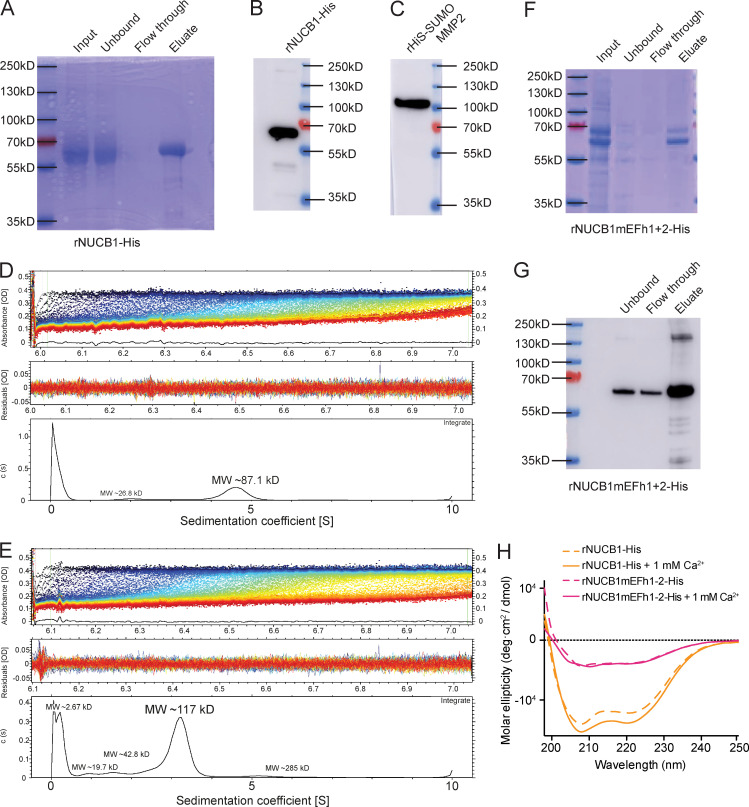
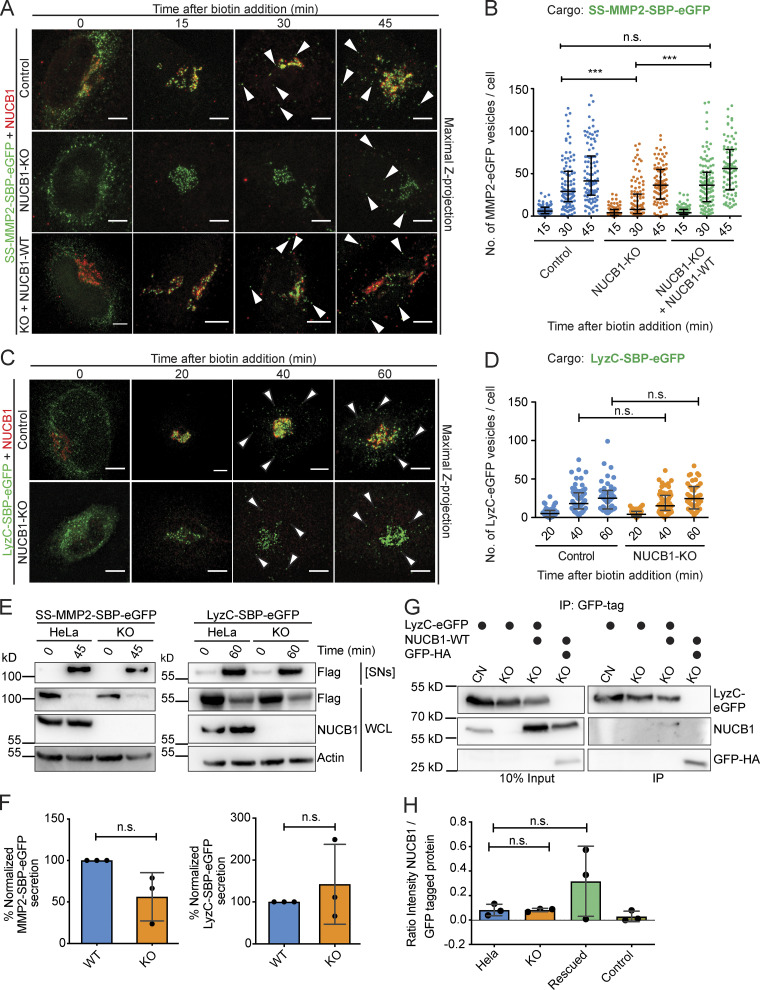
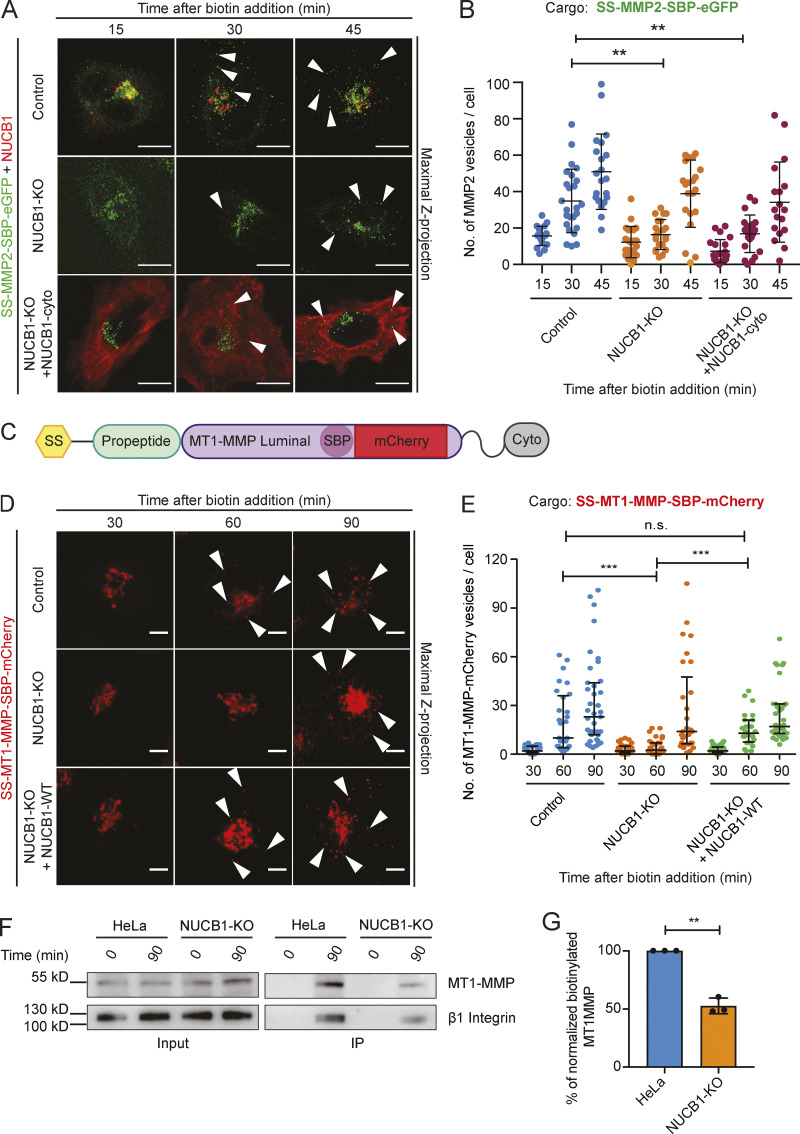
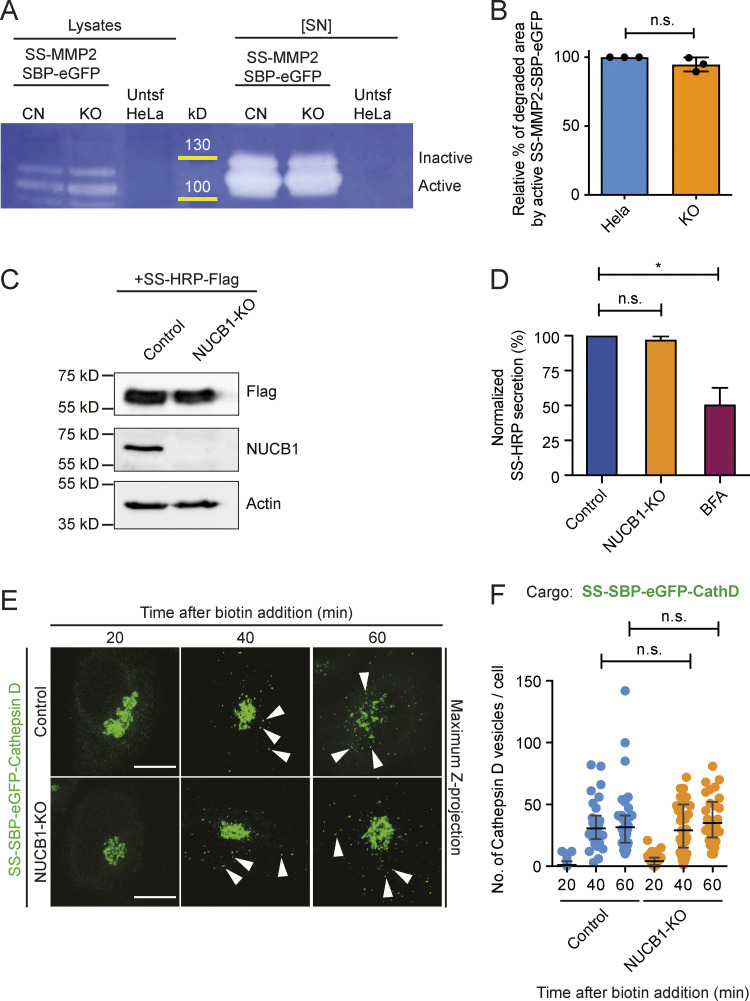
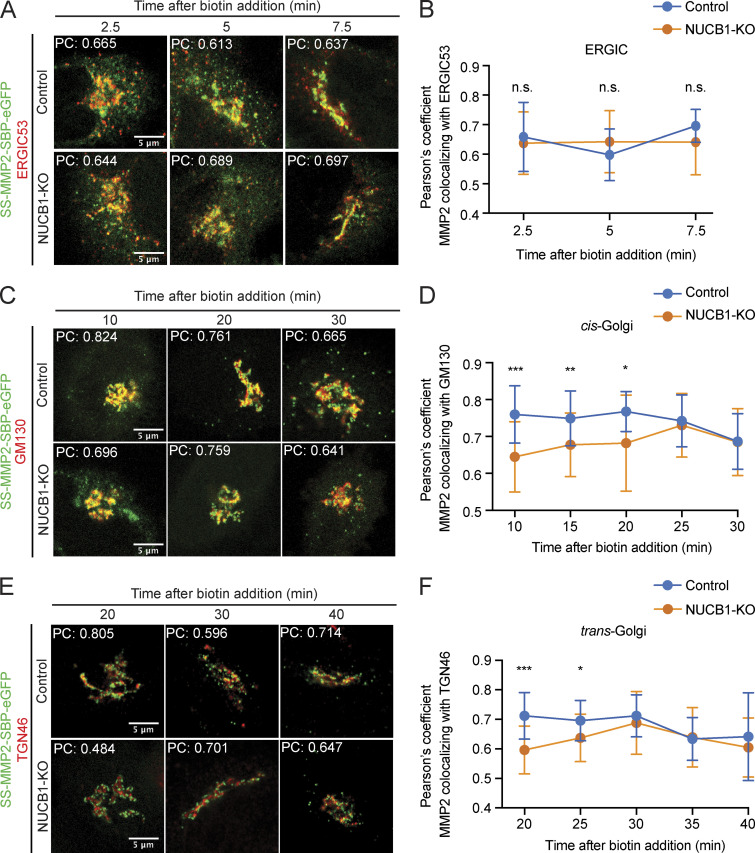
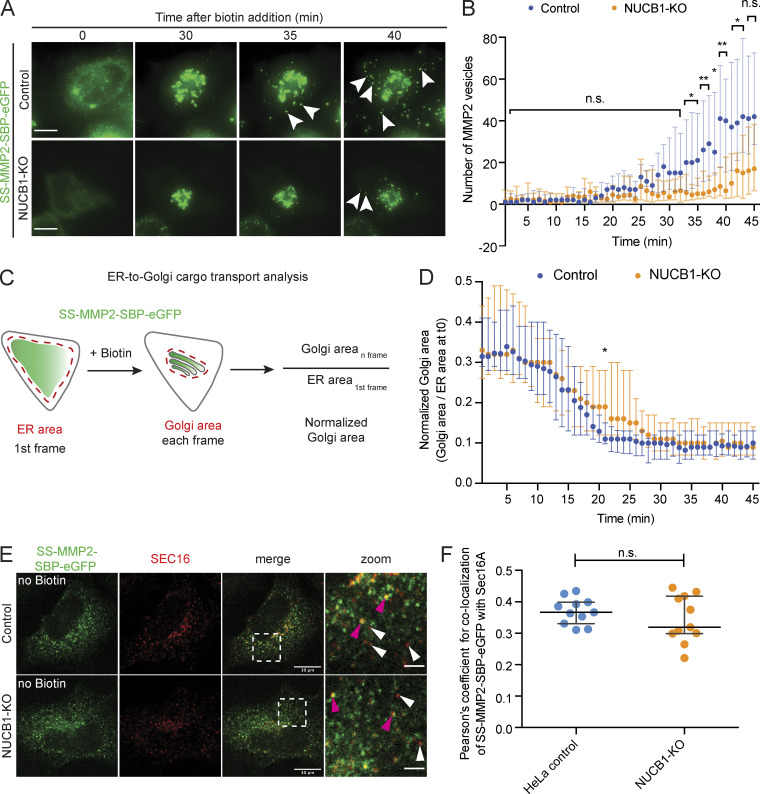
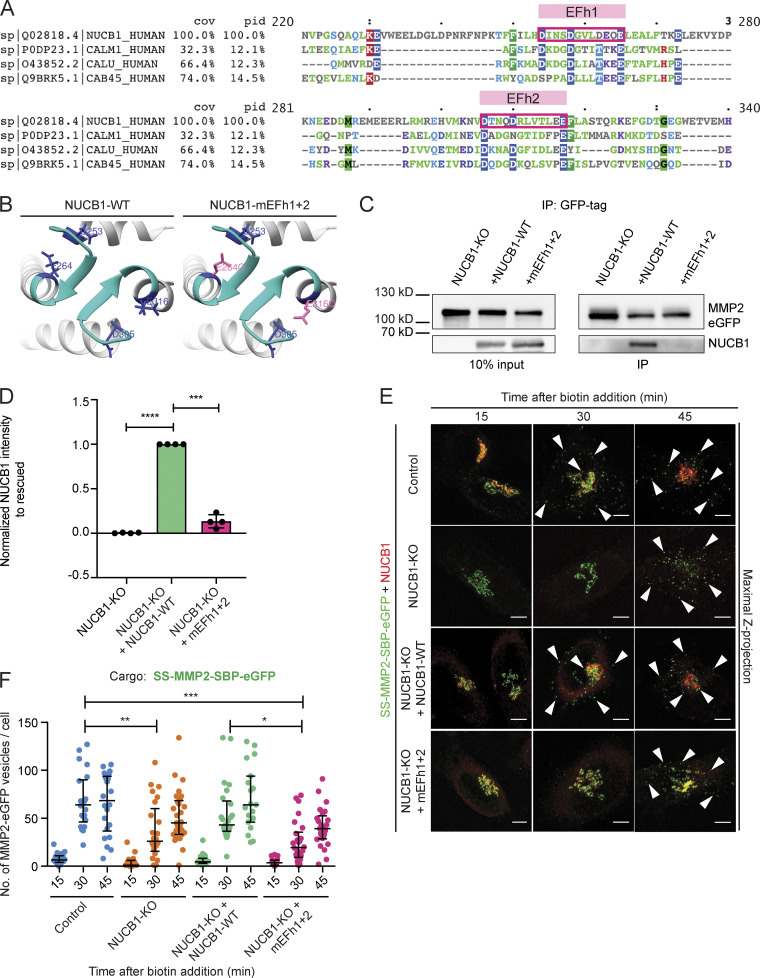
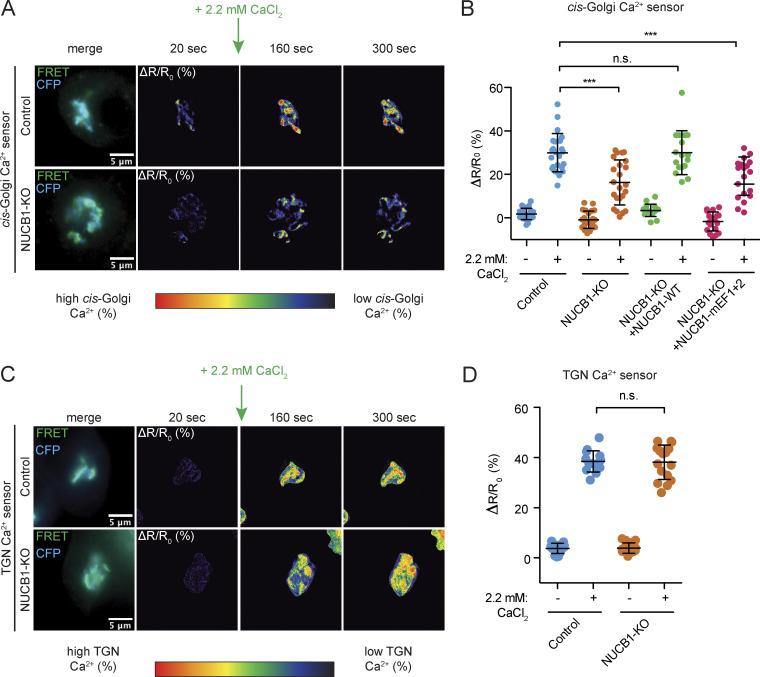
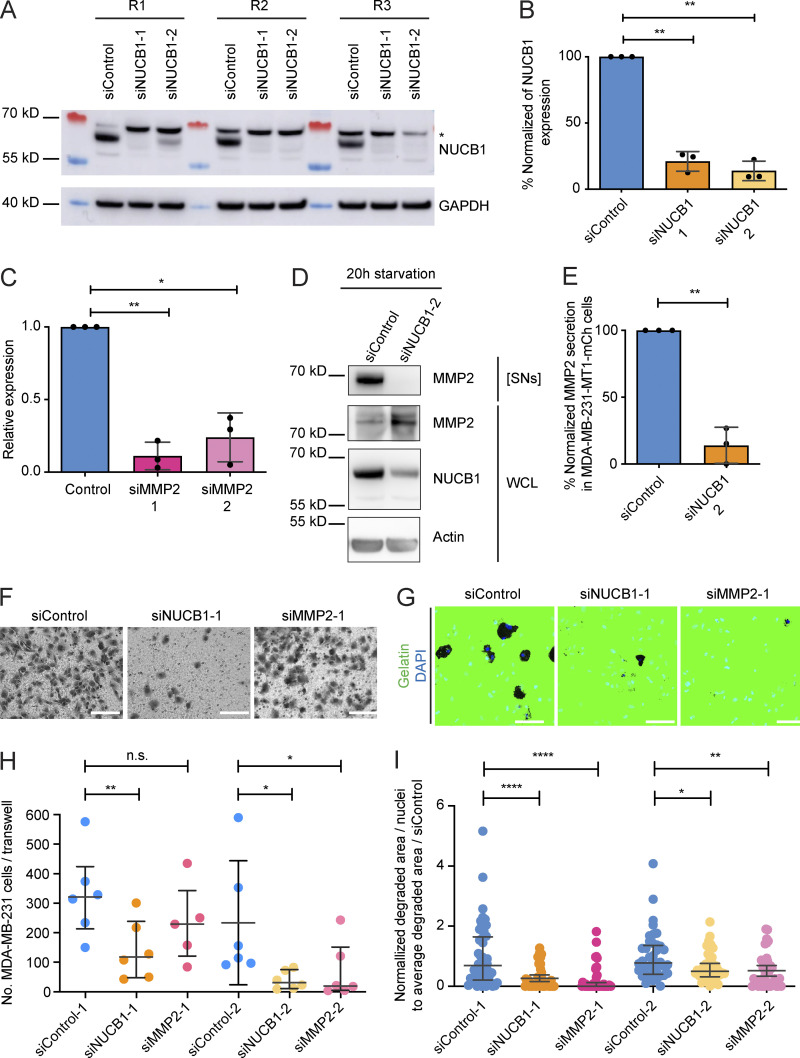
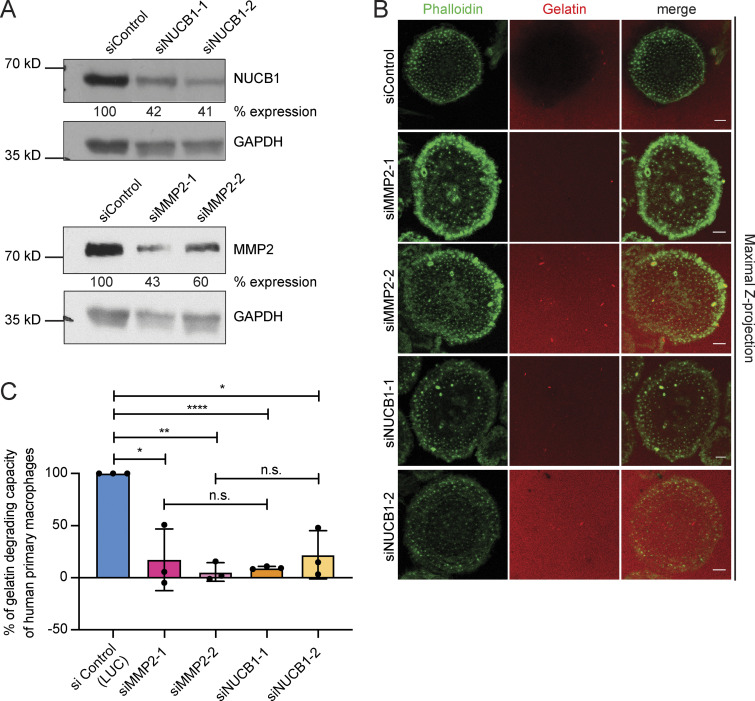
Matrix metalloproteinases (MMPs) degrade several ECM components and are crucial modulators of cell invasion and tissue organization. Although much has been reported about their function in remodeling ECM in health and disease, their trafficking across the Golgi apparatus remains poorly understood. Here we report that the cis-Golgi protein nucleobindin-1 (NUCB1) is critical for MMP2 and MT1-MMP trafficking along the Golgi apparatus. This process is Ca2+-dependent and is required for invasive MDA-MB-231 cell migration as well as for gelatin degradation in primary human macrophages. Our findings emphasize the importance of NUCB1 as an essential component of MMP transport and its overall impact on ECM remodeling.


Figures

Figure 1.
Figure 1.
Identification of candidates involved in the trafficking of MMP2. (A) Scheme of the MMP2 RUSH construct. SS-Flag-MMP2-HA-SBP-eGFP was used as a reporter. Fluorescence images show HeLa cells expressing MMP2-SBP-eGFP counterstained against TGN46 (red). Without biotin, MMP2 is retained in the ER (0 min). It reaches the Golgi 15 min after biotin addition and is sorted into vesicles (arrowheads) at 30 and 45 min, respectively. Scale bars, 5 µm. (B) MS strategy to identify MMP2 interacting partners in the Golgi. HeLa cells expressing MMP2-SBP-eGFP or SS-SBP-eGFP were incubated for 20 min with biotin to enrich reporter proteins at the Golgi. After GFP IP, samples were analyzed using MS (n = 3). (C) Volcano plot highlights significantly enriched MMP2 interactors in pink. 42 sorting-related candidates were found, among them TIMP2, a known inhibitor of MMP2, and NUCB1. Two-sample t test, false discovery rate = 0.3, minimum fold change = 0.5. (D) Fluorescence images of HeLa cells labeled with endogenous NUCB1 (green) and GM130 or TGN46 (red). Scale bars, 5 µm; zoom, 2 µm. (E) HEK 293T cells expressing SS-MMP2-SBP-eGFP or SS-SBP-eGFP were processed for GFP IP and WB analysis. (F) Semiquantitative analysis of the normalized NUCB1 to GFP signal from two independent experiments. Significance: one-sample t test. (G) His-tag coIP of recombinant rNUCB1-His. Endogenous MMP2 from HeLa Golgi membranes coimmunoprecipitated with rNUCB1-His but not rGFP-His. (H) Semiquantitative analysis of the MMP2 signal from three independent experiments. Bars, mean ± SD. Paired t test: *, P < 0.05; ***, P < 0.001.
Figure S1.
Figure S1.
MMP2-eGFP secretion and evaluation of CRISPR NUCB1-KO clones. (A) HeLa cells stably expressing SS-MMP2-eGFP were seeded on glass slides and incubated at 37°C for 3 d to evaluate MMP2-eGFP secretion. After fixation, cells were incubated with GFP antibody and Alexa Fluor 594. Confocal fluorescence images show colocalization of MMP2-eGFP and GFP antibody of nonpermeabilized cells, evidencing secretion of MMP2-eGFP to the extracellular space. Scale bars, 10 µm; zoom bar, 2 µm. (B and C) NUCB1-KO cells were generated using the CRISPR-Cas9 system with three different gRNAs and selection of single colonies. After puromycin selection, three NUCB1-KO clones were identified by WB (B) and later confirmed by immunofluorescence (C). *, unspecific band; KO, HeLa NUCB1-KO cells; CN, HeLa control. Semiquantitative analysis shows normalized NUCB1-to-β-actin signal.
Figure S2.
Figure S2.
MMP2 is partially sorted in LyzC-positive secretory vesicles. HeLa cells expressing MMP2-eGFP were immunolabeled with a-Rab5, a-Rab7, or Rab11 antibodies (red). MMP2-eGFP–expressing cells were cotransfected with mCherry (mCh)-lysosomes or LyzC-mCherry to label lysosomes or LyzC-positive secretory vesicles, respectively. Rab6-GFP or Rab8-GFP constructs were cotransfected with MMP2-tagRFP. Images were acquired by confocal microscopy. White arrowheads point to distinct vesicles; magenta arrowheads point to colocalizing vesicles. Bars, 10 µm; zoom, 2 µm.
Figure S3.
Figure S3.
Protein purification and evaluation of the direct interaction between MMP2 and NUCB1. (A) Coomassie-stained SDS-PAGE for the evaluation of His-tag purified recombinant NUCB1-His (rNUCB1-His). (B) Anti-NUCB1 WB analysis of the elution fraction shown in line 4 from A. (C) WB analysis of purified His-SUMO-MMP2 using MMP2 antibody. (D) Recombinant His-SUMO-MMP2 (rHS-MMP2) was bioconjugated with Cy3 via maleimide labeling and subsequently analyzed by AUC. The lowest panel shows peak of sedimentation of rHS-MMP2 at 4.705 S. (E) AUC profile of rHis-SUMO-MMP2-Cy3 and NUCB1-His. The lowest panel shows a peak at 3.189 S, indicating a change in the sedimentation velocity associated to a direct interaction of NUCB1 and MMP2. (F) Coomassie-stained SDS-PAGE of purified His-tagged NUCB1 Ca2+ binding mutant (rNUCB1mEFh1+2). (G) WB analysis of the elution fraction shown in line 4 of F using NUCB1 antibody. (H) CD measurement of rNUCB1-His and rNUCB1mEFh1+2-His under presence or absence of 1 mM Ca2+. rNUCB1-mEF1+2 molar ellipticity is lower compared with rNUCB1-His. Evaluation of the CD spectra using CONTIN (Wiech et al., 1996) showed an increase in rNUCB1-His α-helicity upon Ca2+ addition (from 0.385 to 0.413) that was not observed in rNUCB1-mEFh1+2 (from 0.256 to 0.147). Instead, an increase in β-sheet content (from 0.151 to 0.322) was observed. These findings are in accordance with the results described by de Alba and Tjandra (2004).
Figure 2.
Figure 2.
NUCB1-KO impairs the trafficking of MMP2. (A) Fluorescent images of HeLa or NUCB1-KO cells expressing SS-MMP2-SBP-eGFP with or without NUCB1-WT, counterstained against NUCB1 (red) and captured after 0, 15, 30, and 45 min of biotin incubation. Arrowheads, cytoplasmic vesicles. Scale bars, 5 µm. (B) Cytoplasmic vesicle counts as described in A are plotted as number of vesicles per cell (n ≥ 90 cells, median ± IQR of two independent experiments; ***, P < 0.001; n.s., not significant). (C) Confocal microscopy images of HeLa or NUCB1-KO cells expressing LyzC-SBP-eGFP and counterstained against NUCB1 (red) after 0, 20, 40, and 60 min of biotin incubation. Arrowheads, cytoplasmic vesicles. Scale bars, 5 µm. (D) Cytoplasmic vesicle counts from C of two independent experiments (n ≥ 42 cells, median ± IQR). (E) Secretion assay of HeLa or NUCB1-KO cells expressing SS-MMP2-SBP-eGFP or LyzC-SBP-EGFP and incubated with biotin for 45 or 60 min, respectively. WCL, whole-cell lysates. [SNs], 10×-concentrated supernatants. (F) Semiquantitative analysis from three independent experiments, one-sample t test. Bars, mean ± SD. (G) GFP-coIP of HeLa or NUCB1-KO cells expressing LyzC-eGFP, with or without NUCB1-WT. GFP-HA, negative control; CN, HeLa control; KO, NUCB1-KO. (H) Semiquantitative analysis of NUCB1 to GFP signal from three independent experiments. Bars, mean ± SD; paired t test.
Figure S4.
Figure S4.
MMP2 IG trafficking is exclusively dependent on Golgi-localized NUCB1, which also impairs IG trafficking of MT1-MMP. (A) HeLa or NUCB1-KO cells expressing SS-SBP-MMP2-eGFP alone or with a cytosolic variant of NUCB1 lacking its SS (NUCB1-cyto) were fixed after 0, 15, 30, and 45 min of biotin incubation. Maximal Z-projection analysis of confocal microscopy images shows no differences in MMP2 trafficking of NUCB1-cyto transfected cells compared with NUCB1-KO cells (arrowheads). Scale bars, 10 µm. (B) Quantification of cytoplasmic MMP2 vesicles from cells in A. n > 18 cells; mean ± SD; two independent experiments. Significant differences with P < 0.05 were analyzed via nonparametric Kruskal–Wallis test with Dunn’s multiple comparison, **, P < 0.01. (C) mCherry-tagged MT1-MMP RUSH construct (SS-MT1-MMP-SBP-mCh). Cyto, cytosolic domain. (D) Confocal fluorescence images of HeLa or NUCB1-KO cells transfected with or without NUCB1-WT and fixed after 30, 60, and 90 min of biotin incubation. Arrowheads, cytoplasmic vesicles. Scale bars, 5 µm. (E) Quantification of cytoplasmic vesicles observed in A. n = 24 cells; two independent experiments; median ± IQR; ***, P < 0.001; n.s., non-significant. (F) Cell surface biotinylation assay coupled with streptavidin pull-down. HeLa or NUCB1-KO cells were untreated (time 0) or incubated with sulfo-NHS-Biotin for 90 min to label cell surface proteins, and then pulled down with Neutravidin beads. WB analysis shows a reduction in the amount of endogenous active MT1-MMP at the surface of NUCB1-KO cells compared with HeLa control. β-1 integrin was used as loading control. (G) Semiquantitative analysis of surface labeled active MT1-MMP from F represented as % of normalized MT1-MMP intensity to β-1 integrin in comparison to control (100%). n = 3 independent experiments; one-sample t test, **, P < 0.01. Bars, mean ± SD.
Figure S5.
Figure S5.
NUCB1 does not affect MMP2 activation nor trafficking of other cargoes such as HRP and Cathepsin D. (A) Zymography assay of HeLa cells expressing SS-MMP2-SBP-eGFP. Untsf HeLa, Hela without transfection; [SN], 10×-concentrated supernatants; CN, HeLa control; KO, NUCB1-KO. (B) Semiquantitative analysis of experiment shown in A. n = 3 independent experiments; one-sample t test; n.s., nonsignificant. (C) Whole-cell lysates of HeLa and NUCB1-KO cells stably expressing SS-HRP-FLAG were analyzed by anti-FLAG, anti-NUCB1, and anti-β-actin WB. SS-HRP-FLAG is expressed in HeLa and NUCB1-KO cells to similar levels. (D) Cell culture supernatants of cells described in C were analyzed for HRP activity by chemiluminescence after 4-h secretion. BFA served as a positive control for perturbed secretion and was added for 1 h before HRP secretion analysis. No significant differences were observed between NUCB1-KO and HeLa control cells. *, P < 0.05. (E) HeLa or NUCB1-KO cells expressing SS-SBP-eGFP-Cathepsin D were fixed 20, 40, and 60 min after biotin addition. Representative maximum Z-projection images show Cathepsin D trafficking from Golgi to cytoplasmic vesicles (arrowheads). Scale bars, 10 µm. (F) Quantification of cytoplasmic Cathepsin D vesicles from cells shown in E. n > 30 HeLa and NUCB1-KO cells per time point; two independent experiments; mean ± SD. Statistical analysis was performed using a nonparametric Kruskal–Wallis test with Dunn’s multiple comparison test. No significant differences with P < 0.05 were detected.
Figure 3.
Figure 3.
MMP2 trafficking delay occurs at the cis-Golgi. (A) Fluorescence images of HeLa or NUCB1-KO cells transiently expressing SS-MMP2-SBP-eGFP, fixed at 2.5, 5, and 7.5 min after biotin addition, and counterstained against ERGIC53 (red). Scale bars, 5 µm. (B) Average PC per time point. (C) Colocalization of HeLa or NUCB1-KO cells expressing SS-MMP2-SBP-eGFP with GM130 (red) after 10, 15, 20, and 25 min of biotin incubation. Scale bars, 5 µm. (D) Average PC illustrates decreased colocalization at 10, 15, and 20 min after biotin addition. (E) Colocalization of SS-MMP2-SBP-eGFP with TGN46 (red) expressed in HeLa or NUCB1-KO cells at 20, 25, 30, 35, and 40 min after biotin addition. Scale bars, 5 µm. (F) Average PC shows that MMP2 is equally colocalizing with TGN46 in HeLa and NUCB1-KO cells upon arrival at the TGN. Error bars represent SD; *, P < 0.05; **, P < 0.01; ***, P < 0.001; n.s., not significant.
Figure 4.
Figure 4.
MMP2 trafficking is exclusively delayed at the Golgi in living cells. (A) HeLa or NUCB1-KO cells expressing SS-SBP-MMP2-eGFP were analyzed by live-cell wide-field microscopy. Representative images of MMP2 trafficking after 0, 30, 35, and 40 min of biotin incubation. Images were acquired in 1-min frames for each analyzed cell. Arrowheads, cytoplasmic MMP2 vesicles. Scale bars, 10 µm. (B) Quantification of cytoplasmic MMP2 vesicles per frame from cells shown in A. n.s., nonsignificant. *, P < 0.05; **, P < 0.01. (C) Schematic representation of ER–Golgi cargo transport analysis, measured as normalized Golgi area over time in cells shown in A. (D) Normalized Golgi area for each time point (median ± IQR). A reduced Golgi compaction was observed in the time range 15–23 min in NUCB1-KO cells compared with HeLa control. *, P < 0.05. (E and F) HeLa or NUCB1-KO cells (n = 11) expressing SS-SBP-MMP2-eGFP fixed without biotin addition and immunostained for ER exit site marker Sec16 (red). Scale bar, 10 µm; zoom, 2 µm. Retained MMP2 in the ER partially colocalized with Sec16 in both control and NUCB1-KO cells to the same extent (F). Magenta arrowheads, MMP2 structures that colocalized with ER exit sites; white arrowheads, ER exit sites. t test: P < 0.05.
Figure 5.
Figure 5.
NUCB1 EFhs are essential for Golgi trafficking of MMP2. (A) Protein alignment of human NUCB1 (Q02818, aa 241–400), CaM (P0DP23), Calumenin (O43852), and Cab45 (Q9BRK5). Pink boxes, NUCB1 EFhs. (B) NUCB1 adapted PDB protein model (accession no. 1SNL); NUCB1 EFhs, cyan; NUCB1-WT, EFhs with first and last amino acid of the domain in dark blue; NUCB1-mEFh1+2, amino acid substitutions E264Q and E316Q in pink. (C) CoIP of MMP2-eGFP transiently expressed in NUCB1-KO cells transfected with NUCB1-WT or NUCB1-mEFh1+2. n = 4 biological replicates. (D) Semiquantitative analysis of NUCB1 signal per sample normalized to the one of NUCB1-KO cells reexpressing NUCB1-WT. Bars, mean ± SD; one-sample t test. (E) Confocal fluorescence images of HeLa or NUCB1-KO cells expressing SS-MMP2-SBP-eGFP and cotransfected with or without NUCB1-WT or NUCB1-mEFh1+2. After 15, 30, and 45 min of biotin incubation, cells were fixed and costained with NUCB1 antibody (red). Scale bars, 5 µm. Arrowheads, cytoplasmic vesicles. (F) Quantification of cytoplasmic vesicles as in E from two independent experiments (median ± IQR), n ≥ 19 cells. *, P < 0.05; **, P < 0.01; ***, P < 0.001; ****, P < 0.0001.
Figure 6.
Figure 6.
NUCB1 EFhs are essential for Ca2+ homeostasis at the cis-Golgi. (A) Fluorescent images of HeLa or NUCB1-KO cells expressing the GPP130-Twitch5 cis-Golgi Ca2+ sensor. Cells were treated with ionomycin for 20 s to deplete endogenous Ca2+ in the Golgi lumen; 2.2 mM Ca2+ were added, and cells were monitored using life-cell ratiometric FRET microscopy. (B) Quantification of the cis-Golgi ΔR/R0 FRET ratio from A. (C) Pictures illustrate the same experiment described in A but using the Go-D1-cpv trans-Golgi Ca2+ sensor. (D) Quantification of the trans-Golgi ΔR/R0 FRET ratio from C. Quantification of ≥20 cells (median ± IQR) from at least two independent experiments. n.s., not significant; ***, P < 0.001.
Figure 7.
Figure 7.
NUCB1 depletion impairs ECM invasion and degradation in MDA-MB-231 cells. (A) Expression levels of NUCB1 after siRNA-mediated silencing (n = 3 independent experiments: R1, R2, and R3). *, unspecific band. (B) Semiquantitative analysis of normalized NUCB1 signal from A in silenced cells compared with control. Bars, mean ± SD. (C) Quantitative PCR analysis of relative MMP2 expression in siRNA-treated MDA-MB-231 cells (n = 3 independent experiments, one-sample t test). (D) Secretion assay of endogenous MMP2 in MDA-MB-231 cells. [SN], 20×-concentrated supernatant; WCL, whole cell lysates. (E) Semiquantitative analysis of three independent experiments. Bars, mean ± SD. Significance, one-sample t test. (F and G) Representative pictures of Matrigel-coated Transwell invasion (F) or gelatin degradation (G) experiments. Scale bars, 150 µm. (H and I) Quantification of the number of migrating cells (H) and degraded gelatin area (I). Both invasion and degradation were reduced in siNUCB1 cells. Data: median ± IQR; n = 3 independent experiments. Paired t test: *, P < 0.05; **, P < 0.01; n.s., not significant.
Figure 8.
Figure 8.
Matrix degradation is reduced in NUCB1-silenced human primary macrophages. (A) Validation of NUCB1 silencing. WB is representative of at least three independent experiments. %, relative expression compared with siControl. (B) Representative images of human-derived primary macrophages seeded on Rhodamine-conjugated gelatin and incubated for 6 h. Scale bars, 5 µm. n = 3 donors. (C) Quantification of gelatin degrading capacity of human primary macrophages. Bars, % of degraded gelatin compared with siControl. At least eight fields of view per condition were analyzed. Data: median ± IQR. One-sample t test: *, P < 0.05; **, P < 0.01; ***, P < 0.001; ****, P < 0.0001; n.s., not significant.

Similar articles

Cited by

References

    1. Alaseem A., Alhazzani K., Dondapati P., Alobid S., Bishayee A., and Rathinavelu A.. 2019. Matrix Metalloproteinases: A challenging paradigm of cancer management. Semin. Cancer Biol. 56:100–115. 10.1016/j.semcancer.2017.11.008 - DOI - PubMed
    1. Anilkumar N., Uekita T., Couchman J.R., Nagase H., Seiki M., and Itoh Y.. 2005. Palmitoylation at Cys574 is essential for MT1-MMP to promote cell migration. FASEB J. 19:1326–1328. 10.1096/fj.04-3651fje - DOI - PubMed
    1. Apte S.S., and Parks W.C.. 2015. Metalloproteinases: A parade of functions in matrix biology and an outlook for the future. Matrix Biol. 44–46:1–6. 10.1016/j.matbio.2015.04.005 - DOI - PubMed
    1. Aulestia F.J., Alonso M.T., and García-Sancho J.. 2015. Differential calcium handling by the cis and trans regions of the Golgi apparatus. Biochem. J. 466:455–465. 10.1042/BJ20141358 - DOI - PubMed
    1. Barlowe C.K., and Miller E.A.. 2013. Secretory protein biogenesis and traffic in the early secretory pathway. Genetics. 193:383–410. 10.1534/genetics.112.142810 - DOI - PMC - PubMed

Publication types

MeSH terms