. 2020 Jul 9;48(12):6699-6714.
doi: 10.1093/nar/gkaa457.

Studying RNA-DNA interactome by Red-C identifies noncoding RNAs associated with various chromatin types and reveals transcription dynamics

Affiliations

Studying RNA-DNA interactome by Red-C identifies noncoding RNAs associated with various chromatin types and reveals transcription dynamics

Alexey A Gavrilov et al. Nucleic Acids Res. .

Abstract

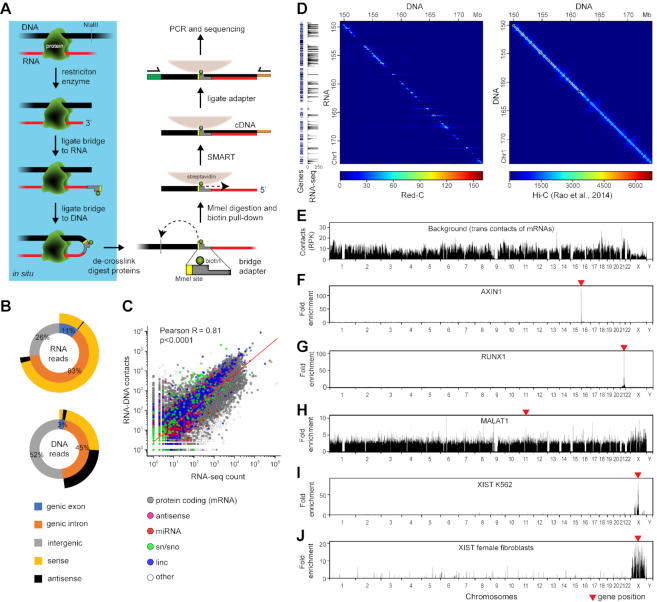
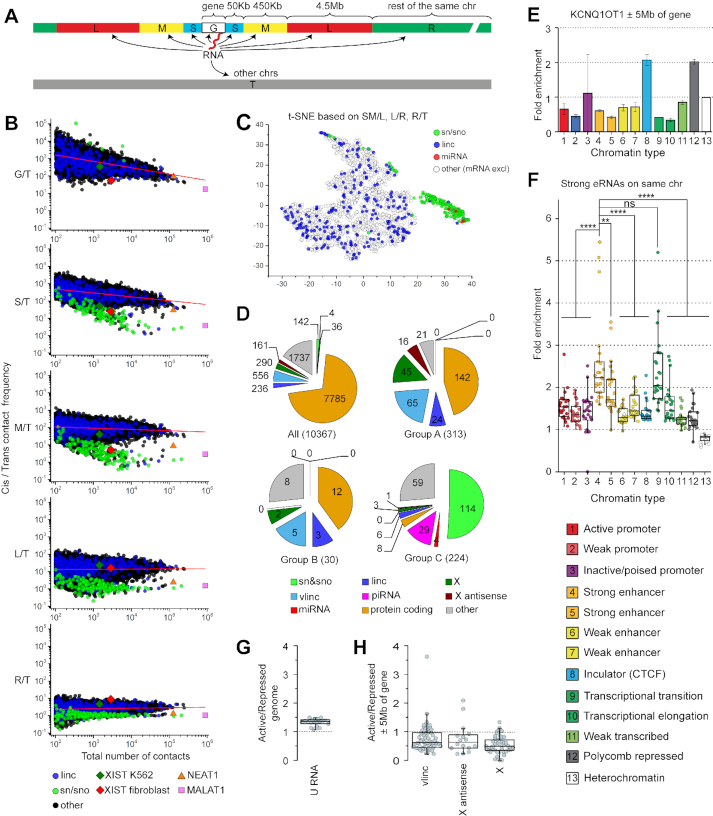
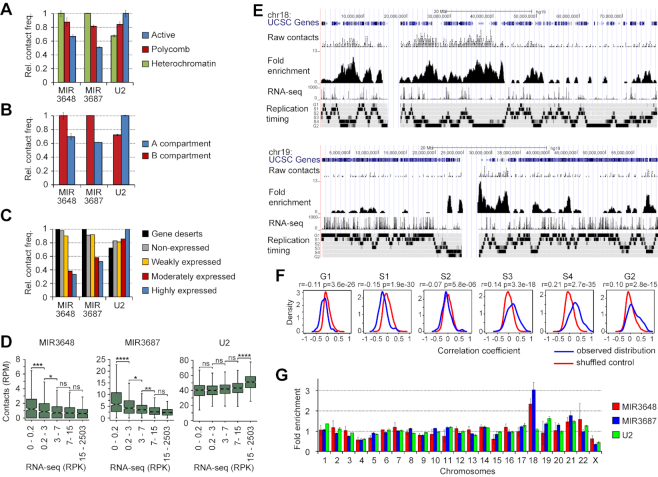
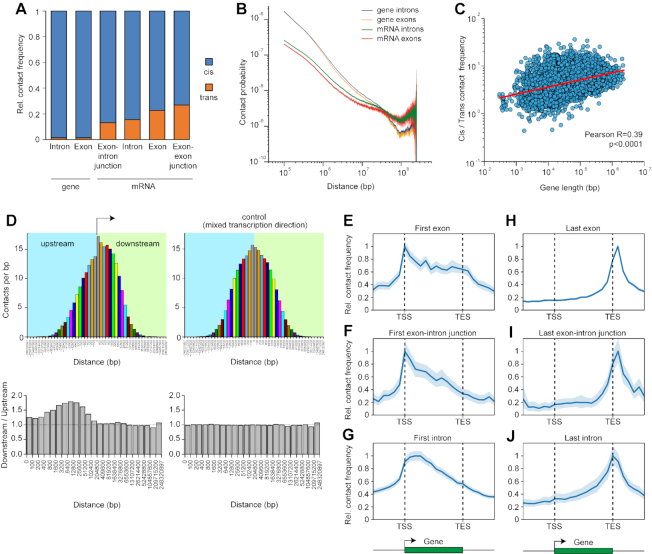
Non-coding RNAs (ncRNAs) participate in various biological processes, including regulating transcription and sustaining genome 3D organization. Here, we present a method termed Red-C that exploits proximity ligation to identify contacts with the genome for all RNA molecules present in the nucleus. Using Red-C, we uncovered the RNA-DNA interactome of human K562 cells and identified hundreds of ncRNAs enriched in active or repressed chromatin, including previously undescribed RNAs. Analysis of the RNA-DNA interactome also allowed us to trace the kinetics of messenger RNA production. Our data support the model of co-transcriptional intron splicing, but not the hypothesis of the circularization of actively transcribed genes.


Figures

Figure 1.
Figure 1.
The Red-C technique. (A) Outline of Red-C protocol. (B) Genomic distribution of DNA and RNA reads extracted from forward and reverse sequencing reads, respectively. As genic, we used RefSeq protein-coding genes that occupy 37% of the genome. Reads having the same direction as the transcript are defined as sense; reads having the opposite direction to the transcript are defined as antisense. (C) Correlation of RNA–DNA contacts with RNA-seq signal in K562 cells. Red line, linear regression. (D) RNA–DNA (Red-C) and DNA–DNA (K562 Hi-C (33)) contact matrices for a region of Chr 1 at a 100 kb resolution. RNA-seq profile for K562 (1 kb bins) and gene distribution are shown alongside. (E) Background profile in K562 cells. RPK, reads per kb. (F–J) Fold enrichment of selected RNAs compared to the background in K562 cells (F–I) and female fibroblasts (J). MALAT profile is at 1 kb resolution; the other profiles are at 100 kb resolution.
Figure 2.
Figure 2.
Preferences of RNAs for short- and long-range contacts and different chromatin types in K562 cells. (A) Scheme demonstrating analyzed genomic intervals. (B) Ratio of contact frequency of individual RNAs with regions of parental chromosome to contact frequency of the same RNAs with the other chromosomes (Y axis) versus total number of contacts (X axis). Graphs from top to bottom show results for different cis intervals as specified in (A). RNAs with ≥ 100 contacts are presented. Red line, linear regression. (C) T-SNE analysis of RNAs based on ratios between contact frequencies in consecutive intervals. (D) Number of RNAs of a particular biotype in group A (RNAs enriched in gene-proximal areas), group B (XIST-like RNAs), group C (RNAs distributed throughout the genome), and among all analyzed RNAs. (E) Fold enrichment of Kcnq1ot1 at specific chromatin types in the region surrounding Kcnq1ot1 gene (± 5 Mb of gene boundaries) relative to overall contact frequency in this region. Error bars, SEM for two biological replicates. (F) Fold enrichment of eRNAs produced from chromatin type 4 and 5 at specific chromatin types within the same chromosome relative to overall contact frequency in the same chromosome. Points represent results for individual chromosomes (n = 23, P-values are from Tukey's multiple comparisons test). (GH) Ratio between contact frequencies in active and repressed chromatin for U RNAs belonging to group C (G) and for vlinc, X RNAs, and antisense X RNAs belonging to group A (H). Active chromatin is defined as combination of types 1, 2, 4, 5, 6, 7, 9, 10 and 11; repressed chromatin, of types 3, 12 and 13. Contact frequency was determined for the full genome (G) or in regions ±5Mb of gene boundaries (H).
Figure 3.
Figure 3.
MIR3648 and MIR3687 target inactive chromatin. (A, B) Frequency of contacts of MIR3648, MIR3687, and U2 with different chromatin types (A) and A and B spatial compartments (B) determined for the full genome. The maximal contact frequency for a given RNA is taken to be equal to 1. Error bars, SEM for two biological replicates. Active chromatin is defined as combination of types 1, 2, 4, 5, 6, 7, 9, 10 and 11; Polycomb, of types 3 and 12; Heterochromatin, of type 13. A/B compartment track for K562 was obtained from (33). (C) Frequency of contacts of MIR3648, MIR3687 and U2 with expressed protein-coding genes (divided into three equal groups based on the density of RNA-seq signal), non-expressed protein-coding genes (RNA-seq signal = 0), and gene deserts (regions of >500 kb not occupied by any genes). For each RNA, the total number of contacts with genes of each group and gene deserts was determined, normalized by the total length of genes in the group and gene deserts, and presented relative to the maximal value for a given RNA (taken equal to 1). (D) Contacts of MIR3648, MIR3687, and U2 with 1 Mb genomic bins divided into five equal groups based on RNA-seq signal in the bin (n = 576, P-values are from Tukey's multiple comparisons test). Bins occupied by chromatin types 1–13 by less than 10% are not included in the analysis. RPK, reads per Kb; RPM, reads per Mb. (E) Distribution of raw contacts of MIR3687 along Chrs 18 and 19 and fold enrichment compared to background at a 50 kb resolution. Gene distribution, RNA-seq signal (1 kb bin), and replication timing profile for K562 as determined by Repli-seq (56) are shown. (F) Distribution of correlation coefficients upon comparison of MIR3687 fold enrichment profile with Repli-seq in genomic windows of 20 Mb, as examined by StereoGene (57). The genome-wide correlation coefficients calculated with the kernel and P-values are presented. (G) Fold enrichment of MIR3648, MIR3687 and U2 at individual chromosomes relative to overall contact frequency of respective RNAs in the genome. Error bars, SEM for two biological replicates.
Figure 4.
Figure 4.
Inter- and intra-chromosomal contacts of mRNAs. (A) Relative frequency of cis and trans contacts for different regions of mRNAs and protein-coding genes averaged for all chromosomes. See also Supplementary Figure S8. (B) Double logarithmic scaling plot of the dependence of contact probability on genomic distance for exons and introns of mRNAs and protein-coding genes. Colored area in the background of curves, 95% CI. (C) Correlation between length of protein-coding genes and ratio between frequencies of cis and trans contacts for mRNAs encoded by these genes. (D) Frequency of contacts of mRNA fragments with downstream and upstream intervals with (left) or without (right) respect to the direction of transcription. Pairs of bars of the same color represent results for equally spaced regions downstream and upstream of mRNA fragments. Shown below are the ratios of contact frequencies between equally spaced regions downstream and upstream of mRNA fragments. (E–J) Contacts of the different regions of mRNA with the body of the encoding gene and its flanking regions averaged over all mRNAs establishing at least one contact with the gene body or flanking areas (n = 11 122). The maximal value of the averaged profile is taken to be equal to 1. Colored area in the background of curves, 95% CI.

References

    1. Hangauer M.J., Carpenter S., McManus M.T.. Discovering the complexity of the metazoan transcriptome. Genome Biol. 2014; 15:112. - PMC - PubMed
    1. Kanehisa T., Tanaka T., Kano Y.. Low molecular RNA associated with chromatin: purification and characterization of RNA that stimulates RNA synthesis. Biochim. Biophys. Acta. 1972; 277:584–589. - PubMed
    1. Holmes D.S., Mayfield J.E., Sander G., Bonner J.. Chromosomal RNA: its properties. Science. 1972; 177:72–74. - PubMed
    1. Bynum J.W., Volkin E.. Chromatin-associated RNA: differential extraction and characterization. Biochim. Biophys. Acta. 1980; 607:304–318. - PubMed
    1. Nozawa R.S., Gilbert N.. RNA: nuclear glue for folding the genome. Trends Cell Biol. 2019; 29:201–211. - PubMed

Publication types