

The computation of case fatality rate for novel coronavirus (COVID-19) based on Bayes theorem: An observational study
- PMID: 32481256
- PMCID: PMC7249957
- DOI: 10.1097/MD.0000000000019925
The computation of case fatality rate for novel coronavirus (COVID-19) based on Bayes theorem: An observational study
Abstract
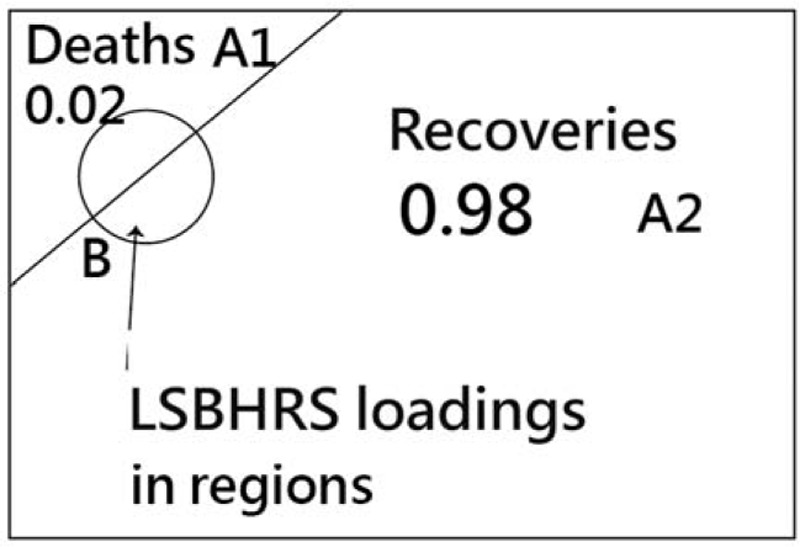
Background: When a new disease such starts to spread, the commonly asked questions are how deadly is it? and how many people are likely to die of this outbreak? The World Health Organization (WHO) announced in a press conference on January 29, 2020 that the death rate of COVID-19 was 2% on the case fatality rate (CFR). It was underestimated assuming no lag days from symptom onset to deaths while many CFR formulas have been proposed, the estimation on Bays theorem is worthy of interpretation. Hence, it is hypothesized that the over-loaded burdens of treating patients and capacities to contain the outbreak (LSBHRS) may increase the CFR.
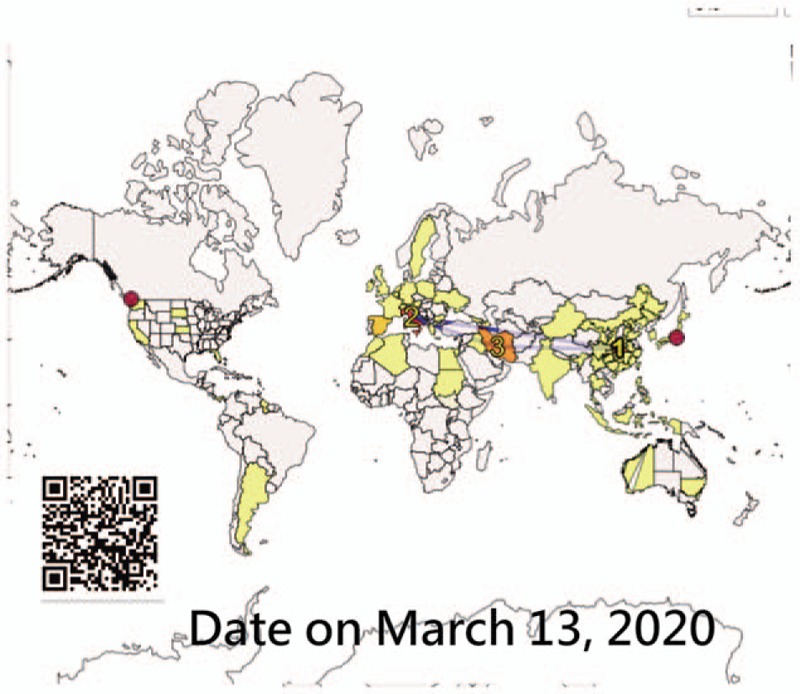
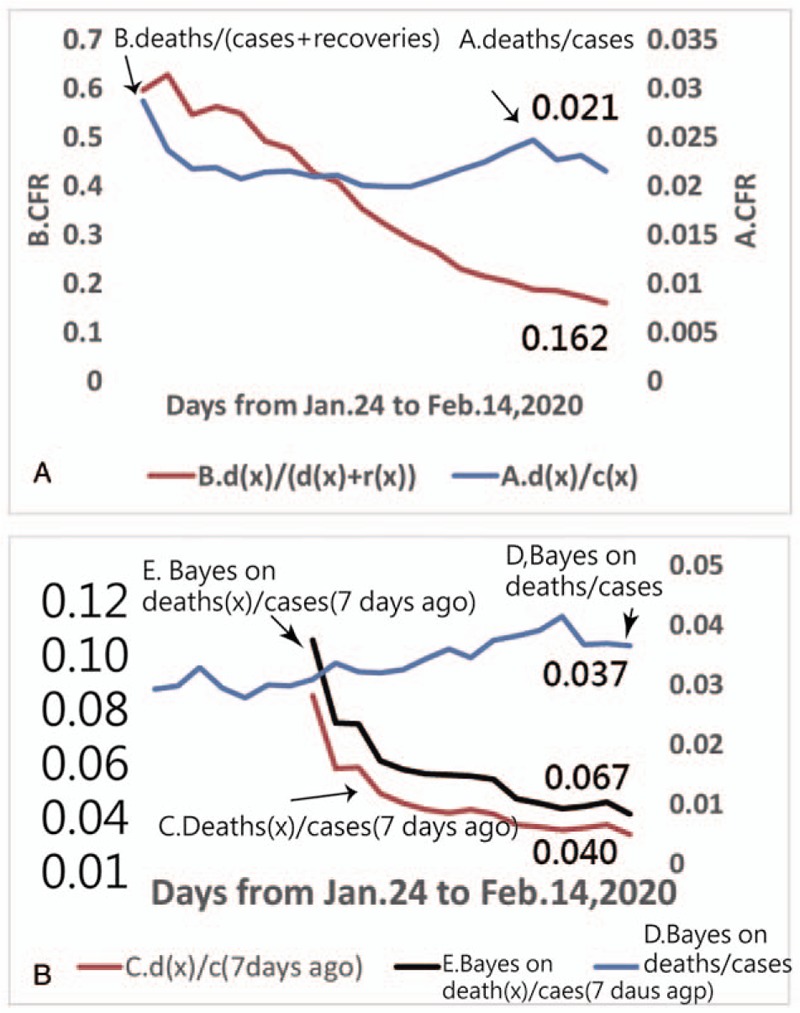
Methods: We downloaded COVID-19 outbreak numbers from January 21 to February 14, 2020, in countries/regions on a daily basis from Github that contains information on confirmed cases in >30 Chinese locations and other countries/regions. The pros and cons were compared among the 5 formula of CFR, including [A] deaths/confirmed; [B] deaths/(deaths + recovered); [C] deaths/(cases x days ago); [D] Bayes estimation based on [A] and the outbreak (LSBHRS) in each country/region; and [E] Bayes estimation based on [C] deaths/(cases x days ago). The coefficients of variance (CV = the ratio of the standard deviation to the mean) were applied to measure the relative variability for each CFR. A dashboard was developed for daily display of the CFR across each region.
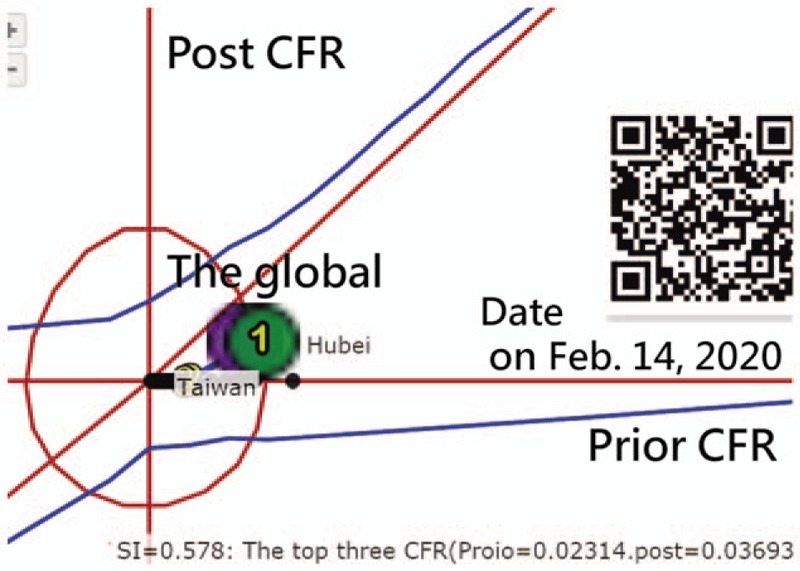
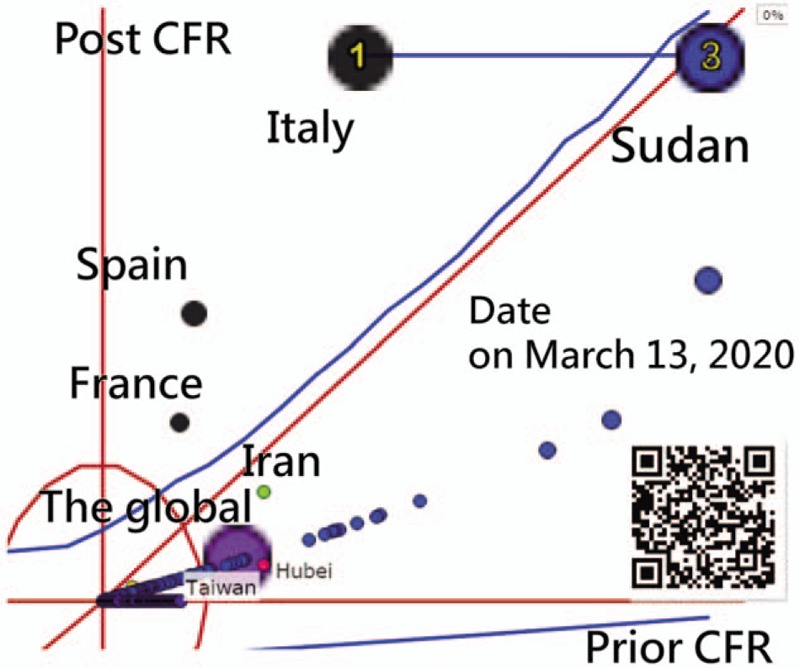
Results: The Bayes based on (A)[D] has the lowest CV (=0.10) followed by the deaths/confirmed (=0.11) [A], deaths/(deaths + recoveries) (=0.42) [B], Bayes based on (C) (=0.49) [E], and deaths/(cases x days ago) (=0.59) [C]. All final CFRs will be equal using the formula (from, A to E). A dashboard was developed for the daily reporting of the CFR. The CFR (3.7%) greater than the prior CFR of 2.2% was evident in LSBHRS, increasing the CFR. A dashboard was created to present the CFRs on COVID-19.
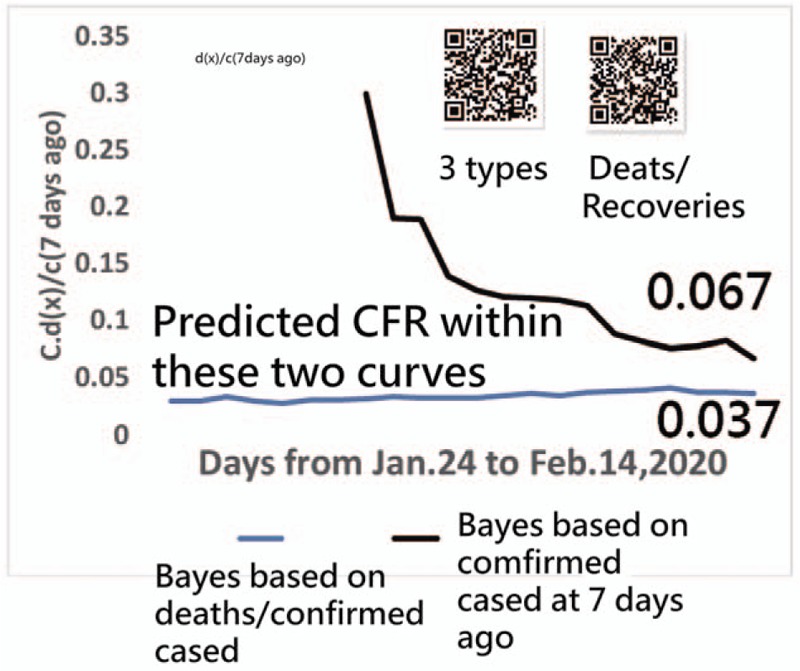
Conclusion: We suggest examining both trends of the Bayes based on both deaths/(cases 7 days ago) and deaths/confirmed cases as a reference to the final CFR. An app developed for displaying the provisional CFR with the 2 CFR trends can improve the underestimated CFR reported by WHO and media.
Conflict of interest statement
The authors have no conflicts of interest to disclose.
Figures
References
-
- JHC. Coronavirus disease 2019(COVOD-19) outbreak. Available at http://www.healthup.org.tw/kpiall/covid19dashboard.asp. Accessed April 14, 2020.
-
- Leszkiewicz A. Coronavirus disease 2019(COVOD-19) outbreak. Available at http://www.healthup.org.tw/kpiall/covid19dashboard2.asp. Accessed April 14, 2020.
-
- Suwantarat N, Apisarnthanarak A. Risks to healthcare workers with emerging diseases: lessons from MERS-CoV, Ebola, SARS, and avian flu. Curr Opin Infect Dis 2015;28:349–61. - PubMed
Publication types
MeSH terms
LinkOut - more resources
Full Text Sources
Miscellaneous
