Lipid Raft Destabilization Impairs Mouse TRPA1 Responses to Cold and Bacterial Lipopolysaccharides
- PMID: 32481567
- PMCID: PMC7312353
- DOI: 10.3390/ijms21113826
Lipid Raft Destabilization Impairs Mouse TRPA1 Responses to Cold and Bacterial Lipopolysaccharides
Abstract
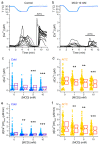
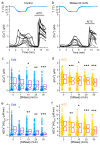
The Transient Receptor Potential ankyrin 1 cation channel (TRPA1) is expressed in nociceptive sensory neurons and epithelial cells, where it plays key roles in the detection of noxious stimuli. Recent reports showed that mouse TRPA1 (mTRPA1) localizes in lipid rafts and that its sensitivity to electrophilic and non-electrophilic agonists is reduced by cholesterol depletion from the plasma membrane. Since effects of manipulating membrane cholesterol levels on other TRP channels are known to vary across different stimuli we here tested whether the disruption of lipid rafts also affects mTRPA1 activation by cold or bacterial lipopolysaccharides (LPS). Cooling to 12 °C, E. coli LPS and allyl isothiocyanate (AITC) induced robust Ca2+ responses in CHO-K1 cells stably transfected with mTRPA1. The amplitudes of the responses to these stimuli were significantly lower in cells treated with the cholesterol scavenger methyl β-cyclodextrin (MCD) or with the sphingolipids hydrolyzer sphingomyelinase (SMase). This effect was more prominent with higher concentrations of the raft destabilizers. Our data also indicate that reduction of cholesterol does not alter the expression of mTRPA1 in the plasma membrane in the CHO-K1 stable expression system, and that the most salient effect is that on the channel gating. Our findings further indicate that the function of mTRPA1 is regulated by the local lipid environment and suggest that targeting lipid-TRPA1 interactions may be a strategy for the treatment of pain and neurogenic inflammation.
Keywords: LPS; cholesterol; cold; lipid rafts; mouse TRPA1; sphingolipids.
Conflict of interest statement
The authors declare no conflict of interest.
Figures


Similar articles
-
Evidence for the role of lipid rafts and sphingomyelin in Ca2+-gating of Transient Receptor Potential channels in trigeminal sensory neurons and peripheral nerve terminals.Pharmacol Res. 2015 Oct;100:101-16. doi: 10.1016/j.phrs.2015.07.028. Epub 2015 Jul 31. Pharmacol Res. 2015. PMID: 26238178
-
Mouse TRPA1 function and membrane localization are modulated by direct interactions with cholesterol.Elife. 2019 Jun 11;8:e46084. doi: 10.7554/eLife.46084. Elife. 2019. PMID: 31184584 Free PMC article.
-
Resolvin D1 and D2 Inhibit Transient Receptor Potential Vanilloid 1 and Ankyrin 1 Ion Channel Activation on Sensory Neurons via Lipid Raft Modification.Int J Mol Sci. 2020 Jul 16;21(14):5019. doi: 10.3390/ijms21145019. Int J Mol Sci. 2020. PMID: 32708653 Free PMC article.
-
Mammalian Transient Receptor Potential TRPA1 Channels: From Structure to Disease.Physiol Rev. 2020 Apr 1;100(2):725-803. doi: 10.1152/physrev.00005.2019. Epub 2019 Oct 31. Physiol Rev. 2020. PMID: 31670612 Review.
-
Regulation of vascular tone by transient receptor potential ankyrin 1 channels.Curr Top Membr. 2020;85:119-150. doi: 10.1016/bs.ctm.2020.01.009. Epub 2020 Feb 29. Curr Top Membr. 2020. PMID: 32402637 Free PMC article. Review.
Cited by
-
The Agonist Action of Alkylphenols on TRPA1 Relates to Their Effects on Membrane Lipid Order: Implications for TRPA1-Mediated Chemosensation.Int J Mol Sci. 2021 Mar 25;22(7):3368. doi: 10.3390/ijms22073368. Int J Mol Sci. 2021. PMID: 33806007 Free PMC article.
-
Temperature-Dependent Activation of Thermosensitive Transient Receptor Potential Channels.Adv Exp Med Biol. 2024;1461:47-59. doi: 10.1007/978-981-97-4584-5_4. Adv Exp Med Biol. 2024. PMID: 39289273 Review.
-
Vitamin D receptor (VDR) on the cell membrane of mouse macrophages participates in the formation of lipopolysaccharide tolerance: mVDR is related to the effect of artesunate to reverse LPS tolerance.Cell Commun Signal. 2023 May 29;21(1):124. doi: 10.1186/s12964-023-01137-w. Cell Commun Signal. 2023. PMID: 37248534 Free PMC article.
-
Cyclodextrin derivatives decrease Transient Receptor Potential vanilloid 1 and Ankyrin 1 ion channel activation via altering the surrounding membrane microenvironment by cholesterol depletion.Front Cell Dev Biol. 2024 Feb 28;12:1334130. doi: 10.3389/fcell.2024.1334130. eCollection 2024. Front Cell Dev Biol. 2024. PMID: 38481530 Free PMC article.
-
Cyclodextrins inhibit TRPV1 and TRPA1 activation-induced nociception via cholesterol depletion.J Lipid Res. 2025 Jul;66(7):100844. doi: 10.1016/j.jlr.2025.100844. Epub 2025 Jun 16. J Lipid Res. 2025. PMID: 40532876 Free PMC article.
References
MeSH terms
Substances
Grants and funding
LinkOut - more resources
Full Text Sources
Miscellaneous

