. 2020 May 28;25(11):2522.
doi: 10.3390/molecules25112522.

Detecting Low Concentrations of Nitrogen-Based Adulterants in Whey Protein Powder Using Benchtop and Handheld NIR Spectrometers and the Feasibility of Scanning through Plastic Bag

Affiliations

Detecting Low Concentrations of Nitrogen-Based Adulterants in Whey Protein Powder Using Benchtop and Handheld NIR Spectrometers and the Feasibility of Scanning through Plastic Bag

John-Lewis Zinia Zaukuu et al. Molecules. .

Abstract

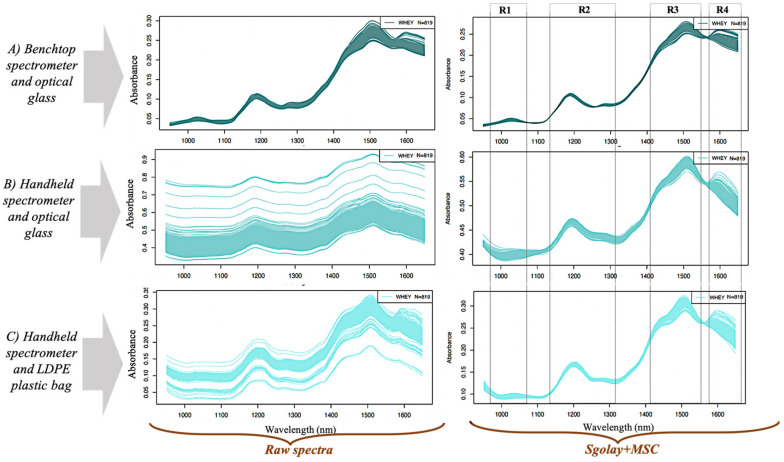
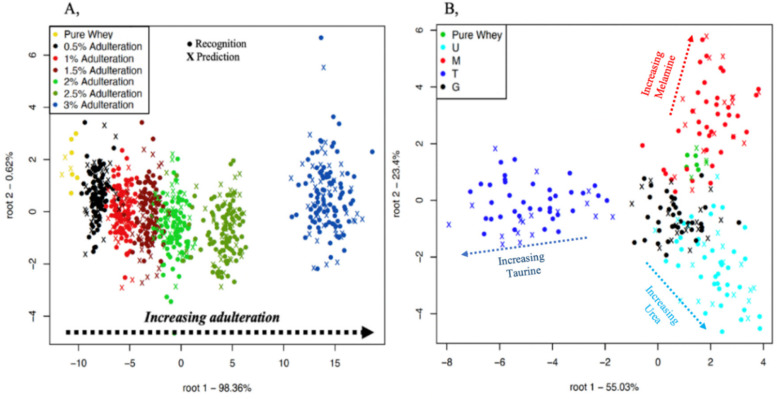
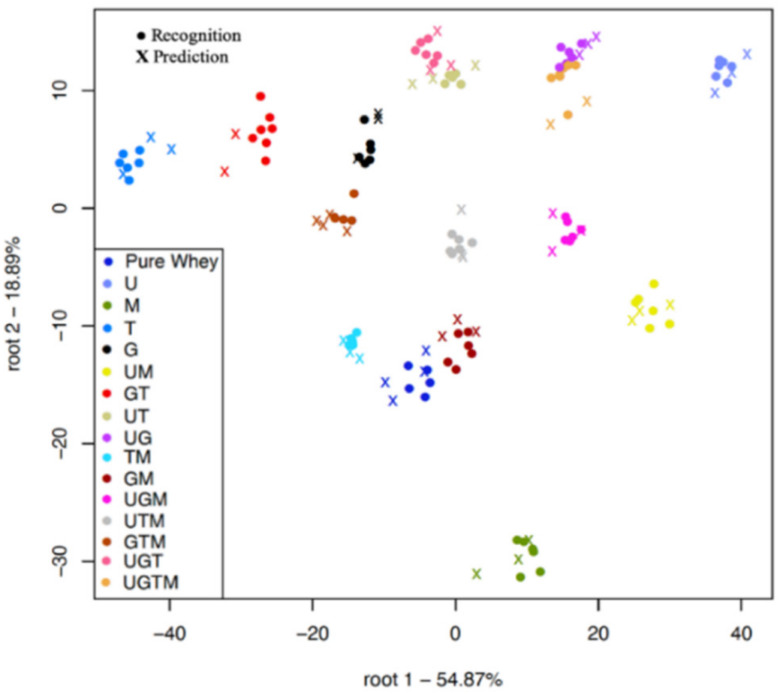
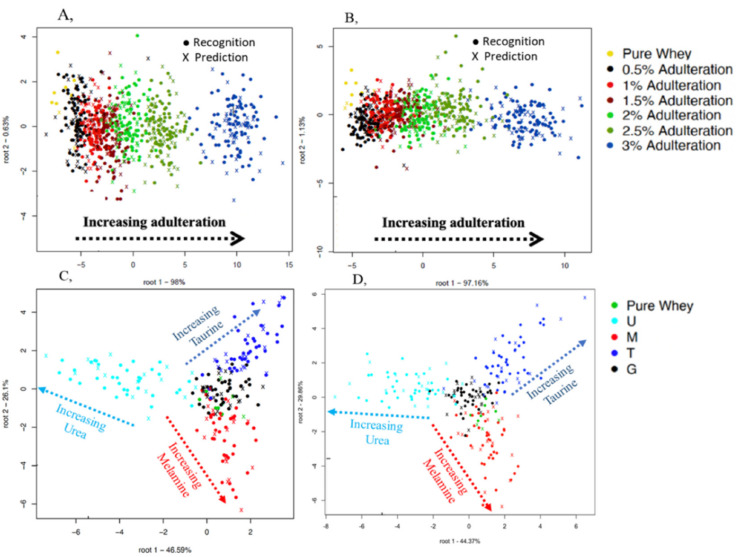
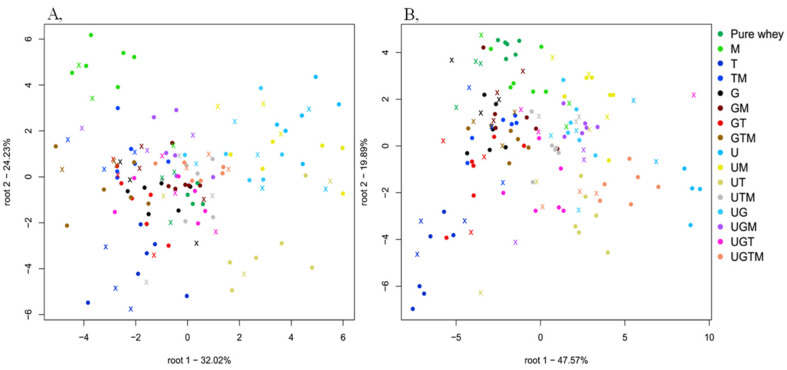
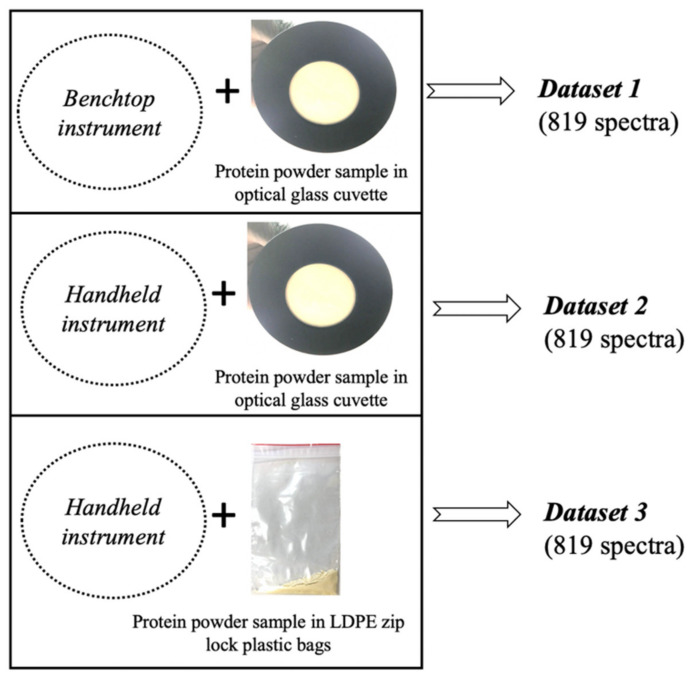
Nitrogen-rich adulterants in protein powders present sensitivity challenges to conventional combustion methods of protein determination which can be overcome by near Infrared spectroscopy (NIRS). NIRS is a rapid analytical method with high sensitivity and non-invasive advantages. This study developed robust models using benchtop and handheld spectrometers to predict low concentrations of urea, glycine, taurine, and melamine in whey protein powder (WPP). Effectiveness of scanning samples through optical glass and polyethylene bags was also tested for the handheld NIRS. WPP was adulterated up to six concentration levels from 0.5% to 3% w/w. The two spectrometers were used to obtain three datasets of 819 diffuse reflectance spectra each that were pretreated before linear discriminant analysis (LDA) and regression (PLSR). Pretreatment was effective and revealed important absorption bands that could be correlated with the chemical properties of the mixtures. Benchtop NIR spectrometer showed the best results in LDA and PLSR but handheld NIR spectrometers showed comparatively good results. There were high prediction accuracies and low errors attesting to the robustness of the developed PLSR models using independent test set validation. Both the plastic bag and optical glass gave good results with accuracies depending on the adulterant of interest and can be used for field applications.

Keywords: benchtop; chemometrics; commercial LDPE plastic bag; fingerprinting; handheld; near-infrared; protein-supplements; spectroscopy optical-glass.


Conflict of interest statement

The authors declare no conflict of interest.

Figures

Figure 1
Figure 1
Raw and pretreated diffuse reflectance absorbance spectra plots of pure and adulterated whey protein powder samples scanned with the benchtop spectrometer and handheld spectrometer at the wavelength range of 950–1650 nm.
Figure 2
Figure 2
Classification plots of the benchtop spectrometer for adulterant concentration levels (A) using the entire dataset and single mixture combinations (B) using the data of samples containing single adulterants and pure whey protein powder. U = urea, G = glycine, T = taurine, M = melamine. Spectral pre-processing: Savitzky-Golay smoothing (second order polynomial).
Figure 3
Figure 3
Classification plot of the benchtop spectrometer for the 15-mixture combination using the data of samples with the lowest adulteration level of 0.5% w/w and the pure whey protein powder. U = urea, G = glycine, T = taurine, M = melamine. Spectral pre-processing: Savitzky-Golay smoothing (second order polynomial).
Figure 4
Figure 4
Classification plots of the handheld spectrometer for adulterant concentration levels ((A), optical glass, and (B) commercial low density polyethylene (LDPE) plastic bag) using the entire dataset and single mixture combinations ((C), optical glass, and (D), commercial LDPE plastic bag) using the data of samples containing single adulterants and pure whey protein powder. U = urea, G = glycine, T = taurine, M = melamine. Spectral pre-processing: Savitzky-Golay smoothing and multiplicative scatter correction (MSC).
Figure 5
Figure 5
Classification plots of handheld spectrometer for the 15-mixture combination ((A) optical glass, and (B) commercial LDPE plastic bag) using the data of samples with the lowest adulteration level of 0.5% w/w and the pure whey protein powder. U = urea, G = glycine, T = taurine, M = melamine. Spectral pre-processing: Savitzky-Golay smoothing and multiplicative scatter correction (MSC).
Figure 6
Figure 6
Methods for spectral acquisition of adulterated whey protein powder using the bench top and handheld instrument through a glass window and plastic surface.

References

    1. Wu G. Dietary protein intake and human health. Food Funct. 2016;7:1251–1265. doi: 10.1039/C5FO01530H. - DOI - PubMed
    1. Ramos O.L., Pereira R.N., Rodrigues R.M., Teixeira J.A., Vicente A.A., Malcata F.X. Whey and Whey Powders: Production and Uses. 1st ed. Elsevier Ltd.; Amsterdam, The Netherlands: 2015.
    1. Lu W., Liu J., Gao B., Lv X., Yu L. Technical note: Nontargeted detection of adulterated plant proteins in raw milk by UPLC-quadrupole time-of-flight mass spectrometric proteomics combined with chemometrics. J. Dairy Sci. 2017;100:6980–6986. doi: 10.3168/jds.2017-12574. - DOI - PubMed
    1. Mæhre H.K., Dalheim L., Edvinsen G.K., Elvevoll E.O., Jensen I.J. Protein determination—Method matters. Foods. 2018;7:5 - PMC - PubMed
    1. Koletzko B., Shamir R. Standards for infant formula milk. Br. Med. J. 2006;332:621–622. doi: 10.1136/bmj.332.7542.621. - DOI - PMC - PubMed

LinkOut - more resources