. 2020 Jun 2:9:e55745.
doi: 10.7554/eLife.55745.

Lysosome activity is modulated by multiple longevity pathways and is important for lifespan extension in C. elegans

Affiliations

Lysosome activity is modulated by multiple longevity pathways and is important for lifespan extension in C. elegans

Yanan Sun et al. Elife. .

Abstract

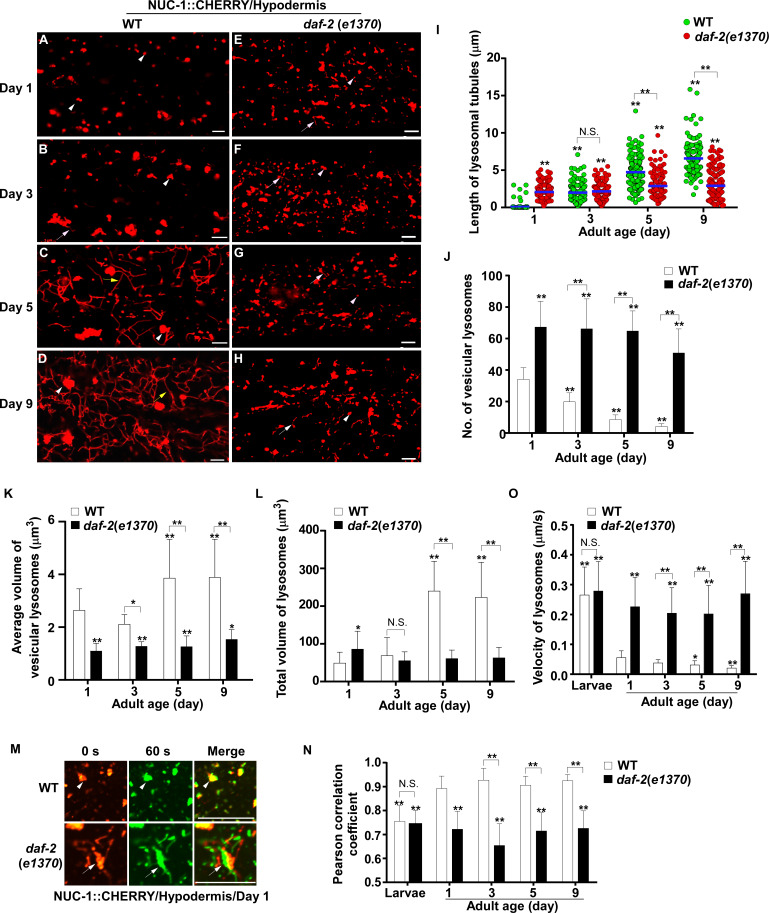
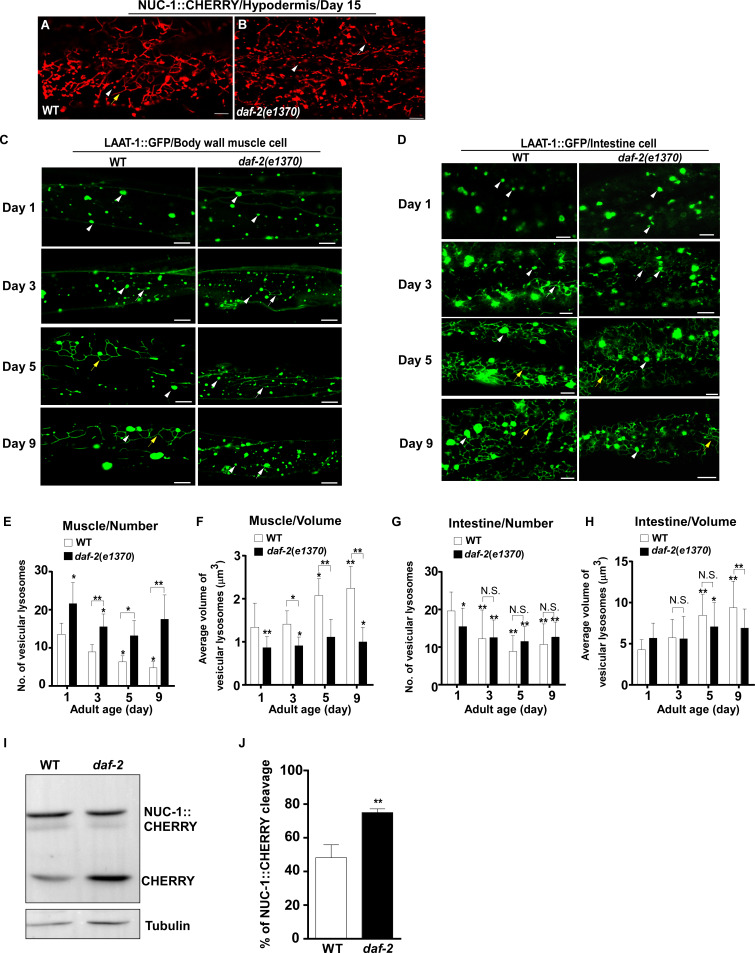
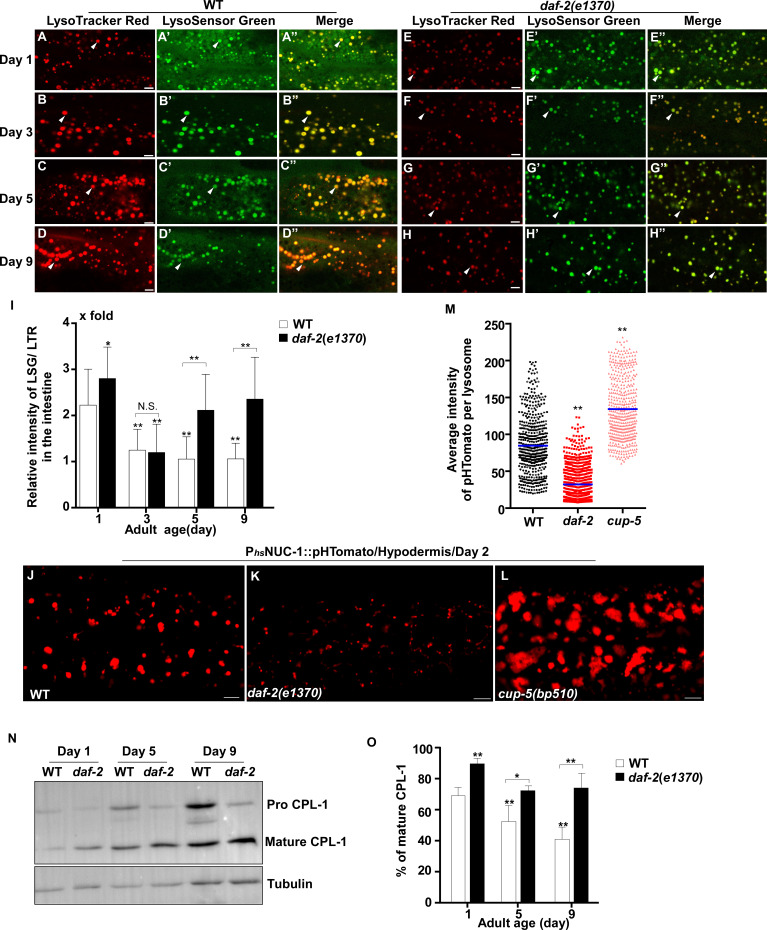
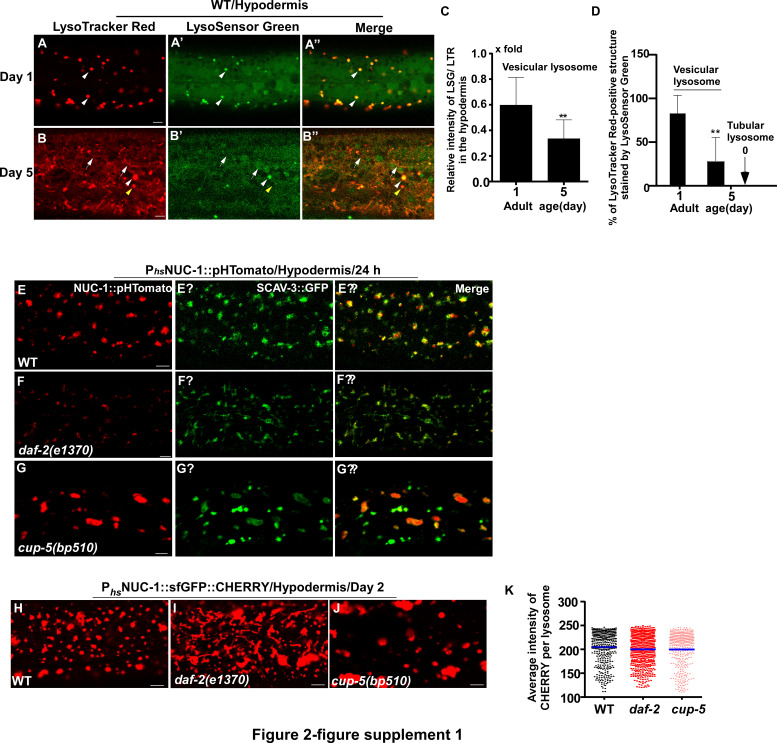
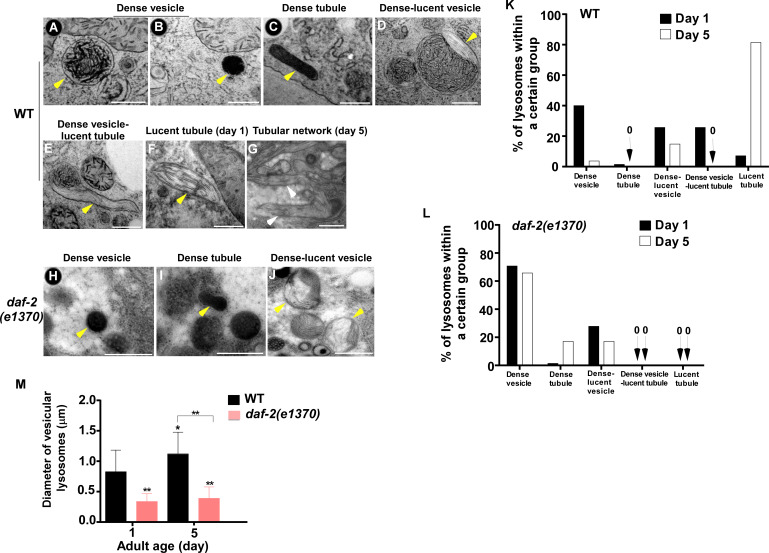
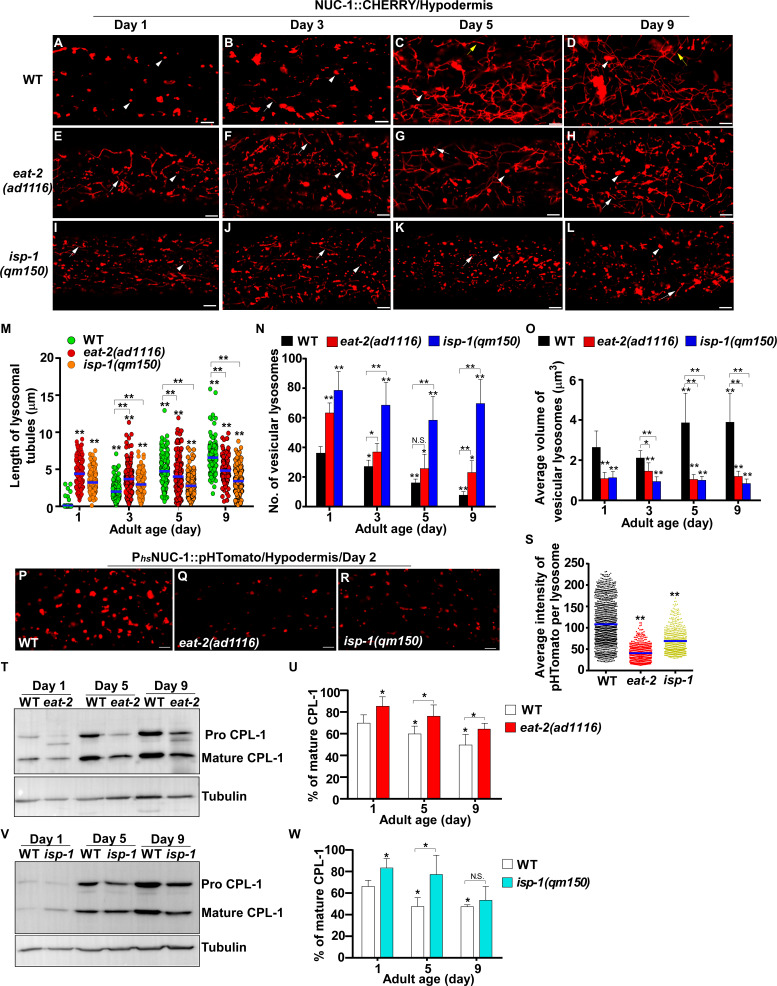
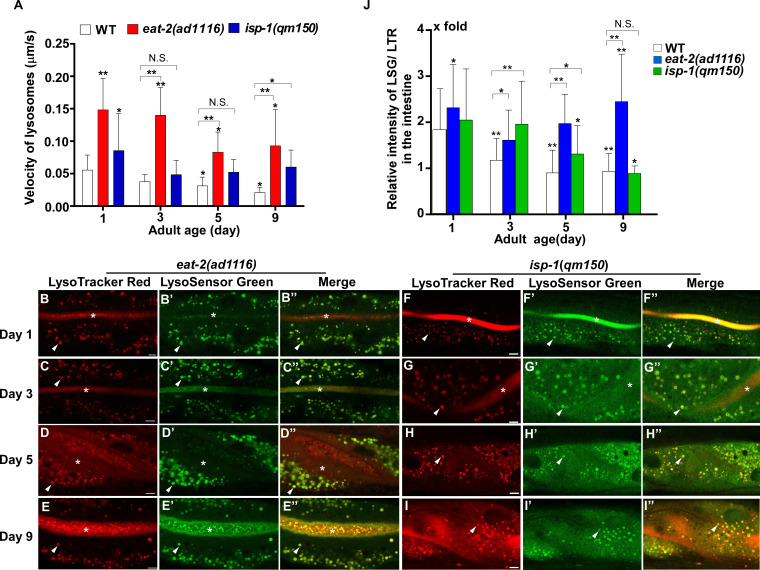
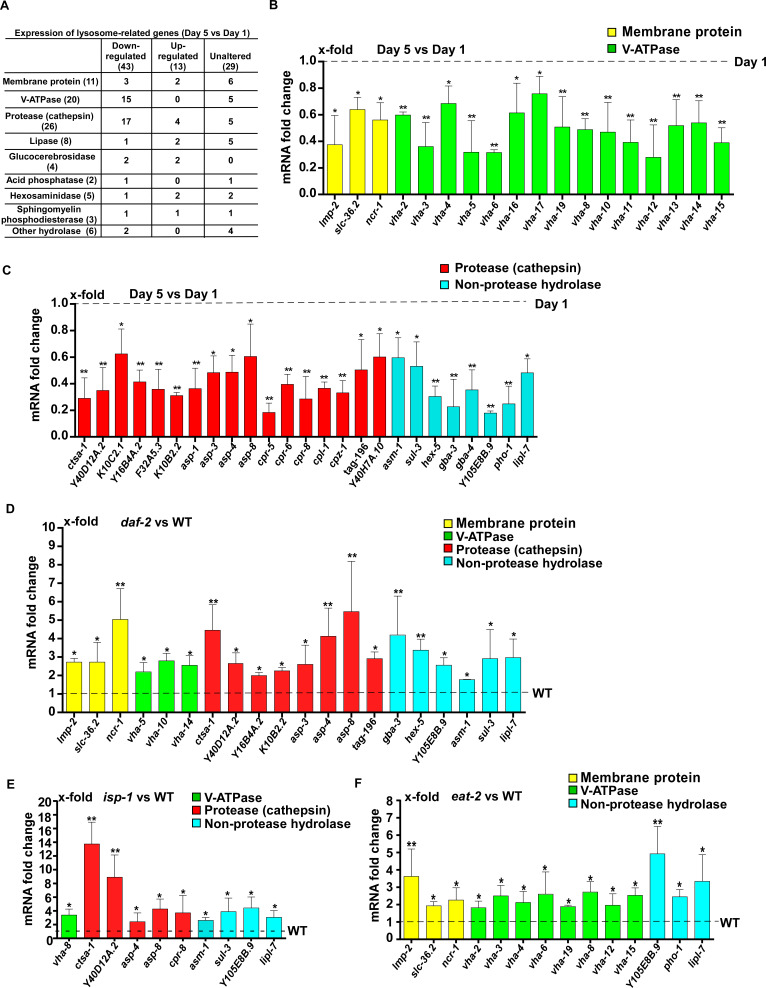
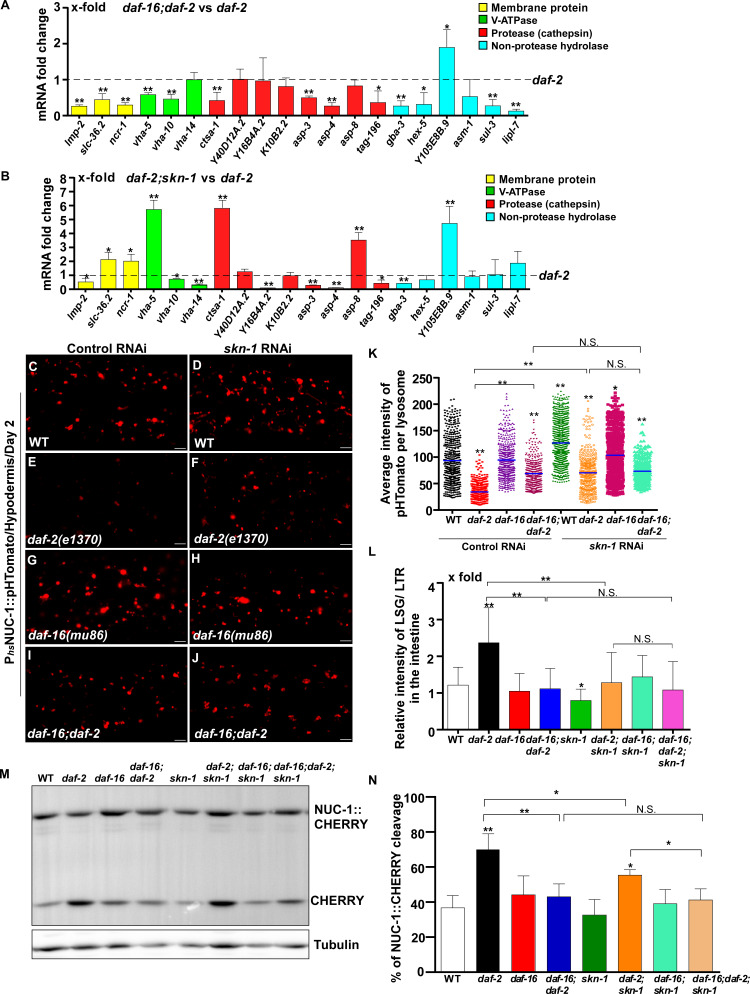
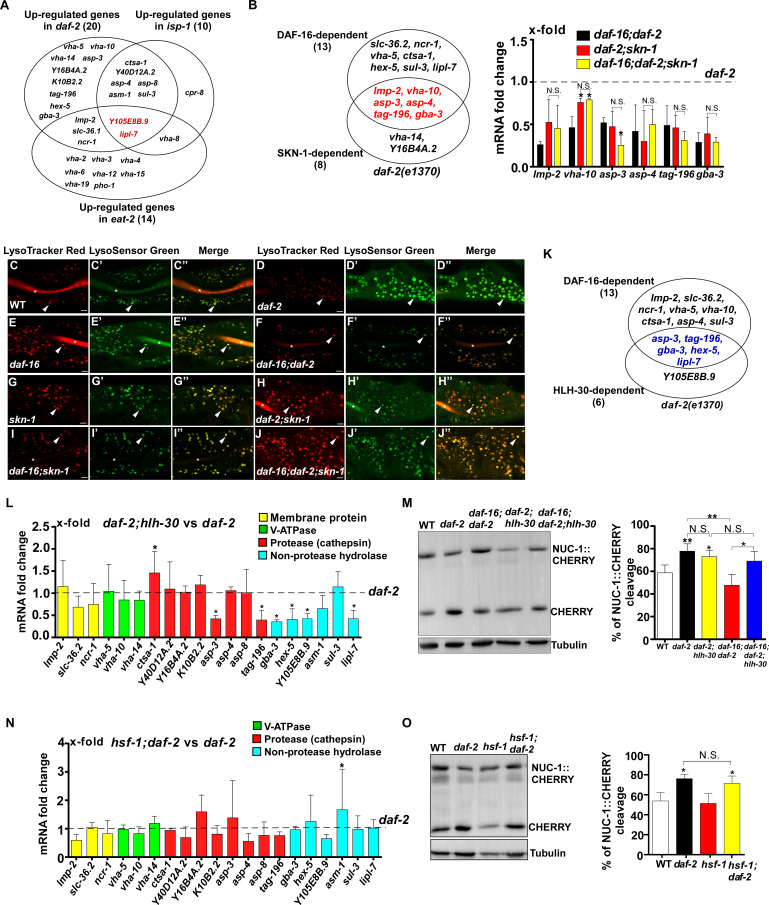
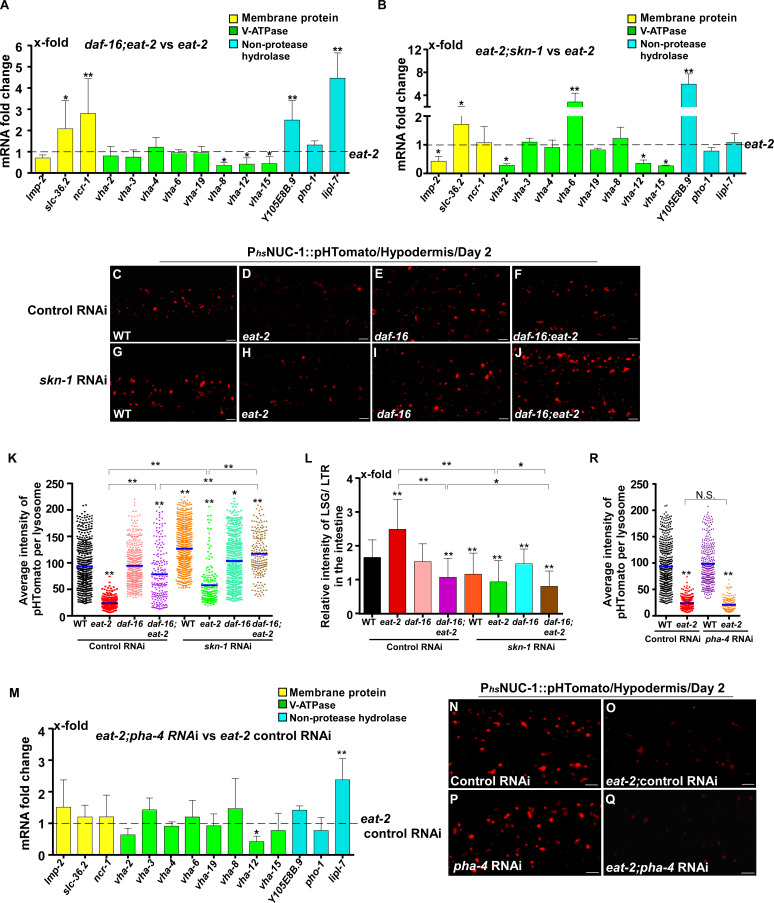
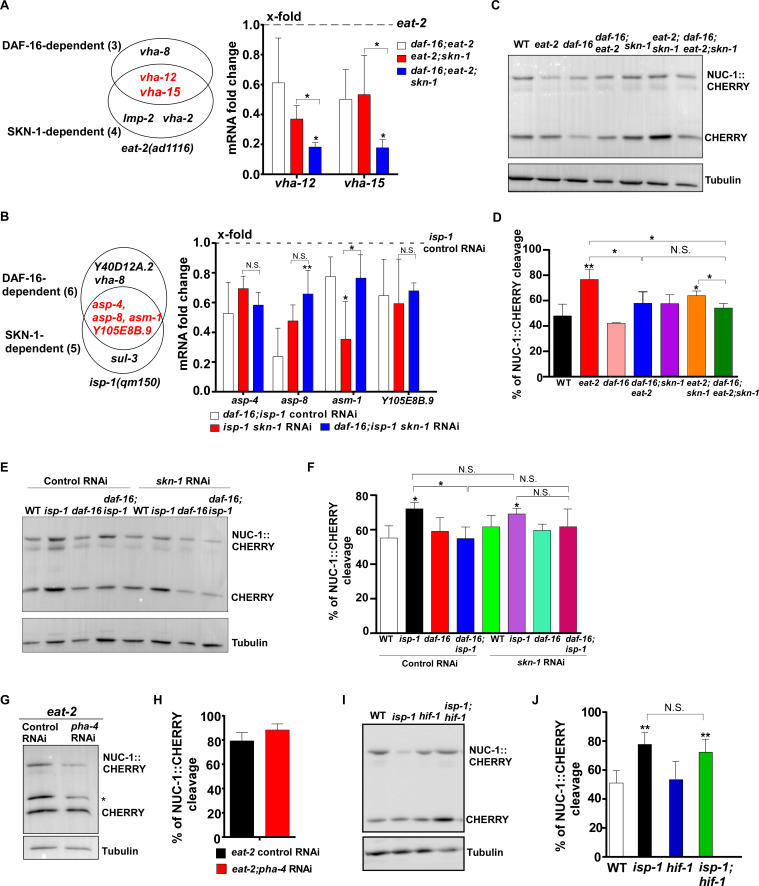
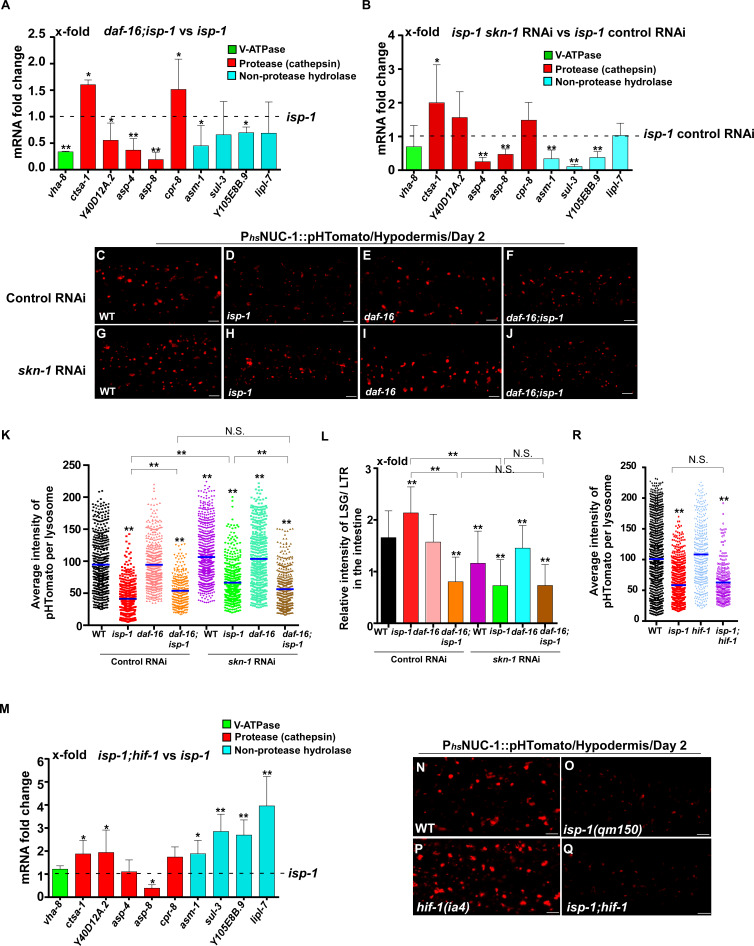
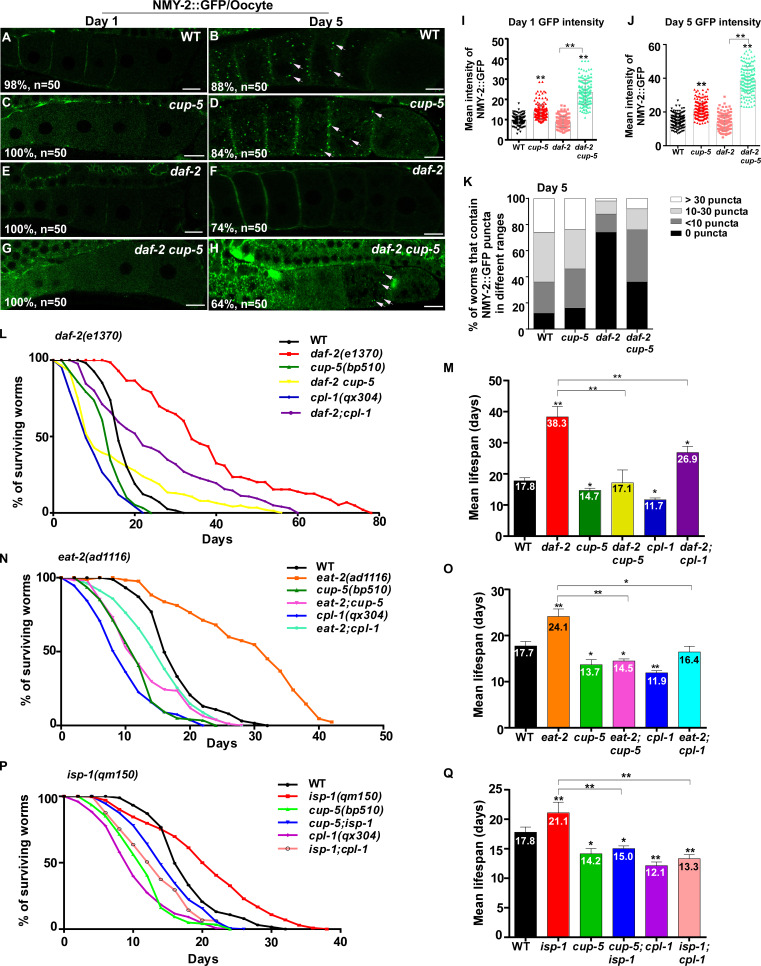
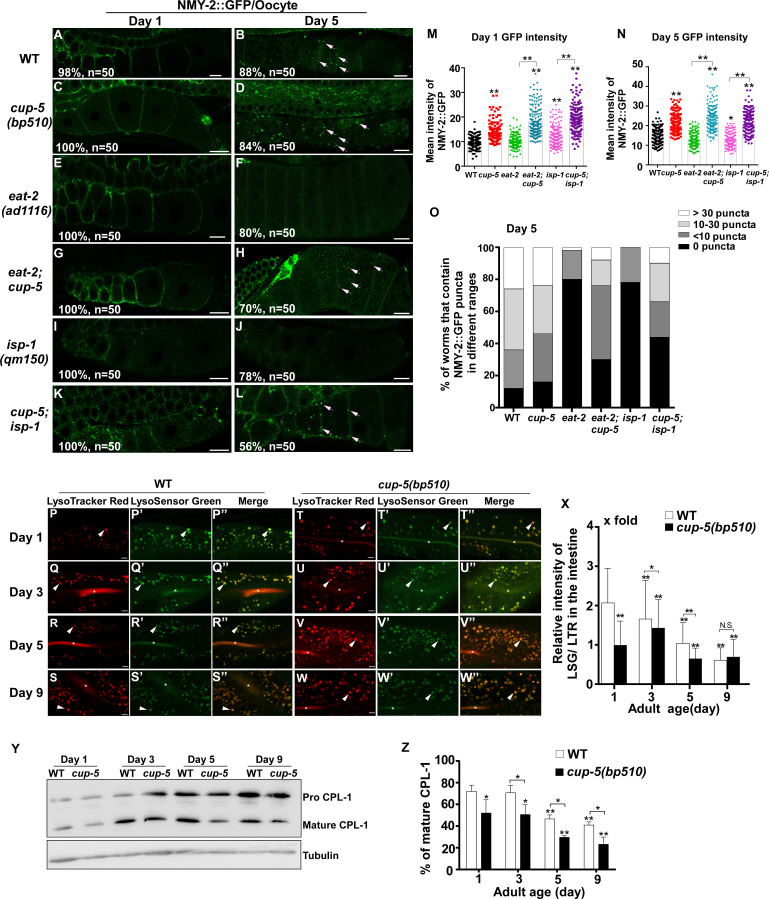
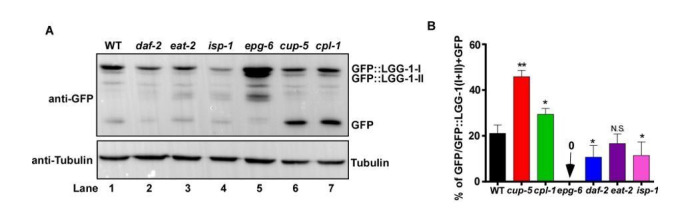
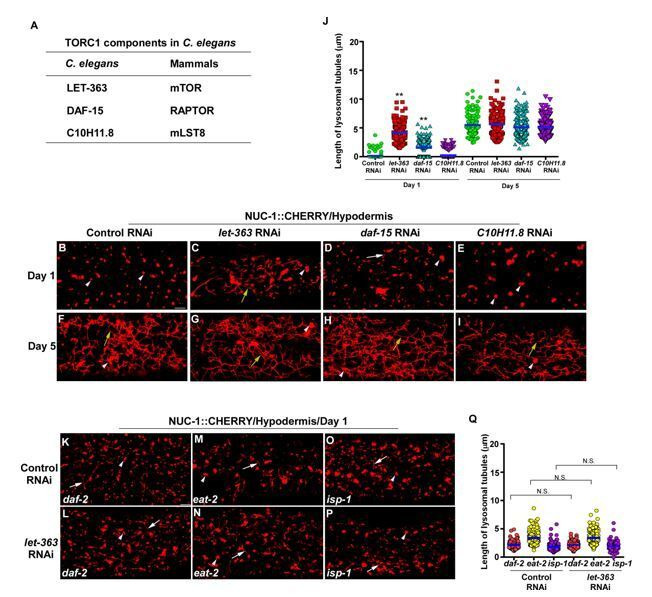
Lysosomes play important roles in cellular degradation to maintain cell homeostasis. In order to understand whether and how lysosomes alter with age and contribute to lifespan regulation, we characterized multiple properties of lysosomes during the aging process in C. elegans. We uncovered age-dependent alterations in lysosomal morphology, motility, acidity and degradation activity, all of which indicate a decline in lysosome function with age. The age-associated lysosomal changes are suppressed in the long-lived mutants daf-2, eat-2 and isp-1, which extend lifespan by inhibiting insulin/IGF-1 signaling, reducing food intake and impairing mitochondrial function, respectively. We found that 43 lysosome genes exhibit reduced expression with age, including genes encoding subunits of the proton pump V-ATPase and cathepsin proteases. The expression of lysosome genes is upregulated in the long-lived mutants, and this upregulation requires the functions of DAF-16/FOXO and SKN-1/NRF2 transcription factors. Impairing lysosome function affects clearance of aggregate-prone proteins and disrupts lifespan extension in daf-2, eat-2 and isp-1 worms. Our data indicate that lysosome function is modulated by multiple longevity pathways and is important for lifespan extension.

Keywords: C. elegans; DAF-16/FOXO; SKN-1/NRF2; aging; cell biology; insuin/igf-1 signaling; longevity pathways; lysosome.


Conflict of interest statement

YS, ML, DZ, XL, CY No competing interests declared, XW Reviewing editor, eLife

Figures

Figure 1.
Figure 1.. Lysosomes exhibit age-associated changes that are suppressed in the long-lived mutant daf-2.
(A–H) Confocal fluorescence images of the hypodermis in wild type (WT; A–D) and daf-2(e1370) (E–H) expressing NUC-1::CHERRY at different ages (adult days 1, 3, 5, 9). White arrowheads indicate vesicular lysosomes; white and yellow arrows indicate short and long lysosomal tubules, respectively. (I–L) Tubule length (I), number (J) and volume (K, L) of lysosomes were quantified in wild type (WT) and daf-2(e1370) at different ages. At least 20 (I, J) or 10 (K, L) animals were scored in each strain at each day. (M) Time-lapse images of lysosomes in the hypodermis in wild type (WT) and daf-2(e1370) expressing NUC-1::CHERRY at adult day 1, with time point 0 s in red and 60 s in green. The overlay (merge) shows lysosome movement over time. Pearson’s correlation coefficient and average velocity of lysosomes were determined at the indicated stages and are shown in (N, O). At least 10 animals were scored in each strain at each stage. In (I, J, K, L, N, O), data are shown as mean ± SD. One-way ANOVA with Tukey’s multiple comparison test (I) and two-way ANOVA with Fisher’s LSD test (J, K, L, N, O) was performed to compare all other datasets with wild type at day 1, or datasets that are linked by lines. *p<0.05; **p<0.001. All other points had p>0.05. N.S., no significance. Scale bars: 5 μm.
Figure 1—figure supplement 1.
Figure 1—figure supplement 1.. Lysosomes exhibit age-associated alterations in C. elegans.
(A, B) Confocal fluorescence images of the hypodermis in wild type (WT; A) and daf-2(e1370) (B) expressing NUC-1::CHERRY at day 15. White arrowheads indicate vesicular lysosomes; white and yellow arrows designate short and longer tubular lysosomal structures, respectively. (C, D) Confocal fluorescence images of the body wall muscle cell (C) and the intestine (D) in wild type and daf-2(e1370) expressing LAAT-1::GFP at different ages (days 1, 3, 5, 9). White arrowheads indicate vesicular lysosomes; white and yellow arrows designate short and long tubular lysosomal structures, respectively. (E–H) The number (E, G) and average volume (F, H) of vesicular lysosomes labeled by LAAT-1::GFP in the body wall muscle cell (E, F) and the intestine (G, H) were quantified in wild type and daf-2(e1370) at the indicated stages. At least 10 animals were scored in each strain at each age. (I) Western blot analysis of NUC-1::CHERRY cleavage in wild type (WT) and daf-2(e1370) at day 1. Quantification is shown in (J). Three independent experiments were performed. In (E, F, G, H, J), data are shown as mean ± SD. Two-way ANOVA with Fisher’s LSD test (E–H) or paired t testing (J) was performed to compare all other datasets with wild type (J), or wild type at day 1 (E–H), or to compare datasets that are linked by lines (E–H). *p<0.05; **p<0.001. All other points had p>0.05. N.S., no significance. Scale bars: 5 μm.
Figure 2.
Figure 2.. Lysosomal acidity and degradation activity are increased in daf-2.
(A–H”) Confocal fluorescence images of the intestine in wild type (WT; A–D”) and daf-2(e1370) (E–H”) adults at different ages stained by LSG DND-189 and LTR DND-99. (I) The relative intensity of LSG/LTR in wild type and daf-2(e1370) at different ages was quantified. At least 10 animals were scored in each strain at each day. (J–L) Confocal fluorescence images of the hypodermis at adult day 2 in wild type (WT; J), daf-2(e1370) (K) and cup-5(bp510) (L) expressing NUC-1::pHTomato controlled by the heat-shock (hs) promoter. The average intensity of pHTomato per lysosome is shown in (M). At least 20 animals were scored in each strain. (N) Western blot analysis of CPL-1 processing in wild type (WT) and daf-2(e1370) at different adult ages. The percentage of mature CPL-1 was quantified (O). Three independent experiments were performed. In (I, M, O), data are shown as mean ± SD. One-way ANOVA with Tukey's multiple comparisons test (I, M) or two-way ANOVA with Fisher’s LSD test (O) was performed to compare all other datasets with wild type (M) or wild type at day 1 (I, O), or to compare datasets that are linked by lines. *p<0.05; **p<0.001. All other points had p>0.05. N.S., no significance. Scale bars: 5 μm.
Figure 2—figure supplement 1.
Figure 2—figure supplement 1.. pHTomato can be used to probe lysosomal acidity in C. elegans.
(A–B’’) Confocal fluorescence images of the hypodermis in wild type (WT) at day 1 (A–A’’) and day 5 (B–B’’) stained by LSG DND-189 and LTR DND-99. White arrowheads indicate vesicular lysosomes stained by both LSG and LTR; yellow arrowheads indicate an LTR-positive and LSG-negative vesicular lysosome. White arrows indicate lysosomal tubules stained by LTR but not LSG. (C, D) The relative intensity of LSG/LTR in the hypodermis (C) and the percentage of LTR-positive lysosomes stained by LSG (D) was quantified. At least 10 animals were quantified at each day. (E–G’’) Confocal fluorescence images of the hypodermis in wild type (WT, (E–E’’), daf-2(e1370) (F–F’’) and cup-5 (bp510) (G–G’’) expressing SCAV-3::GFP and NUC-1::pHTomato controlled by the heat-shock (hs) promoter. NUC-1::pHTomato is delivered to lysosomes labeled by SCAV-3::GFP at 24 hr post heat-shock treatment. (H–J) Confocal fluorescence images of the hypodermis in wild type (WT; H), daf-2(e1370) (I) and cup-5 (bp510) (J) expressing NUC-1::sfGFP::CHERRY controlled by the heat-shock (hs) promoter. (K) The average intensity of CHERRY in each lysosome was quantified. At least 20 animals were scored in each strain. In (C, D, K), data are shown as mean ± SD. Paired t testing (C, D) or one-way ANOVA with Tukey's multiple comparisons test (K) was performed to compare all other datasets with wild type at day 1 (C, D) or with wild type (K). **p<0.001. All other points had p>0.05. Scale bars: 5 μm.
Figure 3.
Figure 3.. The ultrastructure of lysosomes changes dramatically in wild type with age but is maintained well in daf-2.
(A–J) Representative HVEM images of lysosomes in the hypodermis in wild type (WT; A–G) and daf-2 (e1370) (H–J). Yellow arrowheads indicate vesicular lysosomes or short lysosomal tubules. White arrows indicate the lysosomal tubular network formed in wild type at day 5. Scale bars: 500 nm. (K, L) The percentage of lysosomes within a certain morphology group revealed by HVEM was quantified in wild type (WT; K) and daf-2(e1370) (L) at different ages (day 1 and day 5). At least 70 lysosomes were quantified in each strain at each age. (M) The diameter of vesicular lysosomes in wild type (WT) and daf-2(e1370) at different ages was quantified. At least 50 vesicular lysosomes were counted in each strain at each age. One-way ANOVA with Tukey's multiple comparisons test was performed to compare all other datasets with wild type at day 1, or datasets that are linked by lines. *p<0.05; **p<0.001.
Figure 4.
Figure 4.. eat-2(ad1116) and isp-1(qm150) mutants exhibit increased lysosome activity.
(A–L) Confocal fluorescence images of the hypodermis in wild type (WT; A–D), eat-2(ad1116) (E–H) and isp-1(qm150) (I–L) expressing NUC-1::CHERRY at different adult ages. White arrowheads indicate vesicular lysosomes; white and yellow arrows designate short and long lysosomal tubules, respectively. (M–O) The length of tubular lysosomes (M), and the number (N) and mean volume (O) of vesicular lysosomes were quantified in wild type (WT), eat-2(ad1116) and isp-1 (qm150) at different ages. At least 10 animals were scored in each strain at each age. (P–R) Confocal fluorescence images of the hypodermis in wild type (WT; P), eat-2(ad1116) (Q) and isp-1(qm150) (R) expressing NUC-1::pHTomato controlled by the heat-shock (hs) promoter. The average intensity of pHTomato per lysosome was quantified (S). At least 20 animals were scored in each strain. (T, V) Western blot analysis of CPL-1 processing in eat-2(ad1116) (T) and isp-1(qm150) (V) at different ages. The percentage of mature CPL-1 was quantified (U, W). Three independent experiments were performed. In (M, N, O, S, U, W), data are shown as mean ± SD. One-way ANOVA with Tukey's multiple comparisons test (M, S) or two-way ANOVA with Fisher’s LSD test (N, O, U, W) was performed to compare all other datasets with wild type (S) or wild type at day 1 (M, N, O, U, W) or datasets that are linked by lines. *p<0.05; **p<0.001. All other points had p>0.05. N.S., no significance. Scale bars: 5 μm.
Figure 4—figure supplement 1.
Figure 4—figure supplement 1.. Lysosome acidity and motility increase in eat-2(ad1116) and isp-1(qm150) mutants.
(A) Lysosomal velocity was quantified in wild type (WT), eat-2(ad1116) and isp-1(qm150) at different ages (days 1, 3, 5, 9). (B–I’’) Confocal fluorescence images of the intestine in eat-2(ad1116) (B–E”) and isp-1(qm150) (F–I”) at different ages (days 1, 3, 5, 9) stained by LSG DND-189 and LTR DND-99. The asterisks in (B–G’’) indicate accumulation of the dye in the intestinal lumen. Scale bars: 5 μm. Quantification of the relative intensity of LSG/LTR is shown in (J). In (A, J), at least 10 animals were scored in each strain at each age, and data are shown as mean ± SD. One-way ANOVA with Tukey's multiple comparisons test (J) or two-way ANOVA with Fisher’s LSD test (A) was performed to compare all other datasets with wild type at day 1, or datasets that are linked by lines. *p<0.05; **p<0.001. All other points had p>0.05. N.S., no significance.
Figure 5.
Figure 5.. Lysosomal gene expression is upregulated in the long-lived mutants daf-2, eat-2 and isp-1.
(A) Expression of 85 lysosome-related genes in wild type at day 1 and day 5 was analyzed. 43 and 13 lysosomal genes were down- and up-regulated with age, respectively. Expression of 29 lysosomal genes was unaltered at day 5 compared with day 1. (B, C) Quantitative RT-PCR (qRT-PCR) analyses of the 43 downregulated lysosomal genes in wild type at day 1 and day 5. (D–F) Expression of the 43 downregulated lysosomal genes was analyzed by qRT-PCR at day 1 in daf-2 (D), isp-1 (E) and eat-2 (F) worms. In (B–F), three independent experiments were performed. The transcription level of lysosomal genes in wild type (WT) at day 1 was normalized to ‘1’ for comparison. Data are shown as mean ± SD. Multiple t testing was performed to compare mutant datasets with wild type. *p<0.05; **p<0.001.
Figure 6.
Figure 6.. DAF-16 and SKN-1 are required for the upregulation of lysosomal genes and maintenance of lysosomal acidity and activity in daf-2 mutants.
(A, B) Expression of the 20 upregulated lysosomal genes in daf-2 mutants was analyzed by qRT-PCR in daf-16;daf-2 (A) and daf-2;skn-1 (B) worms at day 1. Three independent experiments were performed. The transcription level of lysosomal genes in daf-2(e1370) at day 1 was normalized to ‘1’ for comparison. (C–J) Confocal fluorescence images of the hypodermis in the indicated strains expressing NUC-1::pHTomato controlled by the heat-shock (hs) promoter. Scale bars: 5 μm. The average intensity of pHTomato per lysosome was quantified (K). At least 20 animals were scored in each strain. (L) The relative intensity of LSG/LTR in the intestine was quantified in the indicated strains at day 2. At least 10 animals were scored in each strain. (M) Western blot analysis of CHERRY cleavage from NUC-1::CHERRY in the indicated strains at day 1. Quantification is shown in (N). Three independent experiments were performed. In (A, B, K, L, N), data are shown as mean ± SD. Multiple t testing (A, B), or one-way ANOVA with Tukey's multiple comparisons test (K, L, N) was performed to compare datasets of double mutants with daf-2 (A, B) or to compare all other datasets with wild type (L, N) or with wild type treated with control RNAi (K), or datasets that are linked by lines (K, L, N). *p<0.05; **p<0.001. All other points had p>0.05. N.S., no significance.
Figure 6—figure supplement 1.
Figure 6—figure supplement 1.. DAF-16 and SKN-1 play an overlapping role in regulating lysosomal gene expression in daf-2 mutants.
(A) Venn diagram showing the genes that are upregulated in daf-2(e1370), eat-2(ad1116) and isp-1(qm150). Two genes (in red) are upregulated in all three long-lived mutants. (B) Left: Venn diagram showing the genes that are significantly downregulated by loss of daf-16 or skn-1 function in daf-2 mutants. Six genes (in red) depend on both daf-16 and skn-1. Right: Expression of the 6 DAF-16- and SKN-1-dependent lysosome genes in daf-2 was analyzed in the indicated double and triple mutants. (C–J’’) Confocal fluorescence images of the intestine stained by LSG DND-189 and LTR DND-99 in the indicated strains at day 2. The asterisks (C–C”, E–F”, H–I”) indicate accumulation of the dye in the intestinal lumen. Scale bars: 5 µm. (L, N) Expression levels of the 20 upregulated lysosomal genes in daf-2(e1370) were analyzed by qRT-PCR in daf-2;hlh-30 (L) and hsf-1;daf-2 (N) worms at day 1. Most HLH-30-responsive lysosomal genes in daf-2 are also targeted by DAF-16 (K). (M, O) Western blot analysis of NUC-1::CHERRY cleavage in the indicated strains at day 1. Quantification is shown in the right panels. In (B, L–O), three independent experiments were performed, and data are shown as mean ± SD. The transcription level of lysosomal genes in daf-2(e1370) at day 1 was normalized to ‘1’ for comparison (B, L, N). Multiple t testing (B, L, N) or one-way ANOVA with Tukey's multiple comparisons test (M, O) was performed to compare datasets of double mutants with daf-2 (L, N), or to compare datasets of daf-2;skn-1 and daf-16;daf-2;skn-1 with daf-16;daf-2 (B), or to compare all other datasets with wild type (M, O) or datasets that are linked by lines (B, M, O). *p<0.05; **p<0.001. All other points had p>0.05. N.S., no significance.
Figure 7.
Figure 7.. DAF-16 and SKN-1, but not PHA-4, regulate lysosomal acidity and gene expression in eat-2 mutants.
(A, B, M) Expression of the 14 upregulated lysosomal genes in eat-2(ad1116) was analyzed by qRT-PCR in daf-16;eat-2 (A), eat-2;skn-1 (B) and eat-2;pha-4 RNAi (M) worms at day 1. Three independent experiments were performed. The transcription level of lysosomal genes in eat-2(ad1116) (A, B) or eat-2(ad1116) control RNAi (M) at day 1 was normalized to ‘1’ for comparison. (C–J, N–Q) Confocal fluorescence images of the hypodermis in the indicated strains expressing NUC-1::pHTomato controlled by the heat-shock (hs) promoter. Scale bars: 5 μm. The average intensity of pHTomato per lysosome was quantified (K, R). At least 20 animals were scored in each strain. (L) The relative intensity of LSG/LTR in the intestine was quantified in the indicated strains at day 2. At least 10 animals were scored in each strain. In (A, B, K, L, M, R), data are shown as mean ± SD. Multiple t testing (A, B, M) or one-way ANOVA with Tukey's multiple comparisons test (K, L, R) was performed to compare datasets of double mutants with eat-2 (A, B), or eat-2 control RNAi (M), or to compare all other datasets with wild type treated with control RNAi (K, L, R), or datasets that are linked by lines (K, L, R). *p<0.05; **p<0.001. All other points had p>0.05. N.S., no significance.
Figure 7—figure supplement 1.
Figure 7—figure supplement 1.. DAF-16 and SKN-1 regulate lysosomal gene expression in eat-2 and isp-1 mutants in different manners.
(A, B) Left: Venn diagram showing the genes that were significantly downregulated by loss of daf-16 or skn-1 in eat-2 (A) and isp-1 (B) mutants. The genes that depend on both daf-16 and skn-1 are shown in red. Right: Expression of the DAF-16- and SKN-1-dependent lysosome genes was analyzed in the indicated double and triple mutants. The transcription level of lysosomal genes in eat-2(ad1116) (A) or isp-1(qm150) control RNAi (B) at day 1 was normalized to ‘1’ for comparison. (C–J) Western blot analysis of NUC-1::CHERRY cleavage in the indicated strains at day 1 (C, E, G, I). Quantification analyses are shown in (D, F, H, J). The asterisk in (G) indicates a non-specific band. In (A, B, D, F, H, J), three independent experiments were performed and data are shown as mean ± SD. Multiple t testing (A, B) was performed to compare datasets of eat-2;skn-1 and daf-16;eat-2;skn-1 with daf-16;eat-2 (A), or to compare datasets of isp-1 skn-1 RNAi and daf-16;isp-1 skn-1 RNAi with daf-16;isp-1 control RNAi (B). One-way ANOVA with Fisher’s LSD test (D, F, J) or paired t testing (H) was performed to compare all other datasets with wild type (D, J) or with wild type treated with control RNAi (F), or to compare eat-2;pha-4 RNAi with eat-2 control RNAi (H), or datasets that are linked by lines (A, B, D, F, J). *p<0.05; **p<0.001. All other points had p>0.05. N.S., no significance.
Figure 8.
Figure 8.. DAF-16 and SKN-1, but not HIF-1, regulate lysosomal acidity and gene expression in isp-1 mutants.
(A, B, M) Expression of the 10 upregulated lysosomal genes in isp-1(qm150) was analyzed by qRT-PCR in daf-16;isp-1 (A), isp-1 skn-1 RNAi (B) and isp-1;hif-1 (M) worms at day 1. Three independent experiments were performed. The transcription level of lysosomal genes in isp-1(qm150) or isp-1(qm150) control RNAi at day 1 was normalized to ‘1’ for comparison. (C–J, N–Q) Confocal fluorescence images of the hypodermis in the indicated strains expressing NUC-1::pHTomato controlled by the heat-shock (hs) promoter. Scale bars: 5 μm. The average intensity of pHTomato per lysosome was quantified (K, R). At least 20 animals were scored in each strain. (L) The relative intensity of LSG/LTR in the intestine was quantified in the indicated strains at day 2. At least 10 animals were scored in each strain. In (A, B, K, L, M, R), data are shown as mean ± SD. Multiple t testing (A, B, M) or one-way ANOVA with Tukey's multiple comparisons test (K, L, R) was performed to compare datasets of double mutants with isp-1 (A, M), or isp-1 control RNAi (B), or to compare all other datasets with wild type (R) or with wild type treated with control RNAi (K, L), or to compare datasets that are linked by lines (K, L, R). *p<0.05; **p<0.001. All other points had p>0.05. N.S., no significance.
Figure 9.
Figure 9.. Lysosome activity is important for clearance of aggregate-prone proteins and lifespan extension.
(A–H) Confocal fluorescence images of the oocytes in wild type (WT; A, B), cup-5(bp510) (C, D), daf-2(e1370) (E, F) and daf-2 cup-5 (G, H) expressing NMY-2::GFP at different ages. White arrows indicate NMY-2::GFP puncta. Scale bars: 10 μm. (I–K) The average intensity of NMY-2::GFP (I, J) and the number of NMY-2::GFP puncta (K) were quantified. 50 animals were scored in each strain. (L–Q) Lifespan analyses were performed in the indicated strains. More than 100 worms were examined in each strain and three independent experiments were performed. The mean lifespan in the indicated strains was quantified and is shown in (M, O, Q). In (I, J, M, O, Q), data are shown as mean ± SD. One-way ANOVA with Tukey's multiple comparisons test (I, J) or multiple t testing (M, O, Q) was performed to compare all other datasets with wild type, or datasets that are linked by lines. *p<0.05; **p<0.001. All other points had p>0.05.
Figure 9—figure supplement 1.
Figure 9—figure supplement 1.. Lysosome activity is important for clearance of aggregate-prone proteins in eat-2 and isp-1 mutants.
(A–L) Confocal fluorescence images of the oocytes in wild type (WT; A, B), cup-5(bp510) (C, D), eat-2(ad1116) (E, F), eat-2;cup-5 (G, H), isp-1(qm150) (I, J) and cup-5;isp-1 (K, L) expressing NMY-2::GFP at day 1 and day 5. Scale bars: 10 μm. (M–O) The average intensity of NMY-2::GFP (M, N) and the number of NMY-2::GFP puncta (O) was quantified. 50 animals were counted in each strain at each day. (P–W’’) Confocal fluorescence images of the intestine in wild type (WT; P–S”) and cup-5(bp510) (T–W”) adults at different ages stained by LSG DND-189 and LTR DND-99. The asterisks in (Q–W”) indicate accumulation of the dye in the intestinal lumen. Scale bars: 5 µm. Quantification is shown in (X). (Y) Western blot analysis of CPL-1 processing in wild type (WT) and cup-5(bp510) at different adult ages. The percentage of mature CPL-1 was quantified and shown in (Z). Three independent experiments were performed. In (M, N, X, Z), data are shown as mean ± SD. One-way ANOVA with Tukey's multiple comparisons test (M, N, X) or two-way ANOVA with Fisher’s LSD test (Z) was performed to compare all other datasets with wild type (M, N), or with wild type at day 1 (X, Z) or datasets that are linked by lines. *p<0.05; **p<0.001. All other points had p>0.05. N. S., no significance.
Author response image 1.
Author response image 1.. Examination of GFP::LGG-1 cleavage and degradation.
(A) Western blot analysis of GFP::LGG-1 cleavage and degradation. Whole worm lysates were prepared in the indicated strains at adult day 3. (B) The free GFP level was quantified in the indicated strains. Three independent experiments were performed, and data are shown as mean ± SD. One-way ANOVA with Tukey’s multiple comparisons test was performed to compare all other datasets with wild type. *P<0.05; **P<0.001. N.S., no significance.
Author response image 2.
Author response image 2.. Knockdown of C. elegans TORC1 components does not disrupt lysosomal tubule formation in aged adults.
(A) List of TORC1 components that are tested. (B-I) Confocal fluorescence images of the hypodermis in wild type expressing NUC-1::CHERRY and treated with control RNAi (B, F), let-363 RNAi (C, G), daf-15 RNAi (D, H) or C10H11.8 RNAi (E, I) at adult day 1 and day 5. (K-P) Confocal fluorescence images of the hypodermis in daf-2(e1370), eat-2(ad1116) and isp-1(qm150) expressing NUC-1::CHERRY and treated with control RNAi (K, M, O) or let-363 RNAi (L, N, P). In (B-I, K-P), white arrowheads indicate vesicular lysosomes; white and yellow arrows indicate short and long lysosomal tubules, respectively. The length of lysosomal tubules is quantified in (J and Q). In (J, Q), data are shown as mean ± SD. 10 tubules were scored in each animal and 20 animals were scored in each strain at each age. One-way ANOVA with Tukey’s multiple comparisons test was performed to compare all other datasets with wild type treated with control RNAi at day 1 or day 5 (J), or datasets that are linked by lines (Q). **P<0.001. All other points had P>0.05. N.S., no significance. Scale bars: 5 µm.

Similar articles

Cited by

References

    1. Anisimov VN, Bartke A. The key role of growth hormone-insulin-IGF-1 signaling in aging and Cancer. Critical Reviews in Oncology/Hematology. 2013;87:201–223. doi: 10.1016/j.critrevonc.2013.01.005. - DOI - PMC - PubMed
    1. Baxi K, Ghavidel A, Waddell B, Harkness TA, de Carvalho CE. Regulation of lysosomal function by the DAF-16 forkhead transcription factor couples reproduction to aging in Caenorhabditis elegans. Genetics. 2017;207:83–101. doi: 10.1534/genetics.117.204222. - DOI - PMC - PubMed
    1. Boes M, Cerny J, Massol R, Op den Brouw M, Kirchhausen T, Chen J, Ploegh HL. T-cell engagement of dendritic cells rapidly rearranges MHC class II transport. Nature. 2002;418:983–988. doi: 10.1038/nature01004. - DOI - PubMed
    1. Boes M, Bertho N, Cerny J, Op den Brouw M, Kirchhausen T, Ploegh H. T cells induce extended class II MHC compartments in dendritic cells in a Toll-like receptor-dependent manner. The Journal of Immunology. 2003;171:4081–4088. doi: 10.4049/jimmunol.171.8.4081. - DOI - PubMed
    1. Bohnert KA, Kenyon C. A lysosomal switch triggers proteostasis renewal in the immortal C. elegans germ lineage. Nature. 2017;551:629–633. doi: 10.1038/nature24620. - DOI - PMC - PubMed

Publication types

MeSH terms