. 2020 Aug;215(4):931-945.
doi: 10.1534/genetics.120.303305. Epub 2020 Jun 1.

Multi-trait Genomic Selection Methods for Crop Improvement

Affiliations

Multi-trait Genomic Selection Methods for Crop Improvement

Saba Moeinizade et al. Genetics. 2020 Aug.

Abstract

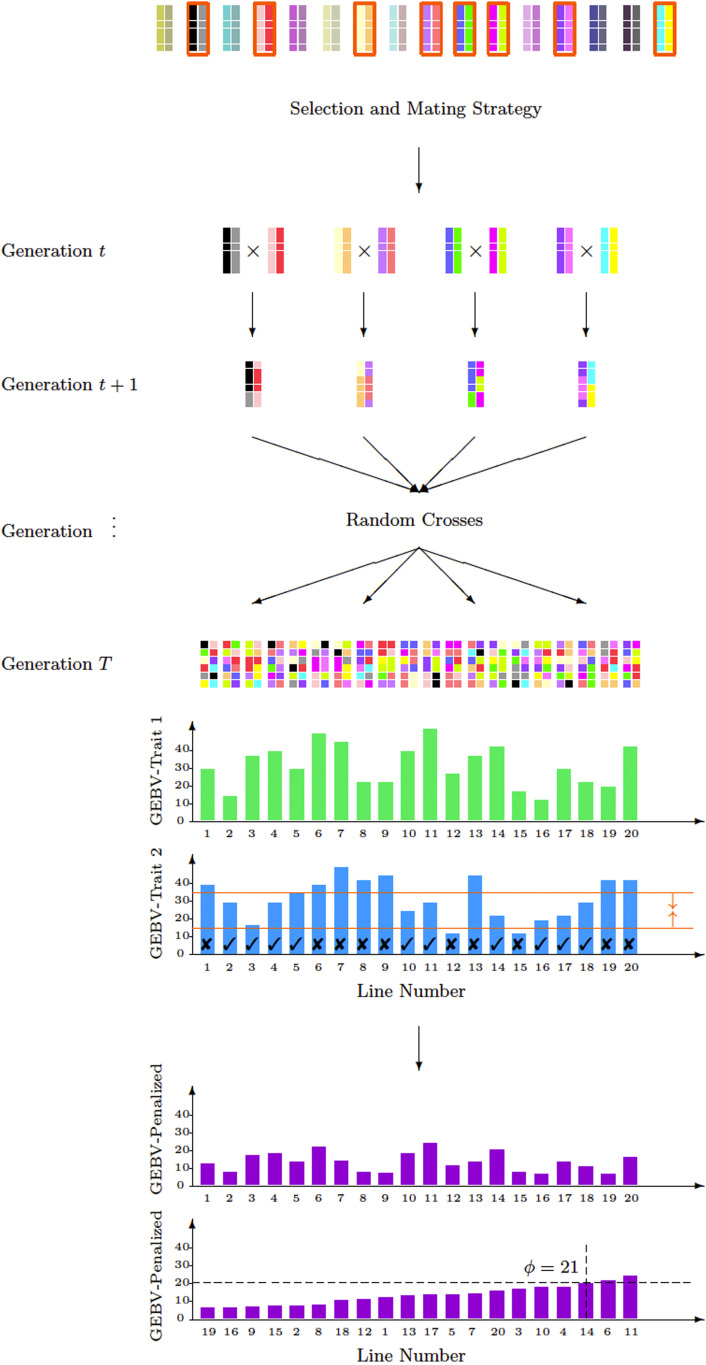
Plant breeders make selection decisions based on multiple traits, such as yield, plant height, flowering time, and disease resistance. A commonly used approach in multi-trait genomic selection is index selection, which assigns weights to different traits relative to their economic importance. However, classical index selection only optimizes genetic gain in the next generation, requires some experimentation to find weights that lead to desired outcomes, and has difficulty optimizing nonlinear breeding objectives. Multi-objective optimization has also been used to identify the Pareto frontier of selection decisions, which represents different trade-offs across multiple traits. We propose a new approach, which maximizes certain traits while keeping others within desirable ranges. Optimal selection decisions are made using a new version of the look-ahead selection (LAS) algorithm, which was recently proposed for single-trait genomic selection, and achieved superior performance with respect to other state-of-the-art selection methods. To demonstrate the effectiveness of the new method, a case study is developed using a realistic data set where our method is compared with conventional index selection. Results suggest that the multi-trait LAS is more effective at balancing multiple traits compared with index selection.

Keywords: Genomic Prediction; multi-trait genomic selection; optimization; simulation.


Figures

Figure 1
Figure 1
The look-ahead simulation illustration for MT-LAS method. In this example, the population consists of 16 individuals. In generation t, eight individuals are selected from the population and mated accordingly to make four crosses. Each breeding parent produces one progeny in generation t + 1 and from generation t + 1 to T − 1 all progeny are crossed with each other in the same generation, each producing one progeny. Then, the look-ahead objective can be approximated by taking a random sample of progeny in generation T. In this example, 20 lines are produced and the GEBV of each individual with respect to traits 1 and 2 are measured and visualized with green and blue bars, respectively. Our goal is to maximize trait 1 after Tt generations while making sure that trait 2 does not exceed a certain value of u = 35 and is not <l = 15. We observe that 10 individuals among 20 are not acceptable. The progeny with acceptable values for bounded trait are distinguished with check marks. The penalized GEBVs are calculated and represented as purple bars and calculation of the objective ϕ is demonstrated for a given γ.
Figure 2
Figure 2
(A) Population GEBVs of EHT vs. TKW for one simulation replicate over 10 generations when selection and mating decisions are optimized using ST-LAS algorithm with an objective of maximizing TKW. Each generation includes 200 individuals represented by stars and different colors are distinguishing between generations. The final generation has a minimum, mean, and maximum of 34.36, 40.25, 47.09 for TKW and −1.68, 7.17, 14.77 for EHT respectively. (B) Minimum, mean and maximum GEBVs of TKW and EHT over 10 generations averaged over 100 simulation replicates. Selection and mating decisions are optimized using ST-LAS algorithm with an objective of maximizing TKW. The final generation has a minimum, mean, and maximum of 33.30, 39.04, 44.51 for TKW and −2.73, 7.00, 16.54 for EHT respectively.
Figure 3
Figure 3
Index selection considering different weights for TKW and EHT averaged over 100 simulation replicates. The mean GEBV of individuals over 10 generation are calculated given a pair of weights for two traits. The absolute values of the weights add up to one. Each curve demonstrates the mean GEBV of individuals (represented by markers) over 10 generations for assigned weights.
Figure 4
Figure 4
Penalized index selection considering different weights for TKW and EHT averaged over 100 simulation replicates for three different cases. Each curve demonstrates the mean GEBV of individuals (represented by markers) over 10 generations for assigned weights. The transparent curves in the background present the index selection results without penalization and the red dashed lines are the decision boundaries.
Figure 5
Figure 5
(A) GEBVs of individuals over 10 generations for one simulation replicate. Optimal selection and mating decisions were made using the MT-LAS method in all three cases. Generations are distinguished with different colors. Over multiple generations of selection, the GEBV of TKW increases and the GEBV of EHT falls within the desired range. The red dashed lines are the decision boundaries and the arrows demonstrate the direction for which the condition is satisfied. (B) Minimum, mean and maximum GEBVs over 10 generations averaged over 100 simulation replicates. The blue markers in the middle of cross marks are the mean GEBVs and the end of the cross marks represent minimum and maximum GEBVs.
Figure 6
Figure 6
Comparison of MT-LAS, ST-LAS and index selection methods. The mean GEBVs of population over 10 generations are averaged over 100 simulation replicates and represented for two traits. Furthermore, the minimum and maximum GEBVs in the final generation are demonstrated using the cross marks. The green bar specifies the boundaries.
Figure 7
Figure 7
SD of total kernel weight GEBVs over time averaged for 100 simulation replicates.
Figure 8
Figure 8
SD of ear height GEBVs over time averaged for 100 simulation replicates.
Figure 9
Figure 9
Comparison of the population performance for MT-LAS, ST-LAS, and index selection methods over 10 generations for one simulation replicate. The gray bars specify boundaries. Each box has three numbers including SD of population GEBVs for trait 1 and trait 2 as well as the correlation between two traits from top to bottom, respectively.
Figure 10
Figure 10
Population GEBV box-plots for 10 and 100 independent simulations (left and right panels, respectively). Selection and mating decisions are optimized using MT-LAS method [with an objective of maximizing TKW and having a constraint on EHT (lower-bound 20 and upper-bound 30, similar to case 1)]. The purple dashed line demonstrates the average of GEBVs across all simulations.

References

    1. Akdemir D., and Sánchez J. I., 2016. Efficient breeding by genomic mating. Front. Genet. 7: 210 10.3389/fgene.2016.00210 - DOI - PMC - PubMed
    1. Akdemir D., Beavis W., Fritsche-Neto R., Singh A. K., and Isidro-Sánchez J., 2019. Multi-objective optimized genomic breeding strategies for sustainable food improvement. Heredity 122: 672–683. 10.1038/s41437-018-0147-1 - DOI - PMC - PubMed
    1. Bates D., Mächler M., Bolker B., and Walker S., 2015. Fitting linear mixed-effects models using lme4. J. Stat. Softw. 67: 1–48. 10.18637/jss.v067.i01 - DOI
    1. Brascamp E., 1984. Selection indices with constraints. Anim. Breed. Abst. 52: 645–654.
    1. Browning B., and Browning S., 2008. A unified approach to genotype imputation and haplotype-phase inference for large data sets of trios and unrelated individuals. American Journal of Human Genetics 84: 210–223. - PMC - PubMed

Publication types