. 2020 Jul 23;56(1):2001483.
doi: 10.1183/13993003.01483-2020. Print 2020 Jul.

Estimates of the ongoing need for social distancing and control measures post-"lockdown" from trajectories of COVID-19 cases and mortality

Affiliations

Estimates of the ongoing need for social distancing and control measures post-"lockdown" from trajectories of COVID-19 cases and mortality

Mike Lonergan et al. Eur Respir J. .

Abstract

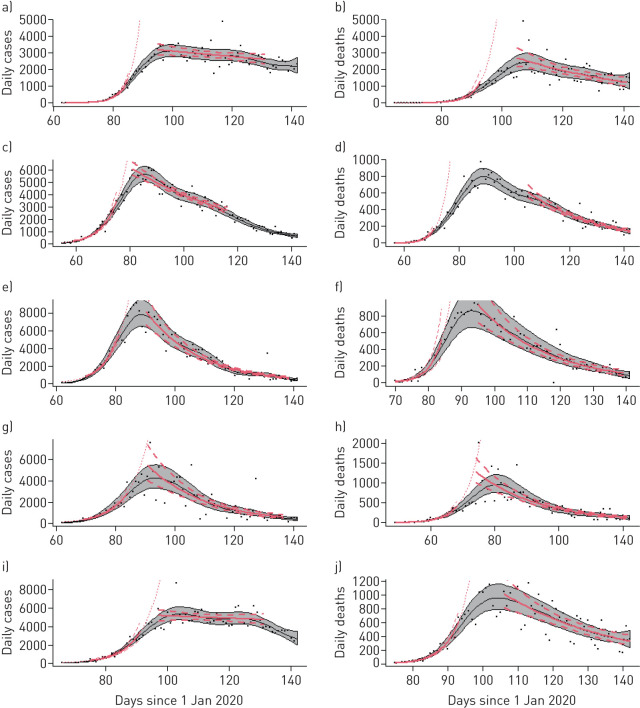
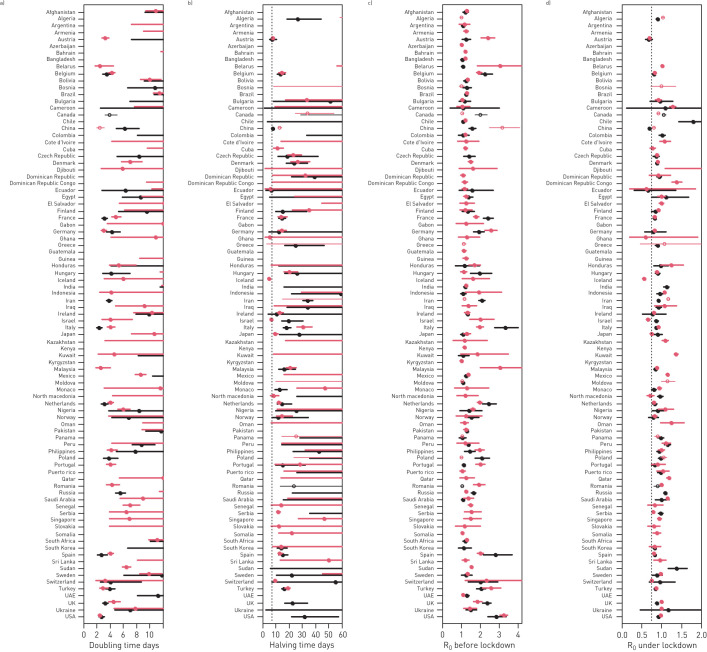
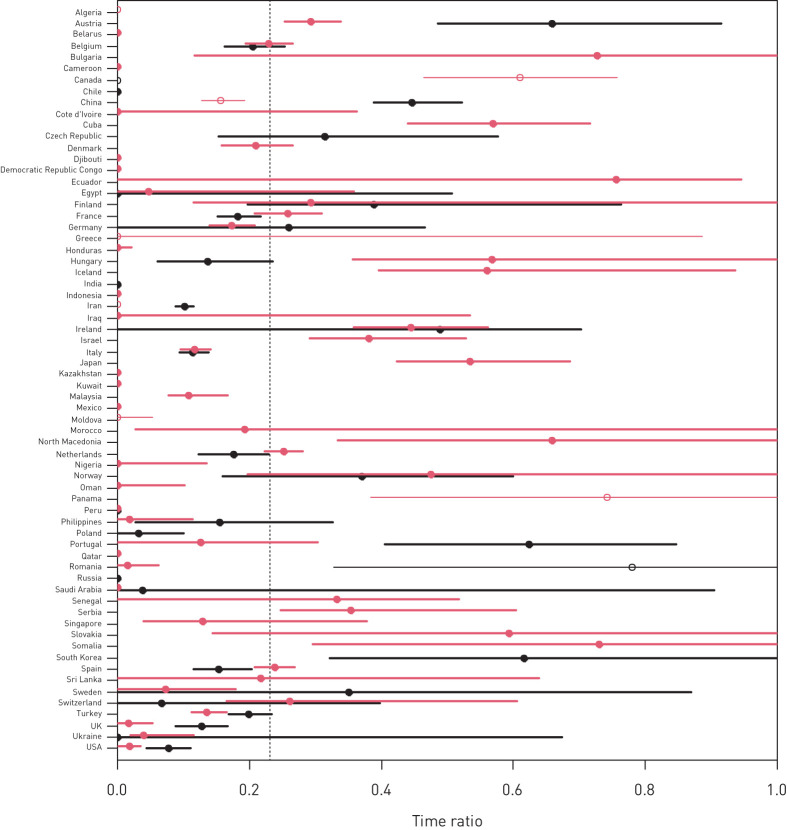
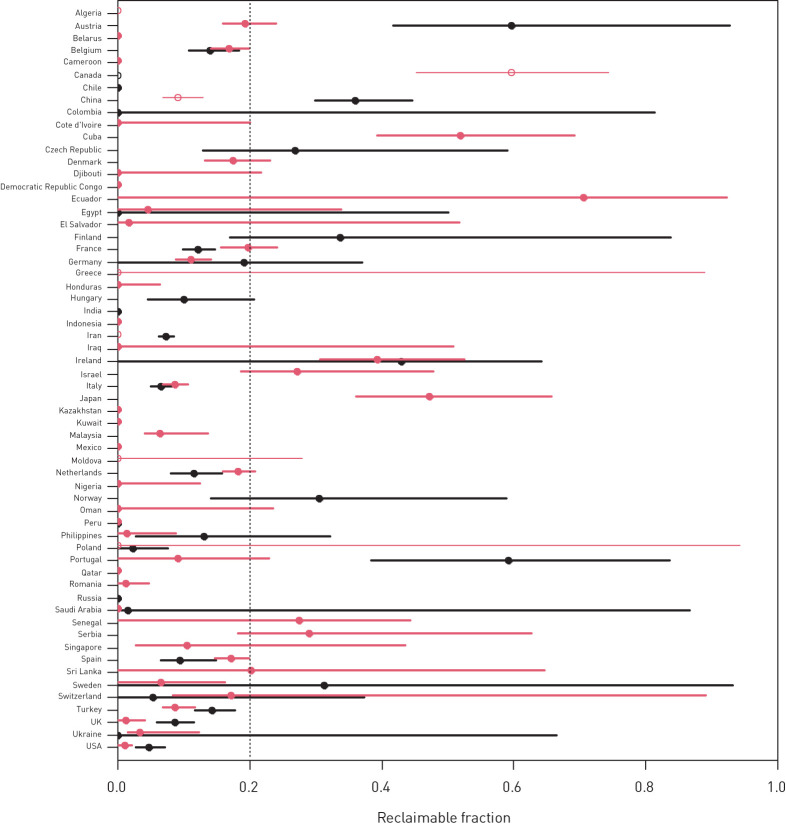
By 21 May 2020, severe acute respiratory syndrome-coronavirus-2 (SARS-CoV-2) had caused more than 5 million cases of coronavirus 2019 (COVID-19) across more than 200 countries. Most countries with significant outbreaks have introduced social distancing or "lockdown" measures to reduce viral transmission. So the key question now is when, how and to what extent these measures can be lifted.Publicly available data on daily numbers of newly confirmed cases and mortality were used to fit regression models estimating trajectories, doubling times and the reproduction number (R0) of the disease, before and under the control measures. These data ran up to 21 May 2020, and were sufficient for analysis in 89 countries.The estimates of R0 before lockdown based on these data were broadly consistent with those previously published: between 2.0 and 3.7 in the countries with the largest number of cases available for analysis (USA, Italy, Spain, France and UK). There was little evidence to suggest that the restrictions had reduced R far below 1 in many places, with France having the most rapid reductions: R0 0.76 (95% CI 0.72-0.82) based on cases, and 0.77 (95% CI 0.73-0.80) based on mortality.Intermittent lockdown has been proposed as a means of controlling the outbreak while allowing periods of increased freedom and economic activity. These data suggest that few countries could have even 1 week per month unrestricted without seeing resurgence of the epidemic. Similarly, restoring 20% of the activity that has been prevented by the lockdowns looks difficult to reconcile with preventing the resurgence of the disease in most countries.


Conflict of interest statement

Conflict of interest: M. Lonergan has nothing to disclose. Conflict of interest: J.D. Chalmers has received research grants from GlaxoSmithKline, Boehringer Ingelheim, AstraZeneca, Pfizer, Grifols, Bayer AG, Polyphor and Insmed; and received consultancy, congress travel or speaker fees from GlaxoSmithKline, Bayer Healthcare, Aradigm Corporation, Grifols, Pfizer, Boehringer Ingelheim, Napp and Insmed.

Figures

FIGURE 1
FIGURE 1
Trajectories of cases of and deaths from coronavirus 2019 (COVID-19). Data points represent numbers of a, c, e, g, i) new cases or b, d, f, h, j) deaths reported to the European Centre for Disease Prevention and Control for each day up to 21 May 2020 in a, b) USA, c, d) Italy, e, f) Spain, g, h) France and i, j) UK. Grey shading represents the 95% confidence interval around a smooth trajectory (black line) estimated by a generalised additive model. Exponential patterns (mean and 95% CI) fitted to subsets of the data are in red. Details of the models are in the main text.
FIGURE 2
FIGURE 2
Doubling times and R0 for exponential phases of outbreaks of coronavirus 2019 (COVID-19). Black data points are estimates based on mortality data, red data points are based on confirmed cases. Lines represent 95% CI. Thin lines and hollow points indicate countries where plots of the modelled trajectories led to subjective doubts of the model fits. Gaps occur where an exponential phase was identified for only one of the data series. Table S1 contains all these data. a) Doubling time in the first (pre-lockdown) exponential phase of the epidemic. Lines that meet 0 indicate a >2.5% chance that the epidemic was slowing over this period. b) Halving time in the second (locked down) exponential phase. The vertical dotted line is at 7 days and shows that almost all declines were slower than the preceding increases. c) The basic reproduction number, R0, for COVID-19 in each country during the first exponential phase. d) R0 under lockdown. The vertical dotted line at 0.7 is a guide to highlight how little evidence there is for lockdowns having reduced R0 below this number.
FIGURE 3
FIGURE 3
Estimated time ratios; the proportion of time countries could have in pre-lockdown state without the spread of severe acute respiratory syndrome-coronavirus-2 resuming. For each country the exponential rate calculated before lockdown was divided by that under lockdown to give a mean and 95% CI. Black data points represent mortality and red data points represent confirmed cases. Thin lines and hollow points indicate countries where plots of the modelled trajectories led to subjective doubts of the model fits. Lines that meet 0 indicate a >2.5% chance that the epidemic was actually spreading faster over the second period than the first. The vertical dotted line indicates the effect of relaxing lockdown for 1 week (during which previous behaviour would be resumed) each month. Most of the more precise estimates lie to the left of this line, showing that there is little evidence that such a change would be consistent with stopping the epidemic.
FIGURE 4
FIGURE 4
The scope for partial easing of lockdown while containing the spread of proportion of time countries could have in pre-lockdown state without the spread of severe acute respiratory syndrome-coronavirus-2. The reclaimable fraction, one minus R0 under lockdown divided by the difference between the R0's before and under lockdown, is an estimate of the proportion of the behaviour, that lockdown has prevented, that can be resumed without increasing R0 past 1, and restarting epidemic spread (table 1). Each row is the mean and 95% CI for a country. Black data points represent mortality data and red data points represent confirmed cases. Thin lines and hollow points indicate countries where plots of the modelled trajectories led to subjective doubts of the model fits. Lines that cut the left hand edge (0) indicate countries for whom lockdown may not yet have halted the epidemic. The vertical dotted line at 0.2 is a guide to highlight that there is little evidence for it being sustainable to resume >20% of discontinued activity without the epidemic resuming its spread.

Comment in

  • Correlation and causality: a COVID-19 conundrum.
    Morice AH. Morice AH. Eur Respir J. 2020 Oct 15;56(4):2003174. doi: 10.1183/13993003.03174-2020. Print 2020 Oct. Eur Respir J. 2020. PMID: 32859679 Free PMC article.
  • A cuckoo COVID coincidence?
    Chalmers JD, Lonergan M. Chalmers JD, et al. Eur Respir J. 2020 Oct 15;56(4):2003236. doi: 10.1183/13993003.03236-2020. Print 2020 Oct. Eur Respir J. 2020. PMID: 32907889 Free PMC article.

References

    1. Zhu N, Zhang D, Wang W, et al. . A novel coronavirus from patients with pneumonia in China, 2019. N Engl J Med 2020; 382: 727–733. doi:10.1056/NEJMoa2001017 - DOI - PMC - PubMed
    1. Ghinai I, McPherson TD, Hunter JC, et al. . First known person-to-person transmission of severe acute respiratory syndrome coronavirus 2 (SARS-CoV-2) in the USA. Lancet 2020; 395: 1137–1144. doi:10.1016/S0140-6736(20)30607-3 - DOI - PMC - PubMed
    1. Zhou F, Yu T, Du R, et al. . Clinical course and risk factors for mortality of adult inpatients with COVID-19 in Wuhan, China: a retrospective cohort study. Lancet 2020; 395: 1054–1062. doi:10.1016/S0140-6736(20)30566-3 - DOI - PMC - PubMed
    1. Abo-Leyah H, Chalmers JD. Middle East Respiratory Syndrome: the need for better evidence in severe respiratory viral infections. Crit Care Med 2015; 43: 1344–1346. doi:10.1097/CCM.0000000000001008 - DOI - PubMed
    1. European Centres for Disease Prevention and Control COVID-19 situation update worldwide, as of 8 June 2020 www.ecdc.europa.eu/en/geographical-distribution-2019-ncov-cases Date last updated: 8 June 2020; date last accessed: 22 May 2020.

MeSH terms