. 2020 Jun 16;117(24):13238-13247.
doi: 10.1073/pnas.1917569117. Epub 2020 Jun 1.

Liquid network connectivity regulates the stability and composition of biomolecular condensates with many components

Affiliations

Liquid network connectivity regulates the stability and composition of biomolecular condensates with many components

Jorge R Espinosa et al. Proc Natl Acad Sci U S A. .

Abstract

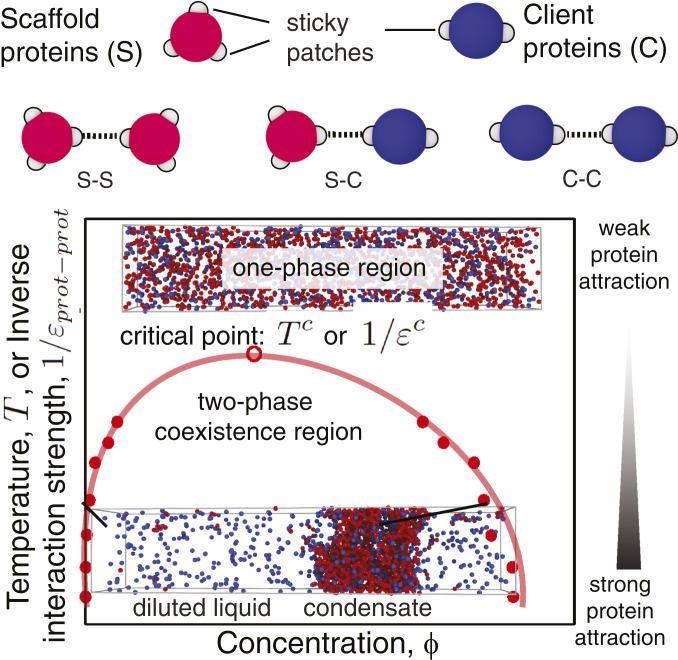
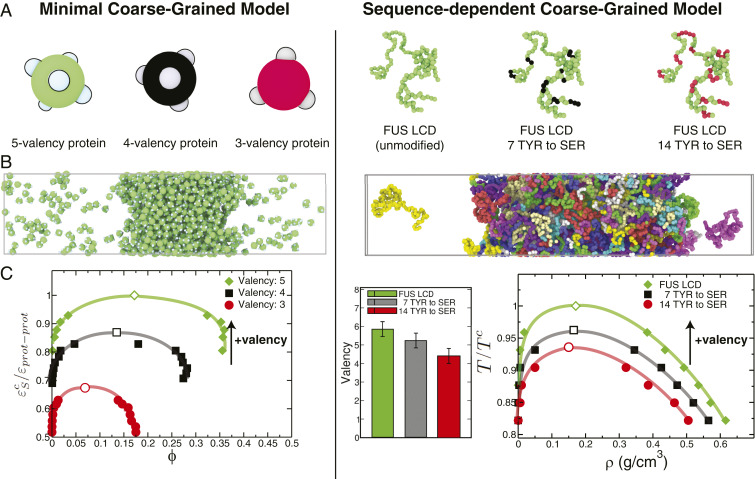
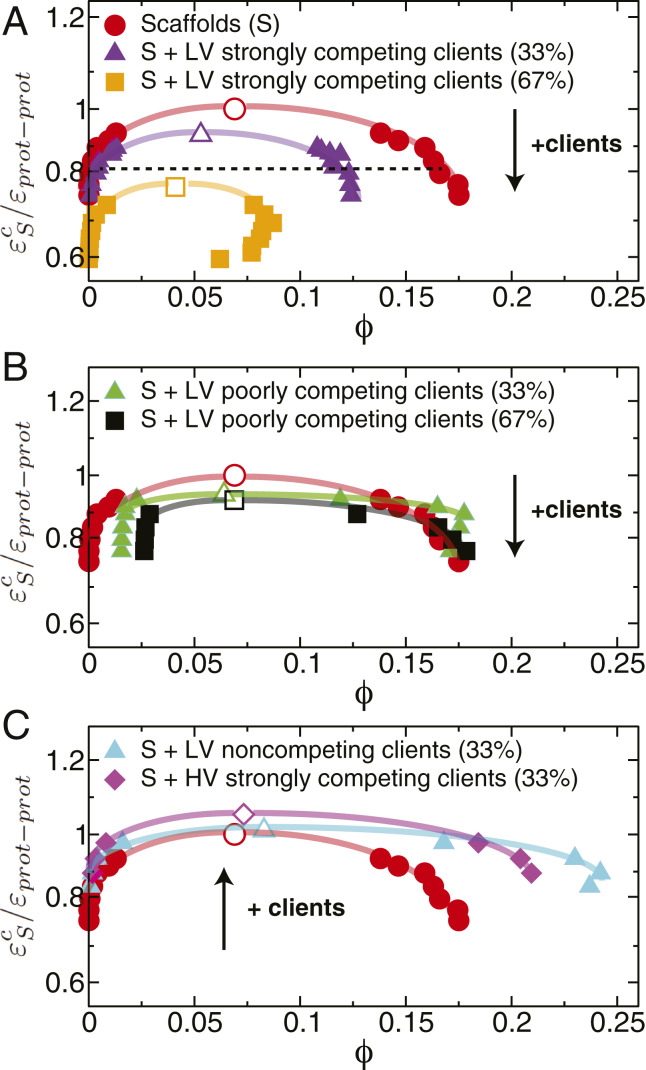
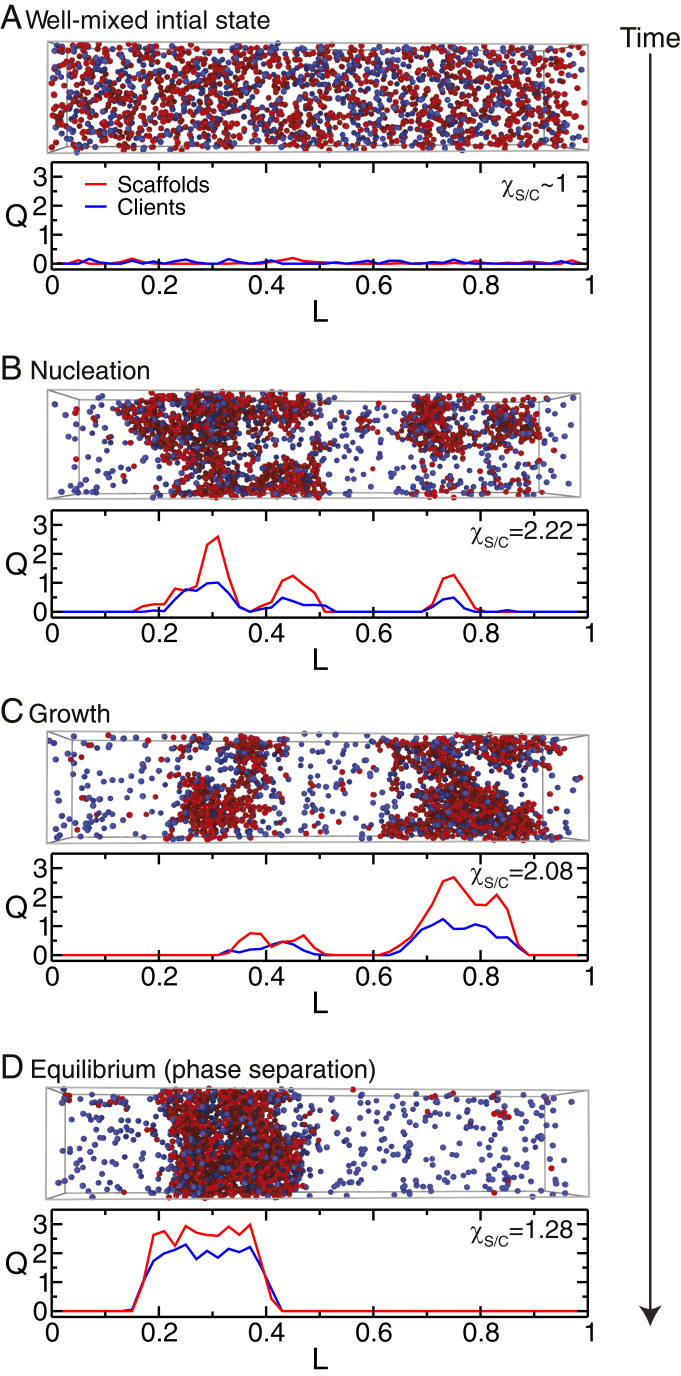
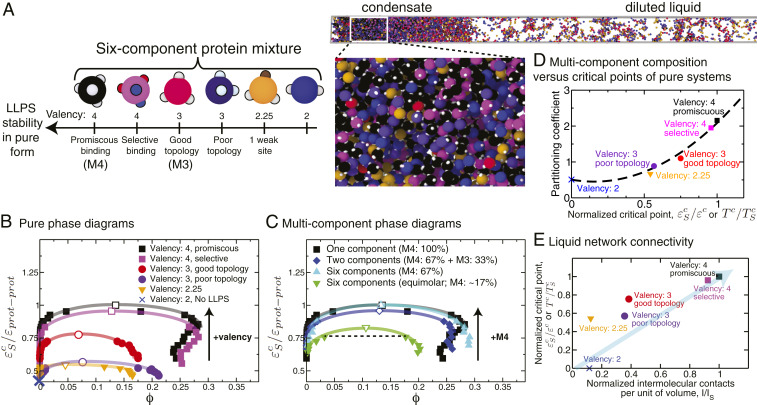
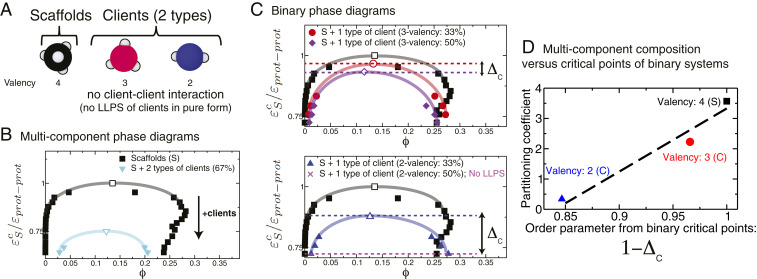
One of the key mechanisms used by cells to control the spatiotemporal organization of their many components is the formation and dissolution of biomolecular condensates through liquid-liquid phase separation (LLPS). Using a minimal coarse-grained model that allows us to simulate thousands of interacting multivalent proteins, we investigate the physical parameters dictating the stability and composition of multicomponent biomolecular condensates. We demonstrate that the molecular connectivity of the condensed-liquid network-i.e., the number of weak attractive protein-protein interactions per unit of volume-determines the stability (e.g., in temperature, pH, salt concentration) of multicomponent condensates, where stability is positively correlated with connectivity. While the connectivity of scaffolds (biomolecules essential for LLPS) dominates the phase landscape, introduction of clients (species recruited via scaffold-client interactions) fine-tunes it by transforming the scaffold-scaffold bond network. Whereas low-valency clients that compete for scaffold-scaffold binding sites decrease connectivity and stability, those that bind to alternate scaffold sites not required for LLPS or that have higher-than-scaffold valencies form additional scaffold-client-scaffold bridges increasing stability. Proteins that establish more connections (via increased valencies, promiscuous binding, and topologies that enable multivalent interactions) support the stability of and are enriched within multicomponent condensates. Importantly, proteins that increase the connectivity of multicomponent condensates have higher critical points as pure systems or, if pure LLPS is unfeasible, as binary scaffold-client mixtures. Hence, critical points of accessible systems (i.e., with just a few components) might serve as a unified thermodynamic parameter to predict the composition of multicomponent condensates.

Keywords: biomolecular condensates; cell compartmentalization; liquid–liquid phase separation; membraneless organelles.


Conflict of interest statement

The authors declare no competing interest.

Figures

Fig. 1.
Fig. 1.
Graphical illustration of the minimal coarse-grained protein model used in this work (Top) and a representation of a typical phase diagram as a function of the (inverse) interaction strength (Bottom). Proteins (scaffolds and clients) are represented as hard-sphere cores (red for scaffolds and blue for clients) with attractive sites on their surface (gray patches). Each patch allows the protein to engage in one weak attractive protein–protein interaction. The phase diagrams explore the space of (inverse) protein–protein interaction strengths (1/εprotprot; vertical axis) or equivalently temperature (T, since T1/εprotprot) versus volume fractions (ϕ; horizontal axis). For a given value of 1/εprotprot, if two phases are detected, we measure the volume fractions (ϕ) of the proteins in the different phases and use this information to plot a coexistence curve. The volume fraction is defined as the fraction of the volume of a phase (V) that is occupied by proteins: ϕi=NiVi/V=CiVi, where Vi is the volume of the hard core of protein of type i and Ni is the total number of proteins of type i in a given phase. Ci is the number density of proteins of type i in that phase. The coexistence curve (shown in red) is useful when assessing the propensity of a protein to phase separate because it shows for what values of the protein–protein interaction strength (vertical axis) and for what protein concentration (horizontal axis) demixing will occur. The region above the coexistence curve is the “one-phase region,” where protein–protein interactions are too weak to sustain phase separation (top snapshot of a well-mixed homogeneous phase). The region below the coexistence curve, the “two-phase coexistence region,” represents stronger protein–protein interactions that favor demixing into a condensed (protein-enriched) and a diluted (protein-depleted) liquid phase (bottom snapshot of a demixed system). The maximum in the coexistence curve is known as the critical point (Tc or 1/εc): For interaction strengths lower than the critical value, liquid–liquid phase separation is no longer observed. If, in a simulation, the interaction strength exceeds the critical value, liquid–liquid phase separation occurs spontaneously.
Fig. 2.
Fig. 2.
Impact of protein valency modulation in their phase behavior as predicted by the minimal coarse-grained protein model used in this work (A–C, Left) and the realistic residue-resolution sequence-dependent protein model of Dignon et al. (52) (A–C, Right). (A, Left) Schematic illustration of proteins with three different valencies (green, 5-valency; black, 4-valency; and red, 3-valency) modeled as patchy particles. (A, Right) The low-complexity domain (residues 1 to 163) of the human FUS protein (green, unmodified FUS LCD), FUS LCD with 7 of its tyrosine (TYR) residues mutated to serine (SER) (green with black spheres highlighting the mutated TYR) and with 14 of its TYR residues mutated to SER (green with red spheres highlighting the mutated TYR). (B) Simulation snapshots illustrating the coexistence of condensed and diluted liquid phases. (C, Left) Phase diagrams (inverse protein–protein interaction strengths, 1/εprotprot, versus volume fraction, ϕ) for the three minimal proteins. (C, Right) Average valency (SI Appendix, section V) and liquid–liquid phase diagrams (temperature, T, versus density, ρ) for the three FUS LCD proteins studied. The vertical axes in C have been normalized by the critical point of the highest-valency protein in each set (Left, 1/εSc for the 5-valency protein; Right, Tc for the unmodified FUS LCD). The black arrows indicate the direction toward which the critical parameters (1/εprotprotc or Tc) move upon an increase in valency. Error bars in the phase diagrams are of the same size as or smaller than the symbols. Typical statistical uncertainties are provided in SI Appendix, Table S5.
Fig. 3.
Fig. 3.
Modulation of stability of biomolecular condensates formed by scaffolds (valency of 3) and different types of clients assessed through liquid–liquid phase diagrams. Clients are either low-valency proteins (LV), i.e., valency of 2, or higher-than-scaffold valency proteins (HV), i.e., valency of 4. The lines joining the data points in the phase diagrams are shown as a visual guide to facilitate comparison of the coexistence regions. The values on the vertical axes of the phase diagrams have been normalized (for comparison purposes) by dividing over the critical point of the pure scaffold system (i.e., 1/εSc for the 3-valency pure system). (A) Destabilization of liquid-drop formation by adding LV strongly competing clients to the condensate. Throughout, we define strongly competing clients as those that bind to scaffolds at the same sites, and with the same strength, as in scaffold–scaffold interactions. We compare two cases: 67% scaffold proteins (purple triangles) with 33% high-affinity clients versus 33% scaffolds (orange squares) and 67% clients. The dotted line illustrates the constant value of the inverse interaction strength used in Fig. 4 to evaluate the molecular mechanism of condensate formation. (B) Negligible change in the stability of a biomolecular condensate by addition of LV poorly competing clients. Poorly competing clients are defined as those that bind to scaffolds with one-half of the strength of the scaffold self-interactions, while using the same binding sites as those used for scaffold–scaffold interactions. We compare 67% scaffolds (green triangles) with 33% clients versus 33% scaffolds (black squares) with 67% clients. Note that the diluted-liquid branch exhibits higher densities as the proportion of poorly competing clients increases because clients are predominantly excluded from the condensate and, therefore, concentrated in the diluted phase (SI Appendix, Fig. S3). (C) Increase in condensate stability by addition of clients in two scenarios. First, a moderate increase in condensate stability is observed upon addition of 33% LV noncompeting clients (cyan triangles). These clients bind to scaffolds with the same strength as the scaffolds’ self-interactions but use alternate binding sites in the scaffold exclusively devoted to scaffold–client interactions. Second, a significant increase in stability of the condensate is observed upon addition of 33% strongly competing clients with higher-than-scaffold valencies (magenta diamonds). The black arrows indicate the direction toward which the critical parameters 1/εprotprotc move upon the addition of clients. Error bars in the phase diagrams are of the same size as or smaller than the symbols. Typical statistical uncertainties are provided in SI Appendix, Table S5. Numerical values of the critical points are given in SI Appendix, Table S2.
Fig. 4.
Fig. 4.
Mechanism of formation of a condensate composed of scaffolds and clients (67% 3-valency scaffolds + 33% 2-valency high-affinity clients) at a value of the normalized inverse interaction strength equal to 0.85 (dashed line in Fig. 3A). Each panel gives a plot of the condensation order parameter for scaffolds (red), QS(L), and clients (blue), QC(L), versus the direction of the largest dimension, L, of the simulation box, as well as the value of the relative enrichment of scaffolds over clients in the newly formed condensates χS/C. Simulation snapshots (scaffolds as red spheres and clients as blue spheres) for the different stages of the condensate-formation process are also provided: (A) initial well-mixed configuration, (B) nucleation, (C) growth, and (D) equilibrium condensate.
Fig. 5.
Fig. 5.
Phase behavior of biomolecular condensates with up to six different types of phase-separating proteins. (A, Left) Cartoon illustrating types of proteins in the mixtures: two types of 4-valency proteins (promiscuous, which we term “M4,” and selective), two types of 3-valency proteins (good, which we term “M3,” and poor topology), a 3-valency protein with one binding site partially deactivated (1/4; 2.25-valency), and a 2-valency protein. The 4-valency promiscuous protein has the largest coexistence region and highest critical temperature and dominates the phase behavior of the mixture. (A, Right) Simulation snapshot showing liquid–liquid coexistence of a six-component equimolar mixture. (B) Phase diagrams of the single-component protein systems showing how the critical point varies with the protein characteristics. The vertical axes in all of the phase diagrams represent the inverse interaction strength normalized by the critical value of the single-component scaffold (1/εSc for the 4-valency promiscuous protein). Note that because 2-valency proteins do not undergo LLPS on their own, a coexistence curve is not shown for such a system. The black arrow indicates the direction of change of the critical parameter 1/εprotprotc as the valency increases. Numerical values of these single-component critical points are given in SI Appendix, Table S2. (C) Phase diagram of a six-component mixture at two different mixing concentrations versus a binary mixture. The binary mixture (blue diamonds) contains 67% 4-valency promiscuous proteins and 33% 3-valency good-topology proteins. The first six-component mixture (cyan triangles) contains 67% 4-valency promiscuous proteins and 33% remaining proteins at equal concentrations (6.6% each). The second six-component mixture (green inverted triangles) is an equimolar mixture, i.e., formed by equal concentrations of all proteins (16.6% each). The black arrow indicates the direction of change of the critical parameter 1/εprotprotc as the concentration of the highest-valency protein in the mixture (in this case M4) increases. Numerical values of the critical points for these systems are given in SI Appendix, Tables S2 and S3. (D) Partitioning coefficient as a function of the normalized critical point (critical inverse interaction energy of each protein in pure form divided over the highest critical value among the set (that for the 4-valency proteins) or, equivalently, critical temperatures of each protein in pure form divided over the highest critical temperature among the set). The partitioning coefficients (defined here as the natural logarithm of the ratio of concentration of a protein in the condensate versus the diluted liquid) were calculated for the equimolar mixture at a constant value of the normalized inverse interaction energy (0.75) depicted by a dotted line in C. (E) Normalized critical points for the proteins in pure form (as defined as in D) plotted as a function of the normalized number of intermolecular protein–protein contacts per unit volume (I/IS) calculated for each independent system in pure form at a constant value of εS/εprotprot=0.8 and finite pressure (SI Appendix, section VIII). The normalization was done by dividing over the highest number of contacts established by a protein in the mixture (the 4-valency protein). Error bars in the phase diagrams are of the same size as or smaller than the symbols. Typical statistical uncertainties are provided in SI Appendix, Table S5.
Fig. 6.
Fig. 6.
Phase behavior of biomolecular condensates with one type of scaffold and two types of client proteins that do not undergo LLPS in pure form. (A) The scaffold is a 4-valency protein that self-interacts and drives LLPS. The two types of clients are 3-valency and 2-valency proteins that exhibit only scaffold–client interactions (no client–client interactions) and can phase separate only when mixed with the scaffolds. (B) Phase diagram of the equimolar multicomponent mixture versus that of the pure scaffold. The black arrow indicates the direction toward which the critical parameter 1/εprotprotc moves upon addition of clients. Numerical values of the critical points of these systems are given in SI Appendix, Table S4. (C) Phase diagrams of binary mixtures consisting of the scaffolds and one type of client each (Top, 3-valency clients; Bottom, 2-valency clients) at two different scaffold–client ratios (33% and 50% clients). For each type of client, we define the parameter Δc as the difference in the normalized critical points of the binary scaffold–client mixture at two client concentrations, i.e., Δc=εSc/(εLowcεHighc), where the subscripts Low and High indicate that the critical point is taken from the low (e.g., 33%) and high (e.g., 50%) client concentrations, respectively. For systems where increasing the client concentrations results in LLPS inhibition (e.g., scaffold–client mixture with 50% of 2-valency clients), we define Δc instead as Δc=εSc/(εLowcεLowmin), where εLowmin is the lowest temperature or largest protein–protein interaction strength that we can explore without observing gelation. Consistent with this definition, Δc for the scaffolds is always equal to zero. The horizontal dashed lines indicate the values of εSc/εLowc (red) and εSc/εHighc (purple) for the 3-valency clients, and εSc/εLowc (blue) and εSc/εLowmin (magenta) for the 2-valency clients. The double-headed arrows illustrate the values of Δc. (D) Partitioning coefficient of the different species in the equimolar mixture versus the order parameter 1Δc determined from the critical points of the different binary mixtures. Error bars in the phase diagrams are of the same size as or smaller than the symbols. Typical statistical uncertainties are provided in SI Appendix, Table S5.

References

    1. Sear R. P., The cytoplasm of living cells: A functional mixture of thousands of components. J. Phys. Condens. Matter 17, S3587–S3595 (2005).
    1. Alberts B., Molecular Biology of the Cell (Garland Science, Taylor and Francis Group, New York, NY, ed. 6, 2015).
    1. Hyman A. A., Weber C. A., Jülicher F., Liquid-liquid phase separation in biology. Annu. Rev. Cell Dev. Biol. 30, 39–58 (2014). - PubMed
    1. Jacobs W. M., Frenkel D., Phase transitions in biological systems with many components. Biophys. J. 112, 683–691 (2017). - PMC - PubMed
    1. Ponomarenko E. A., et al. , The size of the human proteome: The width and depth. Int. J. Anal. Chem. 2016, 1–6 (2016). - PMC - PubMed

Publication types