. 2020 Jun 1;11(1):2717.
doi: 10.1038/s41467-020-16416-0.

Inactivation of Arid1a in the endometrium is associated with endometrioid tumorigenesis through transcriptional reprogramming

Affiliations

Inactivation of Arid1a in the endometrium is associated with endometrioid tumorigenesis through transcriptional reprogramming

Yohan Suryo Rahmanto et al. Nat Commun. .

Abstract

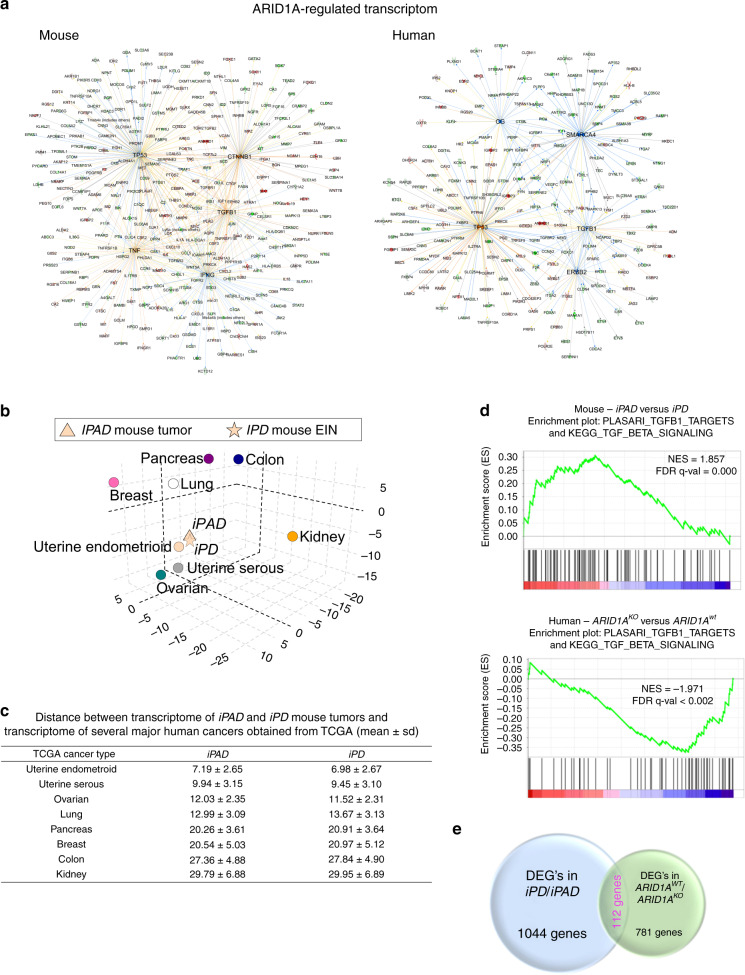
Somatic inactivating mutations of ARID1A, a SWI/SNF chromatin remodeling gene, are prevalent in human endometrium-related malignancies. To elucidate the mechanisms underlying how ARID1A deleterious mutation contributes to tumorigenesis, we establish genetically engineered murine models with Arid1a and/or Pten conditional deletion in the endometrium. Transcriptomic analyses on endometrial cancers and precursors derived from these mouse models show a close resemblance to human uterine endometrioid carcinomas. We identify transcriptional networks that are controlled by Arid1a and have an impact on endometrial tumor development. To verify findings from the murine models, we analyze ARID1AWT and ARID1AKO human endometrial epithelial cells. Using a system biology approach and functional studies, we demonstrate that ARID1A-deficiency lead to loss of TGF-β tumor suppressive function and that inactivation of ARID1A/TGF-β axis promotes migration and invasion of PTEN-deleted endometrial tumor cells. These findings provide molecular insights into how ARID1A inactivation accelerates endometrial tumor progression and dissemination, the major causes of cancer mortality.


Conflict of interest statement

The authors declare no competing interests.

Figures

Fig. 1
Fig. 1. Arid1a deletion promotes endometrial cancer invasion in a Pax8-driven conditional knockout mouse model.
a The strategy in generating tissue-specific, conditional Arid1a knockout mouse models. Mice expressing Pax8-driven Cre (Pax8 rTA; TetO-Cre recombinant) were crossed with Arid1aflox/flox (magenta color) or Ptenflox/flox mice (blue color). Flox-mediated gene recombination is activated by Tetracycline (yellow triangle) or its analog, doxycycline, which induces expression of Cre recombinase (orange color) in Pax8-expressing (green color) tissues. Cre subsequently mediates excision of the floxed gene segment of interest. rTA, reverse tetracycline-controlled transactivator; TetO, tetracycline operator; Cre, Cre recombinase; doxy, doxycycline. b Reported ARID1A and PTEN alterations in uterine endometrioid carcinoma and uterine serous carcinoma subtypes of the TCGA uterine endometrial carcinoma PanCancer Atlas dataset. p-values were determined by one-sided Fischer exact test. q-values were determined by Benjamini–Hochberg FDR correction. c Representative images of iAD, iPD, and iPAD uteri 6 weeks after doxycycline treatment. Local and peritoneal disseminated tumors (blue arrows) were only observed in iPAD mice. UT, uterine.
Fig. 2
Fig. 2. Histopathological characterization of endometrial cancer invasion in Arid1a conditional knockout mouse model.
a Diagram summarizing timeline and the corresponding phenotypes of mice with doxycycline-induced gene knockout in the endometrial epithelium. Pathological assessment was not performed on iPAD mice at weeks 16 and 20 due to cancer-related morbidity and mortality. All iPAD control mice were alive and active at both 16 and 20 weeks. Each circle represents an individual uterine sample. d, day; wk, week. iPAD: inducible Pten and Arid1a deletion; iPD: inducible Pten deletion; iAD: inducible Arid1a deletion. b Representative Pax8 immunohistochemistry (expressed in all epithelial cells of mouse uterine epithelium) highlighting the morphology of normal and lesional endometrial epithelial cells of iAD, iPD, and iPAD mice. Mice were treated with doxycycline for the period indicated at the top right corner. Blue star indicates tumor invasion into stroma. Wks, weeks. Scale bars, 300 µm. c Representative H&E (top 2 images) and Pax8 immunoreactivity (bottom 4 images) comparing morphological features between iPAD and iPD carcinomas at 2 weeks and 16 weeks. S, stromal; M, muscle. Scale bars, 200 µm. d Kaplan–Meier survival plot of iPAD mice with (magenta line) or without (black line) doxycycline-induced deletion. The dotted line indicates median survival. ***p < 0.001; log-rank test. e Metastasis of endometrial carcinoma to peritoneal lymph nodes. Left: gross photo from an iPAD mice 4 weeks after doxycycline treatment. Arrows indicate lymph nodes with tumor metastasis. Photomicrographs: H&E stained slides show invasive endometrial carcinoma in the right uterus (asterisk) (upper panel) and metastatic carcinoma within a representative lymph node (bottom panel).
Fig. 3
Fig. 3. Network and distance analysis of the transcriptome of iPAD and iPD mouse endometrial tumors.
a Interconnected networks of the top six upstream regulators predicted by IPA from the ARID1A-regulated transcriptome in mouse (left) and in human (right). Magenta color indicates transcripts upregulated and green color indicates transcripts downregulated following ARID1A deletion. b Euclidean molecular distance matrix assessing the similarity between transcriptome derived from iPAD mouse uterine tumors, iPD mouse endometrioid intraepithelial neoplasis (EIN), and TCGA transcriptome data obtained from several major types of human cancers. c Euclidean distance between the transcriptome data of mouse endometrial tumors and 7 major types of human cancer from TCGA. The values show the mean and standard deviation of the distances in 3-D principal component analysis space. d Enrichment plots from gene set enrichment analysis (GSEA). GSEA was performed to assess enrichment of TGF-β target gene signature in ARID1A-associated mouse (FDR = 0.000) and human (FDR < 0.002) transcriptomes. NES: normalized enrichment score. FDR values were determined by Benjamini–Hochberg FDR correction. e Venn diagrams of differentially expressed genes (DEGs) in mouse and human transcriptomes. The DEGs between iPAD and iPD mouse tumors and the isogenic pairs of ARID1AWT and ARID1AKO cells were identified in Supplementary Data 1 and Supplementary Data 3, respectively. The numbers of DEGs in each group and the overlap between groups are shown in the Venn diagrams.
Fig. 4
Fig. 4. Loss of ARID1A attenuates response to inhibitory TGF signal resulting in enhanced cell motility and invasion.
a Representative pSmad3 (Ser465/467) immunohistochemical stains of iAD mouse uterine tissues. Staining shows the effect of Arid1a protein loss on pSmad3 (Ser465/467) in doxycycline-treated iAD mice. Mice were treated with doxycycline for 6 weeks. Low magnification images are shown in Supplementary Fig. 4B. Scale bars, 50 µm. b Representative immunoblots showing pSMAD3 (S465/467), total SMAD3, and ARID1A protein expression in ARID1AKO and ARID1AWT cells. GAPDH was used as a loading control. c Densitometric quantification of immunoblot images shown in b showing that ARID1AKO cells lost responsiveness to TGF-β1 in comparison to ARID1AWT cells. Data show the ratio of phospho-SMAD3 to total SMAD3. Data are presented as mean ± SD (n = 3); **p < 0.01; ***p < 0.001; n.s., not significant; repeated measures ANOVA. Green, ARID1AWT; magenta, ARID1AKO; green dotted, ARID1AWT + TGF-β1; magenta dotted, ARID1AKO + TGF-β1. d Measurement of cellular proliferation and cell viability for ARID1AWT and ARID1AKO cells over 72 h. Line graphs show cellular proliferation (left y-axis); ARID1AWT cells (green), ARID1AKO cells (magenta). Cellular viability (right y-axis) is shown as bar graphs; ARID1AWT cells (dark gray), ARID1AKO cells (light gray). Data are expressed as mean ± SEM (n = 3). e Representative images of the wound-healing assay performed on ARID1AWT and ARID1AKO isogenic cells in the absence or presence of TGF-β1 (left panel). The effects were quantified by the distance of the gaps in the wounds (right panel). Yellow arrows indicate the size of the wound. Mean ± SEM (n = 3) is shown in the quantification graph. f Real-time cell impedance assay using the xCELLigence real-time cell analysis system in ARID1AWT and ARID1AKO cells. The capability of cells to invade through the Matrigel matrix barrier to the lower chamber in the absence or presence of TGF-β1 gradient is presented as delta cell index (vertical axis). Mean ± SEM (n = 3) is shown. g Live-cell trajectory tracings showing two-dimensional movement tracks of individual ARID1AWT and ARID1AKO cells in the absence (top panel) or presence (bottom panel) of TGF-β1 gradient. h Scatter plot of the forward migration index in the x-direction (xFMI) of the two-dimensional movement measured in g. Red bars represent mean ± SEM. *p < 0.05; paired two-tailed Student t-test.
Fig. 5
Fig. 5. Integrated analysis of ChIP-seq and RNA-seq data from isogenic ARID1AWT and ARID1AKO cells.
a Heatmaps of the ARID1A, BRG1, and RNA polymerase II ChIP-seq peaks as well as ATAC-seq peaks in ARID1AWT (WT) and ARID1AKO (KO) cells. Each peak is represented as a horizontal line, ordered vertically by signal strength. ARID1A ChIP-seq peak signals were minimal in ARID1AKO cells, demonstrating the specificity of the antibody and the experimental conditions. b Co-localization coefficient matrix of ARID1A and BRG1 ChIP-seq peaks in ARID1AWT and ARID1AKO cells. The strength of correlation is presented by color gradient. Dark blue to dark red: highest to no correlation. AR-CST, ARID1A antibody from Cell Signaling Technology. c Heatmaps showing overlapping frequencies of ARID1A ChIP-seq target peaks (top) and SWI/SNF ChIP-seq target peaks (bottom) with ChIP-seq peaks from various target proteins. The rightmost box (ATAC-seq) represents the number of co-localization events between accessible chromatin regions identified by ATAC-seq and ARID1A ChIP-seq target peaks. The strength of peak co-localization is depicted by color gradient with dark red representing overlapping peaks and dark blue representing disjoint peaks. d Venn diagram showing ARID1A directly regulated genes by integrated SWI/SNF ChIP-seq and ARID1A-regulated transcriptome analyzed in human endometrial epithelial cells. A total of 594 ARID1A direct target genes were identified. e UCSC genome browser view of ARID1A. BRG1, and RNA polymerase II occupancy and ATAC-seq event at the locus of representative ARID1A target genes. Each track represents normalized ChIP-seq (or ATAC-seq) events as described in the methods. ARID1AKO cells were used as a control for each factor. ChIP-seq binding events and ATAC-seq tracings at the locus of representative ARID1A target genes. Blue arrow indicates the transcriptional orientation of each gene.

References

    1. Mashtalir N, et al. Modular organization and assembly of SWI/SNF family chromatin remodeling complexes. Cell. 2018;175:1272–1288 e1220. - PMC - PubMed
    1. Skulte KA, Phan L, Clark SJ, Taberlay PC. Chromatin remodeler mutations in human cancers: epigenetic implications. Epigenomics. 2014;6:397–414. - PubMed
    1. Masliah-Planchon J, Bieche I, Guinebretiere JM, Bourdeaut F, Delattre O. SWI/SNF chromatin remodeling and human malignancies. Annu Rev. Pathol. 2015;10:145–171. - PubMed
    1. Wang X, Haswell JR, Roberts CW. Molecular pathways: SWI/SNF (BAF) complexes are frequently mutated in cancer–mechanisms and potential therapeutic insights. Clin. Cancer Res. 2014;20:21–27. - PMC - PubMed
    1. Guan B, Wang TL, Shih IM. ARID1A, a factor that promotes formation of SWI/SNF-mediated chromatin remodeling, is a tumor suppressor in gynecologic cancers. Cancer Res. 2011;71:6718–6727. - PMC - PubMed

Publication types

MeSH terms