Randomized Controlled Trial
. 2020 Jun 1;11(1):2703.
doi: 10.1038/s41467-020-16582-1.

Analysis of immune, microbiota and metabolome maturation in infants in a clinical trial of Lactobacillus paracasei CBA L74-fermented formula

Affiliations
Randomized Controlled Trial

Analysis of immune, microbiota and metabolome maturation in infants in a clinical trial of Lactobacillus paracasei CBA L74-fermented formula

Paola Roggero et al. Nat Commun. .

Abstract

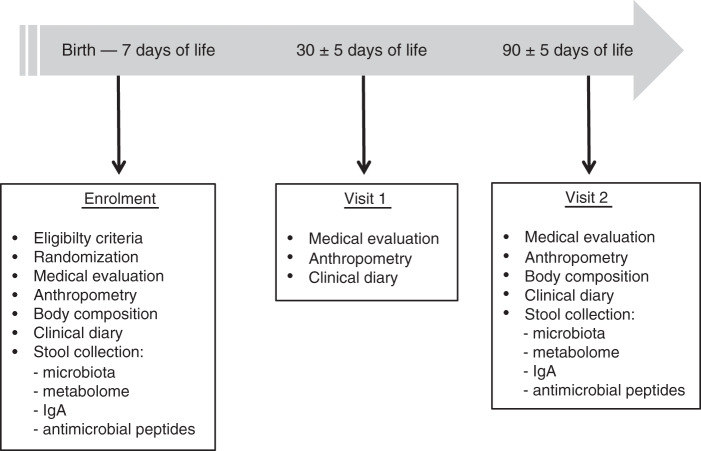
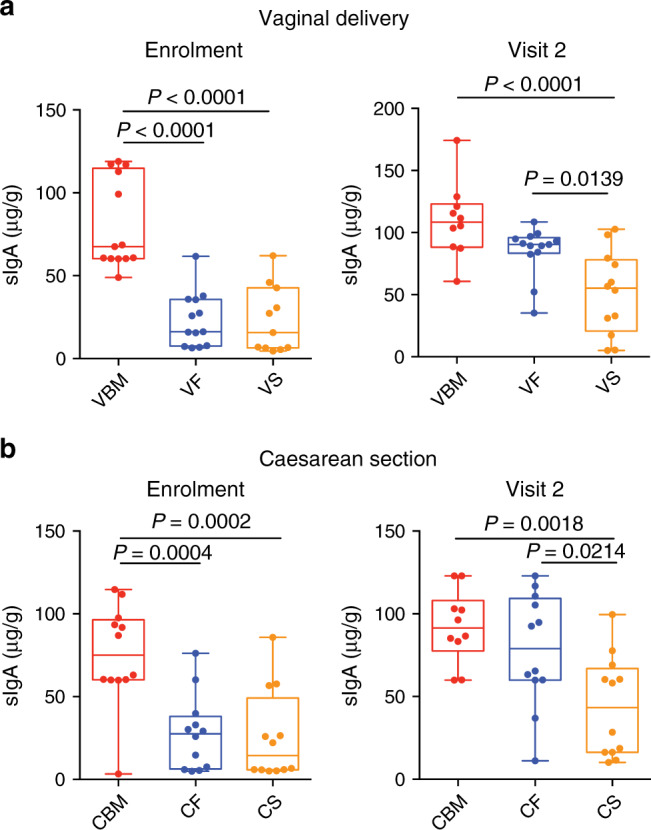
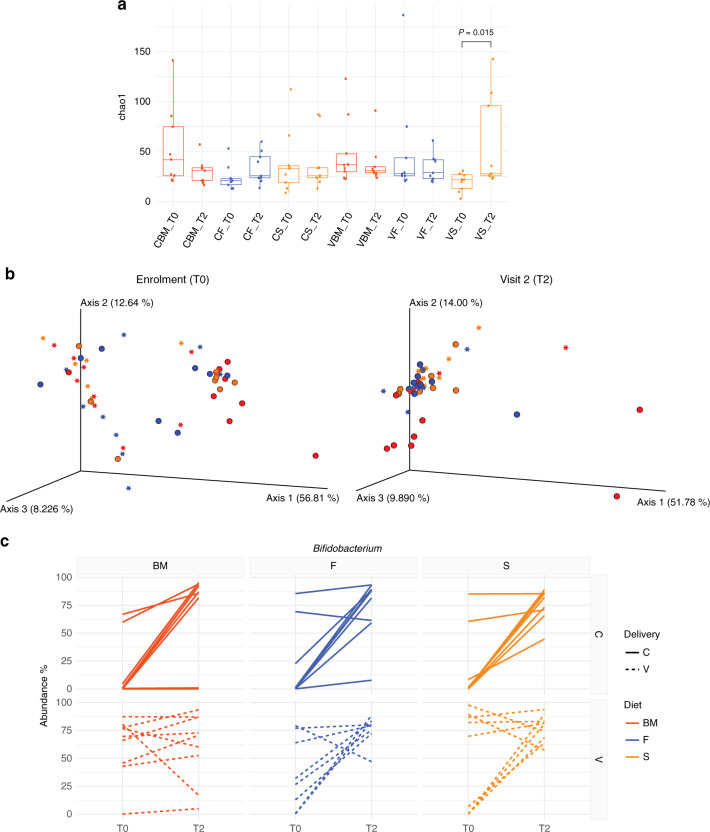
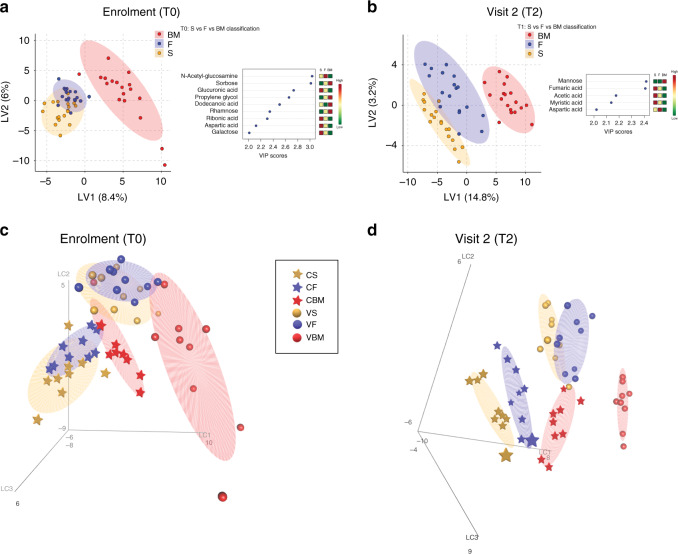
Mother's milk is the best choice for infants nutrition, however when it is not available or insufficient to satisfy the needs of the infant, formula is proposed as an effective substitute. Here, we report the results of a randomized controlled clinical trial (NCT03637894) designed to evaluate the effects of two different dietary regimens (standard formula and Lactobacillus paracasei CBA L74-fermented formula) versus breastfeeding (reference group) on immune defense mechanisms (primary endpoint: secretory IgA, antimicrobial peptides), the microbiota and its metabolome (secondary outcomes), in healthy full term infants according to the type of delivery (n = 13/group). We show that the fermented formula, safe and well tolerated, induces an increase in secretory IgA (but not in antimicrobial peptides) and reduces the diversity of the microbiota, similarly, but not as much as, breastmilk. Metabolome analysis allowed us to distinguish subjects based on their dietary regimen and mode of delivery. Together, these results suggest that a fermented formula favors the maturation of the immune system, microbiota and metabolome.


Conflict of interest statement

This work was sponsored by Heinz Italia S.p.A. As an employee of Heinz Italia S.p.A., A.B. has contributed technologically in adapting the fermentation process to the generation of the fermented formula for infant use, and the sponsor has provided the two formulas (standard and fermented) for the study. Moreover, the sponsor has contributed funding for biological assays, including ELISA, kits and –OMICS analyses. A.B. did not play any role in study design, analysis or writing of the paper (except for the methodological section on the formulas). The remaining authors declare no competing interests.

Figures

Fig. 1
Fig. 1. Study procedures.
Procedures related to collection of biological samples, medical evaluation and anthropometric measurements are shown in a timeline.
Fig. 2
Fig. 2. Fermented formula drives sIgA production similarly to breastfeeding.
a, b sIgA levels according to mode of delivery (vaginal in a and caesarean section in b) and type of feeding were determined in faecal samples. n = 13 (VBM and VF) and n = 12 (VS, CBM, CS and CF) biologically independent samples. Significance determined by one-way ANOVA using TukeyHSD post hoc test. Box plots show the interquartile range (IQR), the horizontal lines show the median values and the whiskers indicate the minimum-to-maximum range. CBM caesarean delivery breast milk feeding, CF caesarean delivery fermented formula feeding, CS caesarean delivery standard formula feeding, VBM vaginal-delivery breast milk feeding, VF vaginal-delivery fermented formula feeding, VS vaginal-delivery standard formula feeding. Source data are provided as a Source Data file.
Fig. 3
Fig. 3. Fermented formula but not standard formula reduces microbiota diversity over time.
a Chao1 index of bacterial α-diversity of the faecal microbiota of infants at enrolment (T0) and visit 2 (T2). Significance determined by Wilcoxon signed-rank test for repeated measurements (two-tailed). Box plots show the interquartile range (IQR), the horizontal lines show the median values and the whiskers extend from the hinge no further than 1.5*IQR. CBM: caesarean delivery breast milk feeding, CF caesarean delivery fermented formula feeding, CS caesarean delivery standard formula feeding, VBM vaginal-delivery breast milk feeding, VF vaginal-delivery fermented formula feeding, VS vaginal-delivery standard formula feeding. b PCoA analysis of weighted UniFrac distance (β-diversity) of gut microbial communities according to the mode of delivery (caesarean—star; vaginal—sphere) and the type of feeding (BM—red; F—blue; S—orange). Left, enrolment; right, visit 2. c Interaction plots of Bifidobacterium abundance according to diets and delivery mode at T0 and T2. Each line represents individual newborns (solid lines caesarean delivery, C; dotted lines vaginal delivery, V). Significance determined accounting for individual baselines with a linear mixed model and ANOVA to test the interaction between groups and time, P = 0.011. BM breast milk feeding, F fermented formula feeding, S standard formula feeding. Source data of panels a and c are provided as a Source Data file.
Fig. 4
Fig. 4. Metabolome clearly distinguishes newborns based on their dietary regimen.
a, b Metabolomic assessment at enrolment (a) and at visit 2 (b) according to the type of feeding. Left, a PLS-DA analysis is shown separating infants breastfed (BM, red dots), fed formula F (F, blue dots), or formula S (S, orange dots). On the right are shown those metabolites that differentiate the three diets (VIP score > 2) and their mean relative concentration. c, d Metabolomic assessment (PLS-DA 3D) at enrolment (c) and at visit 2 (d) according to the type of feeding (BM—red; F—blue; S—orange) and mode of delivery (caesarean—star; vaginal—sphere). CBM caesarean delivery breast milk feeding, CF caesarean delivery fermented formula feeding, CS caesarean delivery standard formula feeding, VBM vaginal-delivery breast milk feeding, VF vaginal-delivery fermented formula feeding, VS vaginal-delivery standard formula feeding.
Fig. 5
Fig. 5. Microbe–metabolite correlation heatmap showing associations between bacterial genus and the ANOVA and VIP-score-selected metabolites.
Spearman correlation coefficients were calculated for pairwise combinations of microbial abundances at the genus level (from 16S rRNA gene sequencing data) and metabolite intensities. In red boxes are reported clusters of metabolites either enriched (box 1) or reduced (box 2) in vaginally delivered breastfed infants. Box 2 metabolites are associated with genera highly abundant in breastfed infants; in orange boxes (3 and 4) are highlighted clusters of metabolites that are enriched in formula S-fed infants. The corresponding genera correlating with these metabolites are also highlighted with the same colour and numbering code.

References

    1. Howie PW. Protective effect of breastfeeding against infection in the first and second six months of life. Adv. Exp. Med. Biol. 2002;503:141–147. - PubMed
    1. Lewis ZT, Mills DA. Differential establishment of bifidobacteria in the breastfed infant gut. Nestle Nutr. Inst. Workshop Ser. 2017;88:149–159. - PMC - PubMed
    1. Jakaitis BM, Denning PW. Human breast milk and the gastrointestinal innate immune system. Clin. Perinatol. 2014;41:423–435. - PMC - PubMed
    1. Stevens EE, Patrick TE, Pickler R. A history of infant feeding. J. Perinat. Educ. 2009;18:32–39. - PMC - PubMed
    1. Thompson AL, Monteagudo-Mera A, Cadenas MB, Lampl ML, Azcarate-Peril MA. Milk- and solid-feeding practices and daycare attendance are associated with differences in bacterial diversity, predominant communities, and metabolic and immune function of the infant gut microbiome. Front Cell Infect. Microbiol. 2015;5:3. - PMC - PubMed

Publication types

Associated data