. 2020 Jun 1;11(1):2714.
doi: 10.1038/s41467-020-16423-1.

Defective NADPH production in mitochondrial disease complex I causes inflammation and cell death

Affiliations

Defective NADPH production in mitochondrial disease complex I causes inflammation and cell death

Eduardo Balsa et al. Nat Commun. .

Abstract

Electron transport chain (ETC) defects occurring from mitochondrial disease mutations compromise ATP synthesis and render cells vulnerable to nutrient and oxidative stress conditions. This bioenergetic failure is thought to underlie pathologies associated with mitochondrial diseases. However, the precise metabolic processes resulting from a defective mitochondrial ETC that compromise cell viability under stress conditions are not entirely understood. We design a whole genome gain-of-function CRISPR activation screen using human mitochondrial disease complex I (CI) mutant cells to identify genes whose increased function rescue glucose restriction-induced cell death. The top hit of the screen is the cytosolic Malic Enzyme (ME1), that is sufficient to enable survival and proliferation of CI mutant cells under nutrient stress conditions. Unexpectedly, this metabolic rescue is independent of increased ATP synthesis through glycolysis or oxidative phosphorylation, but dependent on ME1-produced NADPH and glutathione (GSH). Survival upon nutrient stress or pentose phosphate pathway (PPP) inhibition depends on compensatory NADPH production through the mitochondrial one-carbon metabolism that is severely compromised in CI mutant cells. Importantly, this defective CI-dependent decrease in mitochondrial NADPH production pathway or genetic ablation of SHMT2 causes strong increases in inflammatory cytokine signatures associated with redox dependent induction of ASK1 and activation of stress kinases p38 and JNK. These studies find that a major defect of CI deficiencies is decreased mitochondrial one-carbon NADPH production that is associated with increased inflammation and cell death.


Conflict of interest statement

The authors declare no competing interests.

Figures

Fig. 1
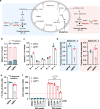
Fig. 1. Identification of ME1 through a gain-of-function CRISPR/Cas9 screen.
a Schematic overview of the genome-wide CRISPR activator screen. b Scatterplot showing gene enrichment after galactose challenge using two independent library replicate sets . Highlighted in blue is GALT gene, which represents the rate-limiting enzyme in galactose-to-glucose conversion. c Volcano plot highlighting ME1 (red dot) as the best scoring gene (left) and the top 10 scoring genes ranked by significance. d Specific mRNA and protein induction of ME1 using two different guides in ND1 mutant cells (n = 3). e Cell survival and proliferation curves in ME1-overexpressing ND1 mutant cells under galactose (n = 3). f Cell survival in ME1-overexpressing ND1 mutant cells cultured under galactose media for 96 h in the presence or absence of glutamine (4 mM), glutamate (4 mM), or pyruvate (1 mM) (n = 3). g ME1 catalyzes the decarboxylation of malate to pyruvate generating NADPH. Immunoblots shown are representative of >3 independent experiments, and all other experiments are represented as means ± SEM., n > 3 biological replicates. Asterisks denote *p < 0.05, **p < 0.01, or ***p < 0.001. Paired two-tailed Student’s t test in d, e and two-way ANOVA in f. Pyr pyruvate, Gln glutamine, Glut glutamate. Red dashed lines indicate initial seeding density.
Fig. 2
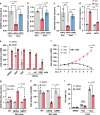
Fig. 2. ME1 induction promotes reductive carboxylation of glutamine.
a Model illustrating the fate of fully labeled 13C glutamine after entering the TCA cycle. Glutamine oxidation generates M + 4 labeled substrates while its reductive carboxylation generates M + 3 labeled substrates. Note that ME1 activity is coupled to NADPH production and reduction of oxidized glutathione. b Percentage of labeled and unlabeled malate in ND1 mutant cells after 3 h incubation with 13C-labeled ([U-13C5]) glutamine (n = 3). c Isotopomer distribution of malate in sgNeg and sgME1 ND1 mutant cells cultured in the presence of 13C glutamine for 3 h (n = 3). d ME1 overexpression decreases malate M + 4 originated by oxidation of glutamine in the TCA cycle and increases malate M + 3 coming from reductive carboxylation of glutamine (n = 3). e 14C glutamine oxidation is reduced in ND1 mutant cells overexpressing ME1 (n = 3). f Supplementation of cell permeable dimethyl-malate (DM-malate), at the indicated doses, did not increase survival of ND1 under galactose conditions (n = 3). Experiments are represented as means ± SEM., n > 3 biological replicates. Asterisks denote *p < 0.05, **p < 0.01, or ***p < 0.001. Paired two-tailed Student’s t test in d, e and one-way ANOVA in f. Red dashed lines indicate initial seeding density.
Fig. 3
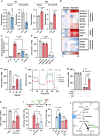
Fig. 3. Complex I disease mutations reduce levels of NADPH and GSH and cause oxidative stress.
a Relative NADPH levels analyzed by LC-MS, b NADPH/NADP+ ratio, c GSH/GSSG ratio, and d relative reactive oxygen species (ROS) levels measured using dichlorodihydrofluorescein diacetate (H2DCFDA) in sgNeg and sgME1 ND1 mutant cells cultured under glucose or galactose conditions for 48 h (n = 3). e Cell number of galactose-grown ND1 cells (96 h) supplemented with GSH (2 mM), NAC (4 mM), or the indicated doses of MitoQ (n = 3). fi Growth curves in galactose-grown ND1 cells treated with GSH or NAC. 6-Aminonicotinamide (6-AN) (100 μM) was used to inhibit PPP (n = 3), and g ROS levels, h cell number, and i H2O2-induced cell death was assessed after 48 h in WT cells (n = 3). Experiments are represented as means ± SEM., n > 3 biological replicates. Asterisks denote *p < 0.05, **p < 0.01, or ***p < 0.001. Two-way ANOVA in ad, gi and paired two-tailed Student’s t test in e, f. Gluc glucose, Galac galactose. Red dashed lines indicate initial seeding density.
Fig. 4
Fig. 4. Mitochondrial one-carbon metabolism is linked to functional ETC activity.
a Relative levels of intracellular serine and 5,10-methylenetetrahydrofolate (5,10-meTHF) in WT and ND1 mutant cells cultured either in glucose or galactose for 24 h and analyzed by LC-MS (n = 3). b Proteomics heatmap in WT cells exhibiting relative expression (log2 fold change) of proteins differentially regulated under 48 h galactose. c Measurement of formate production from serine using isolated mitochondria from WT, ND1, or SHMT2Δ cells (n = 4). d Cell number of WT, SHMT1Δ, and SHMT2Δ cell culture in galactose for 96 h (n = 3). e ME1 overexpression and 2 mM GSH supplementation rescues cell survival in galactose-grown SHMT2Δ cells (n = 3). f Seahorse analysis in WT sgNeg and SHMT2Δ in the absence or presence of 1 mM formate (n = 5). g GSH but not formate rescued cell survival in SHMT2Δ cells (n = 3). h GSH rescued cell number in ALDH1L2Δ cells cultured in galactose (n = 3). i ALDH1L2 converts 10-formyltetrahydrofolate to tetrahydrofolate and carbon dioxide in an NADP+-dependent reaction. ND1 cells display decreased serine-derived CO2 release compared to WT cells. ALDH1L2Δ cells were used as positive control (left panel). Galactose stimulated serine-derived CO2 release in WT cells but not in CI-deficient ND1 mutant cells (right panel) (n = 3). j Model illustrating the dependency of mitochondrial one-carbon metabolism on ETC function for NADPH production and how upregulation of ALDH1L2 stimulates NAPDH production in glucose-free conditions. Immunoblots shown are representative of >3 independent experiments, and all other experiments are represented as means ± SEM, n > 3 biological replicates. Asterisks denote *p < 0.05, **p < 0.01, or ***p < 0.001. Paired two-tailed Student’s t test in a and two-way ANOVA in cj. Gluc glucose, Galac galactose, ser serine, Gly glycine, THF tetrahydrofolate, Pir Piericidin, Oligo oligomycin, Rot rotenone, Ant antimycin A. EV denotes empty vector. Red dashed lines indicate initial seeding density.
Fig. 5
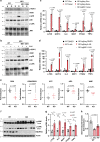
Fig. 5. Complex I inhibition, in vitro and in vivo, is associated with an inflammatory gene response caused by increased oxidative stress.
Immunoblots showing oxidative stress-mediated activation of ASK1/P38/JNK axis specifically in ND1 mutant cells a cultured in galactose or b after PPP inhibition using 6-AN at 100 μM for 48 h. Pro-inflammatory gene expression signature is induced in c 48 h galactose-grown or d PPP-inhibited ND1 cells and rescue by ME1 overexpression (n = 3). e Metabolomic analysis in brain samples of WT and Ndufs4 KO mice. Note that levels of GSH are reduced, while no changes are observed in ATP. GSH/GSSG ratio for WT is 4.3920 +/− 0.9039 (Average +/− Standard) (n = 5). f Increased phosphorylation of JNK (including long and short exposures) and g induced gene expression of inflammatory markers in the brain of Ndufs4 KO mice. h Reduced formate production using brain-isolated mitochondria from WT or Ndufs4 KO mice (n = 4). Immunoblots shown are representative of >3 independent experiments, and all other experiments are represented as means ± SEM., n > 3 biological replicates. Asterisks denote *p < 0.05, **p < 0.01, or ***p < 0.001. Two-way ANOVA in c, d, h. Paired two-tailed Student’s t test in e, g and one-way ANOVA in h. gluc/g glucose, Galac/G galactose, Pir Piericidin.
Fig. 6
Fig. 6. Model depicting how inhibition of PPP-generated NADPH is compensated in WT cells by enhancing mitochondrial one-carbon metabolism and induction of ALDH1L2.
Cells with defects in complex I displayed reduction of serine catabolism and concomitant NADPH production, which reduced GSH levels and increased oxidative stress, inflammation, and cell death. ME1 overexpression is able to rescue redox imbalance by acting as a potent source of NADPH and represents a potential therapeutic target to treat disorders associated with ETC dysfunction.

Similar articles

Cited by

References

    1. Gohil VM, et al. Nutrient-sensitized screening for drugs that shift energy metabolism from mitochondrial respiration to glycolysis. Nat. Biotechnol. 2010;28:249–255. doi: 10.1038/nbt.1606. - DOI - PMC - PubMed
    1. Arroyo JD, et al. A genome-wide CRISPR death screen identifies genes essential for oxidative phosphorylation. Cell Metab. 2016;24:875–885. doi: 10.1016/j.cmet.2016.08.017. - DOI - PMC - PubMed
    1. Kruse SE, et al. Mice with mitochondrial complex I deficiency develop a fatal encephalomyopathy. Cell Metab. 2008;7:312–320. doi: 10.1016/j.cmet.2008.02.004. - DOI - PMC - PubMed
    1. Diaz F, Thomas CK, Garcia S, Hernandez D, Moraes CT. Mice lacking COX10 in skeletal muscle recapitulate the phenotype of progressive mitochondrial myopathies associated with cytochrome c oxidase deficiency. Hum. Mol. Genet. 2005;14:2737–2748. doi: 10.1093/hmg/ddi307. - DOI - PMC - PubMed
    1. Pilz YL, Bass SJ, Sherman J. A review of mitochondrial optic neuropathies: from inherited to acquired forms. J. Optom. 2017;10:205–214. doi: 10.1016/j.optom.2016.09.003. - DOI - PMC - PubMed

Publication types

MeSH terms