. 2020 Jun 1;11(1):2739.
doi: 10.1038/s41467-020-16602-0.

Immunotherapy with engineered bacteria by targeting the STING pathway for anti-tumor immunity

Affiliations

Immunotherapy with engineered bacteria by targeting the STING pathway for anti-tumor immunity

Daniel S Leventhal et al. Nat Commun. .

Abstract

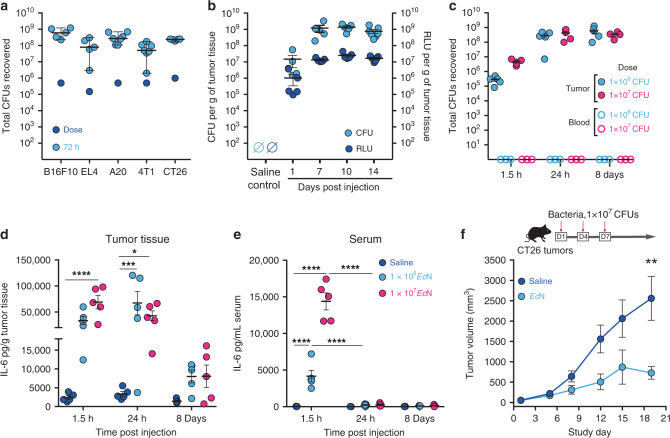
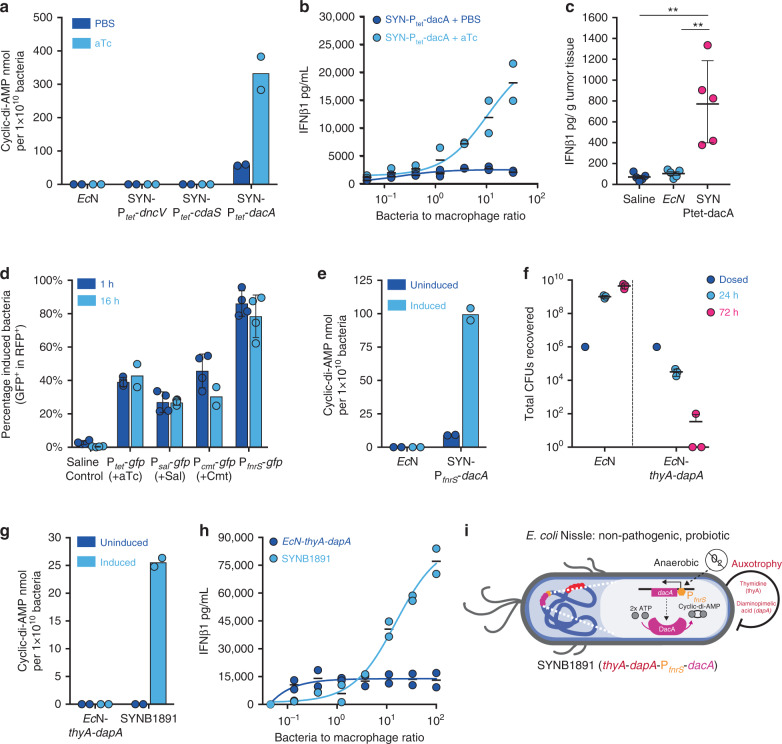
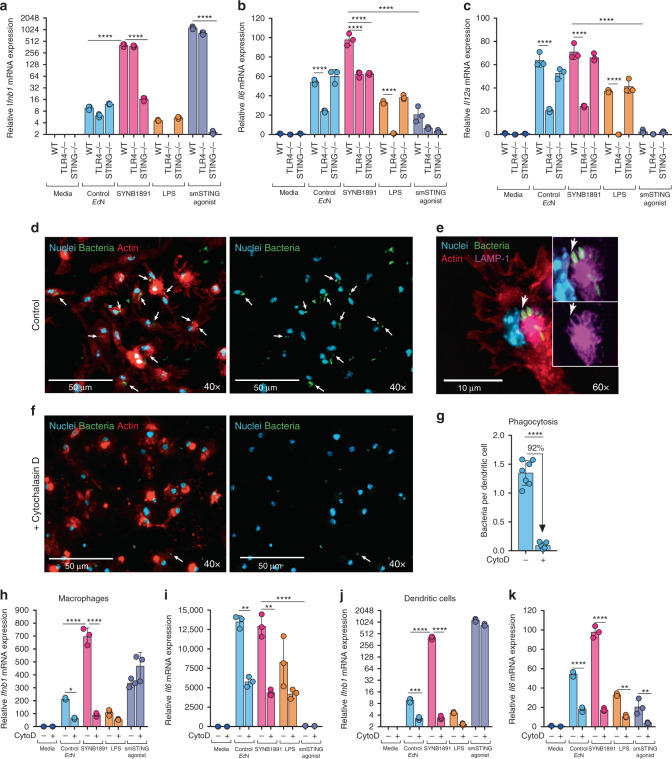
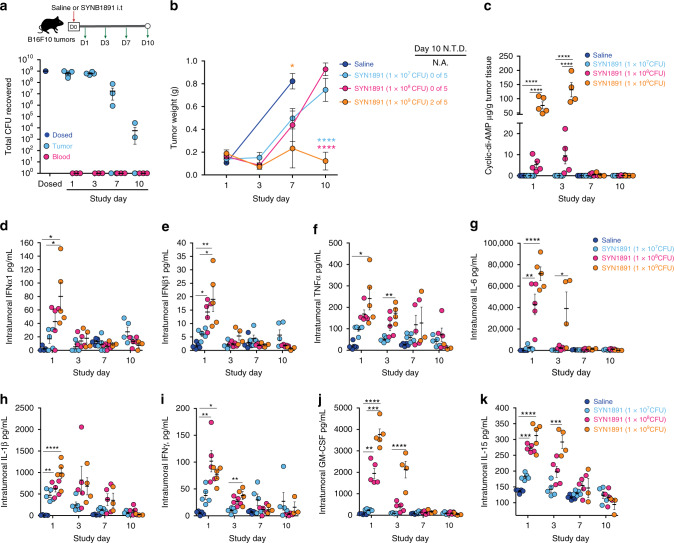
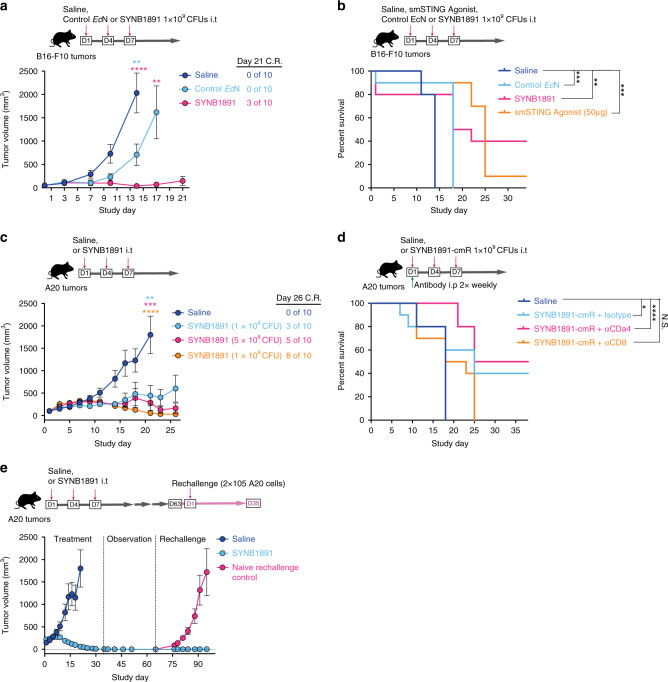
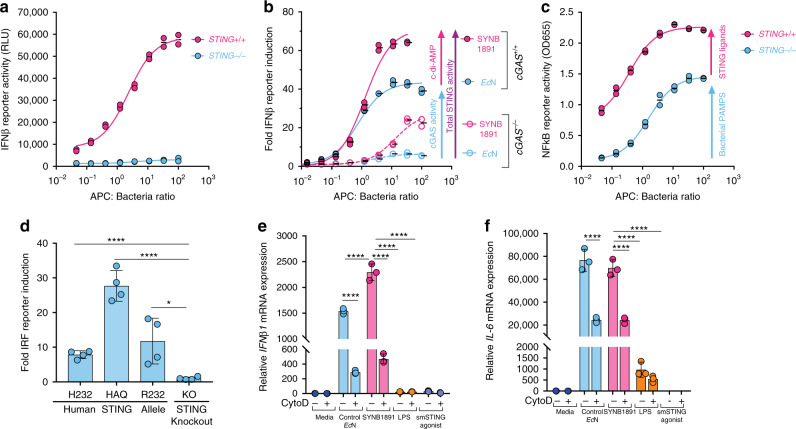
Synthetic biology is a powerful tool to create therapeutics which can be rationally designed to enable unique and combinatorial functionalities. Here we utilize non-pathogenic E coli Nissle as a versatile platform for the development of a living biotherapeutic for the treatment of cancer. The engineered bacterial strain, referred to as SYNB1891, targets STING-activation to phagocytic antigen-presenting cells (APCs) in the tumor and activates complementary innate immune pathways. SYNB1891 treatment results in efficacious antitumor immunity with the formation of immunological memory in murine tumor models and robust activation of human APCs. SYNB1891 is designed to meet manufacturability and regulatory requirements with built in biocontainment features which do not compromise its efficacy. This work provides a roadmap for the development of future therapeutics and demonstrates the transformative potential of synthetic biology for the treatment of human disease when drug development criteria are incorporated into the design process for a living medicine.


Conflict of interest statement

All authors are or were employees of Synlogic, Inc.

Figures

Fig. 1
Fig. 1. E coli. Nissle is a versatile platform for localized modulation of the tumor microenvironment.
a Initial dose and bacterial abundance within tumor homogenates at 72 h post-intratumoral (i.t.) injection with ~1 × 10⁶ CFU of EcN from the indicated tumor model as measured by colony forming unit (CFU) assay (B16F10, EL4, CT26 n = 5 mice per group, A20, 4T1 n = 7 mice per group). Data are representative of two independent experiments. b Bacterial abundance measured by CFU (left axis) and relative bioluminescent units (RLU) (right axis) from CT26 tumors at the indicated time points post-i.t. injection of n = 5 mice with 1 × 10⁶ CFU of EcN-LuxABCDE compared to saline injected controls. Data are representative of two independent experiments. ce CT26 tumor-bearing mice (n = 5 per group) were treated i.t. once with indicated doses of bacteria. Bacterial abundance within tumor homogenates (filled in circle) or blood (hollow circle) for mice treated with 1 × 10⁶ or 1 × 10⁷ CFUs EcN (c), and IL-6 quantification from tumor (d) and serum (e) shown at the indicated time points (*P = 0.0175, ***P = 0.0001, ****P < 0.0001, two-way ANOVA with Tukey’s multiple comparisons tests). Data are representative of two independent experiments. f Representative tumor growth data for CT26 tumor-bearing mice i.t. treated with either saline control or 1 × 10⁷ CFUs of EcN (n = 9 mice per saline and n = 7 mice per EcN group) on days 1, 4 and 7 (**P = 0.0062, two-tailed unpaired Student’s t test comparing saline vs EcN treated groups on day 19 of study). Individual tumor volumes are presented in Supplementary Fig. 1d. Data are representative of three independent experiments Each circle in (ae) represents an individual animal. af Data are mean with s.e.m.
Fig. 2
Fig. 2. Engineering a STING agonist-producing live therapeutic (SYNB1891).
a Cyclic di-AMP (CDA) abundance from bacterial cell pellets of the indicated strains cultured with PBS (non-induced) or 100 ng/mL aTc (induced) for 4 h. Data are representative of three independent experiments. b IFNβ1 production by RAW 264.7 cells co-cultured for 4 h with non-induced (+PBS) or pre-induced (+aTc) SYN-Ptet-dacA. c B16.F10 tumor-bearing mice were i.t.-injected with 1 × 10⁶ CFUs of EcN or SYN-pTet-dacA bacteria, or saline control (n = 5 mice per group). Four hours later all mice received 10 μg aTc intraperitoneally. Intratumoral IFNβ1 is shown at 24 h post-injection (**P = 0.0011 (vs saline), **P = 0.0016 (vs EcN), one-way ANOVA with Tukey’s multiple comparisons tests). Additional data are shown in Supplementary Fig. 2a–e. d B16.F10 tumor-bearing mice were i.t.-injected with saline or 5 × 10⁶ CFUs of bacterial strains containing a constitutively expressed mCherry (RFP) and inducible GFP (n = 4 mice per group except n = 2 for groups 16 h Ptet-gfp and 16 h Pcmt-gfp). To induce GFP mice were injected with either saline (control), aTc, sodium salicylate (Sal) or p-isopropylbenzoate (Cmt). Percentage of induced bacteria (GFP+ among RFP+ cells) in tumors is shown at indicated times post-induction. e CDA abundance from bacterial cell pellets of the indicated strains cultured under aerobic (uninduced) or anerobic (induced) conditions. f Total CFUs recovered from B16.F10 tumors i.t.-injected with 1 × 10⁶ CFUs of either prototrophic EcN or a strain containing dual thyA and dapA auxotrophies at the indicated time-points (n = 3 mice per group per time point). g CDA abundance from bacterial cell pellets of the indicated strains cultured under aerobic (uninduced) or anerobic (induced) conditions. Data are representative of five independent experiments. h IFNβ1 production from 4-h macrophage and bacterial cell co-cultures, as described in (b), with the indicated bacterial strains. i Schematic of the finalized SYNB1891 bacteria strain containing all engineering components. a, b, g, h n = 2 biological replicates per group per time point. c, d, f Mean and s.d. shown. bf, h Data are representative of two independent experiments. Each circle represents an individual animal or independent experimental replicate.
Fig. 3
Fig. 3. Phagocytosis- and STING-dependent induction of type I interferon by SYNB1891.
ac WT, TLR4−/− and STING−/− BMDCs were treated with Control EcN (MOI: 25), pre-induced SYN1891 (MOI: 25), LPS (100 ng/mL), or smSTING agonist (5 μg/mL) for 4 h (n = 3 biological replicates per group per genotype). BMDCs from each genotype incubated alone served as negative controls. Cells were analyzed for the upregulation of Ifnb1 (a), Il6 (b) and Il12a (c) mRNA (****P < 0.0001 two-way ANOVA with Tukey’s multiple comparisons tests, see Supplementary Fig. 3a for IFN-β1 protein quantification). dg Representative fluorescent images and phagocytosis quantification. WT BMDCs were incubated with pre-induced SYNB1891-gfp (MOI: 25) for 1 h in control media (d, e) or pre-treated for 1 h with Cytochalasin D (10 μM) before bacterial incubation (f). Non-internalized bacteria were washed out and cells were stained for microscopy. Cell nuclei were labeled with Hoechst (Blue), F-actin was stained with ActinRed 555 probe (Red), SYNB1891-gfp were labeled with anti-GFP (Green), and phagosomal transmembrane protein LAMP-1 was labeled with anti-LAMP1 (Purple). White arrows point to bacteria co-localized within DC actin cytoskeleton (df). These bacteria are surrounded by phagosomal membrane stained with LAMP-1 (e). The number of bacteria per dendritic cell per field of view (FOV) was quantified in (g). 12 FOVs were evaluated in the experiment (7 for control and 5 for CytoD group) resulting in >200 cells per treatment quantified (**P < 0.0001, two-tailed unpaired Student’s t test). Images and data are representative of 2 independent experiments. h, i RAW 264.7 macrophages or (j, k) WT BMDCs were treated as described above in (a) (n = 3 biological replicates per group). In the indicated groups cells were pre-treated for 1 h with Cytochalasin D (10 μM). Macrophages or BMDCs incubated in media alone served as a negative control. Cells were analyzed for the upregulation of Ifnb1 (g, i) and Il6 (h, j) mRNA (*P = 0.0182, **P = 0.0017–0.006, ***P = 0.0005, ****P < 0.0001 two-way ANOVA with Tukey’s multiple comparisons tests, see Supplementary Fig. 3h–k for protein quantification,). ac, gk Data are representative of two or more independent experiments per cell type with mean and s.d. shown. Each circle represents an independent experimental replicate.
Fig. 4
Fig. 4. In vivo dynamics of SYNB1891 in tumor bearing mice.
ak B16.F10 tumor-bearing mice were treated with a single i.t. dose of either saline, 1 × 10⁷, 1 × 10⁸ or 1 × 10⁹ CFUs SYNB1891 on Study Day 0 (n = 5 injected mice per bacterial group per time point, for Saline group n = 5 injected mice for day 1 and day 7 analyzes, for the bacterial group 1 × 10⁹ CFUs SYNB1891 for day 3 n = 4 analyzed tumors, for days 7 and 10 n = 3 analyzed tumors due to no visible tumor mass upon dissection). a Bacterial abundance within tumor homogenates and blood at the indicated timepoints post-i.t. injection with 1 × 10⁹ CFUs (see Supplementary Fig. 4b, c for 1 × 10⁷ and 1 × 10⁸ doses). b Total tumor weight for treated mice at the indicated time points with mice having no visible tumor mass upon dissection (no tumor detected (N.T.D)) on Study day 10 (* P = 0.0163 (orange stars—indicated group vs 1 × 10⁹ CFUs SYNB1891), one-way ANOVA with Tukey’s multiple comparisons tests for Day 7; ****P < 0.0001 (blue stars—indicated group vs 1 × 10⁸ CFUs SYNB1891, pink stars—indicated group vs 1 × 10⁷ CFUs SYNB1891) two-way ANOVA for bacterial groups with Tukey’s multiple comparisons tests). Individual tumor volumes are presented in Supplementary Fig. 4a). c Cyclic-di-AMP abundance from tumor homogenates, and, (dk), cytokine abundance from tumor supernatants for IFNα1 (d), IFNβ1 (e), TNFα (f), IL-6 (g), IL-1β (h), IFNγ (i), GM-CSF (j) and IL-15 (k) from treated mice at the indicated time points post-i.t injection (*P = [0.016–0.031], **P = [0.0011–0.0041], ***P = [0.0001–0.0003], ****P < 0.0001 one-way ANOVA with Tukey’s multiple comparisons tests at indicated time points). Data are representative of two independent experiments with mean and s.e.m. shown. Each circle in (a) and (ck) represents an individual animal.
Fig. 5
Fig. 5. SYNB1891 treatment triggers efficacious antitumor immunity and immunological memory.
a On Study days 1, 4, and 7, B16.F10 tumor-bearing mice were treated i.t. with either saline (control), SYNB1891 or Control EcN lacking the Pfnrs-dacA circuit. Tumor growth data is shown with the ratio of complete responders (C.R.). (**P = 0.0058 (blue stars—indicated group vs EcN), ****P < 0.0001 (pink stars—indicated group vs SYNB1891) one-way ANOVA with Tukey’s multiple comparisons tests for Day 14; **P = 0.0078 (pink stars—EcN vs SYNB1891, two-tailed unpaired Student’s t test. Individual tumor volumes are presented in Supplementary Fig. 5a). b B16.F10 tumor-bearing mice were treated as described in (a), with additional treatment group receiving three i.t. doses of 50μg smSTING agonist. Long-term survival is shown (**P = 0.006, ***P = [0.0004–0.0006], Mantel–Cox log-rank comparisons for the indicated groups, see Supplementary Fig. 5d, e for tumor growth data). c A20 tumor-bearing mice were treated as described in (a) with saline or varying quantities of SYNB1891. Tumor growth data and ratio of C.R. are shown (**P = 0.0014 (blue stars—indicated group vs 108 CFUs SYNB1891), ***P = 0.0004 (pink stars—indicated group vs 5 × 10CFUs SYNB1891) ****P < 0.0001 (orange stars—indicated group vs 109 CFUs SYNB1891) one-way ANOVA with Tukey’s multiple comparisons tests for Day 21, see Supplementary Fig. 6a, b for individual tumor volumes and long-term survival). d A20 tumor-bearing mice were treated as described in (a) with saline or SYNB1891-cmR (SYNB1891 with chloramphenicol resistance gene). T cells were depleted by administration of anti-CD4 or anti-CD8 antibodies, isotype antibody injected as control. Long-term survival is shown. (*P = 0.041, ****P < 0.0001, N.S. = not significant, Mantel–Cox log-rank comparisons). e Mice treated as described in (c) and remained tumor free by Study day 50 were rechallenged by subcutaneous injection of A20 cells on the contralateral flank alongside naïve age-matched controls. Tumor growth data is shown (Individual tumor volumes are presented in Supplementary Fig. 6c). ae n = 10 mice per group. a, c, e Mean and s.e.m. are shown. Data are representative of two (b, d, e) and three (a, c) independent experiments.
Fig. 6
Fig. 6. SYNB1891 activity in human antigen-presenting cells.
ad THP-1 immortalized human monocyte cells containing an interferon-regulatory factor (IRF)-luciferase reporter and an NF-kB responsive colorimetric reporter were used. a THP-1 cells containing the endogenous STING allele (STING+/+) or lacking STING gene (STING−/−) were treated with pre-induced SYNB1891 at different ratios or media alone overnight. Cells were analyzed for the activation of the IRF reporter via luminescence with relative luminescence units (RLU). b Wildtype THP-1 cells (cGAS+/+) and those lacking the CGAS gene (cGAS−/−) were treated with pre-induced SYNB1891 or Control EcN at different ratios, or media alone overnight. Cells were analyzed for the activation of the IRF reporter and fold IRF induction in treated cells relative to untreated media alone control is shown. c, STING+/+ and STING−/− THP-1 cells were treated as described in (a) with pre-induced SYNB1891. Cells were analyzed for NFκB activity via colorimetric assay at OD655. ac n = 2 biological replicates per group per APC: Bacterial ratio. d THP-1 cells containing an IRF-luciferase reporter and either the endogenous HAQ TMEM173 (STING) allele, knock-ins of the H232 or R232 alleles or knockout of the TMEM173 gene were treated with pre-induced SYNB1891 (MOI: 100) or media alone overnight. Cells were analyzed for the activation of the IRF reporter as described in (b) (*P = 0.0118, ****P < 0.0001, one-way ANOVA with Tukey’s multiple comparisons tests, n = 4 biological replicates per group). e, f Monocyte-derived primary human DCs were treated with Control EcN (MOI: 25), pre-induced SYN1891 (MOI: 25), LPS (100 ng/mL) or smSTING agonist (5 μg/mL) for 4 h. In indicated groups cells were pre-treated for 1 h with Cytochalasin D (10 μM). Human DCs incubated in media alone served as negative control. Cells were analyzed for the upregulation of IFNB1 (e) and IL6 (f) mRNA (****P < 0.0001, two-way ANOVA with Tukey’s multiple comparisons tests, n = 3 biological replicates per group). af Data are representative of two independent experiments. df Data with mean and s.d. shown. Each circle represents an independent experimental replicate.

References

    1. Darvin P, Toor SM, Sasidharan Nair V, Elkord E. Immune checkpoint inhibitors: recent progress and potential biomarkers. Exp. Mol. Med. 2018;50:1–11. - PMC - PubMed
    1. Zou W, Wolchok JD, Chen L. PD-L1 (B7-H1) and PD-1 pathway blockade for cancer therapy: Mechanisms, response biomarkers, and combinations. Sci. Transl. Med. 2016;8:328rv4. - PMC - PubMed
    1. Iribarren K, et al. Trial Watch: Immunostimulation with Toll-like receptor agonists in cancer therapy. Oncoimmunology. 2016;5:e1088631. - PMC - PubMed
    1. Adams S. Toll-like receptor agonists in cancer therapy. Immunotherapy. 2009;1:949–964. - PMC - PubMed
    1. Fu J, et al. STING agonist formulated cancer vaccines can cure established tumors resistant to PD-1 blockade. Sci. Transl. Med. 2015;7:283ra52. - PMC - PubMed

MeSH terms